MACD and KDJ Indicator Basic Analysis Techniques, Helping You Navigate the Digital Currency Market with Ease and Confidence
The most important aspect of investment is not how much you can earn at once, but whether you can control the risk and achieve long-term stable profits. Before any operation, it is essential to first observe the trend, identify the trend accurately, find a suitable entry point, and finally control the timing. By finding the right direction, you can minimize risk and maximize profits. Due to the focus and professional guidance in AICoin's investment, everyone has their own unique experiences and stories!
Technical Post - Basic Analysis Techniques and Introduction of MACD
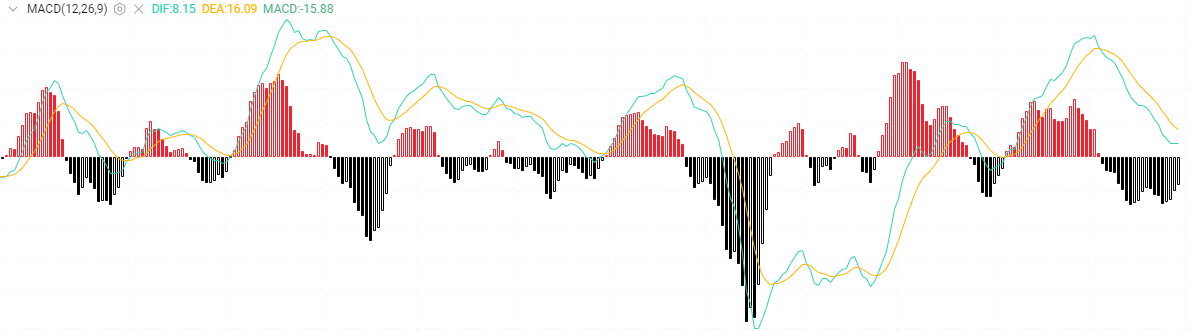
MACD is generally used for mid-term indicator research and can be used to determine short-term reversal points. Its principle is to use the signs of aggregation and dispersion of short-term (fast) and long-term (slow) moving averages for dual-smooth operations, used to judge the timing of buying and selling. This indicator is particularly suitable for trend analysis and judgment of mainstream coins and inactive coins at long-term low levels, but it is not as sensitive to small coins and mainstream coins as KDJ.
The basic analysis techniques of MACD are as follows: more real-time single strategies, online technical learning, and unwinding can be followed on the mentor's official account (Coin Master) to obtain the method of adding: the top ten daily can receive free unwinding strategies.
Principle 1: If DIF > 0, DEA > 0, the trend at this time belongs to a bullish background; if DIF < 0, DEA < 0, the trend at this time belongs to a bearish background. In practical operation thinking, the main position should be consistent with the market background.
Principle 2: When DIF and DEA form a golden cross, that is, when the BAR changes from negative to positive, it is a buy signal; when DIF and DEA change from negative to positive, it is also a buy signal. If the target's trend is upward at this time, the reliability is relatively strong.
Principle 3: When DIF and DEA form a dead cross, that is, when the BAR changes from positive to negative, it is a sell signal; when DIF and DEA change from positive to negative, it is also a sell signal. If the target's trend is downward at this time, the reliability is relatively strong.
Principle 4: When the coin price has already experienced a period of rise and then reaches a new high, at this time, if DIF and DEA have not reached a new high point, you should be cautious of the coin price peaking.
Principle 5: When the coin price has already experienced a period of decline and then reaches a new low, at this time, if DIF and DEA have not reached a new low point, you should pay attention to the coin price bottoming out.
Principle 6: At high price levels, two consecutive dead crosses should be prevented from a sharp drop; at low price levels, two consecutive golden crosses should be noted for a halt in the drop; at this time, the trading volume or reverse news has a particularly large impact on the coin price.
Principle 7: When BAR > 0, if the BAR line becomes flat, it is a short-term sell signal; when BAR < 0, if the BAR line becomes flat, it is a short-term absorption signal.
Principle 8: When the market is in a narrow range, with little fluctuation in the coin price, the accuracy of the MACD indicator is higher; at the same time, when using MACD to guide operations, you should also consider the combination with the trading volume and KDJ.
Technical Analysis - KDJ Indicator
The KDJ indicator, also known as the stochastic indicator, was first proposed by Dr. George Lane. It is a relatively novel and practical technical analysis indicator. It was initially used for analysis in the futures market and later widely used for mid-term trend analysis in markets such as crude oil. It is one of the most commonly used technical analysis tools in financial markets such as futures and crude oil.
I. Basic Definition of KDJ Indicator
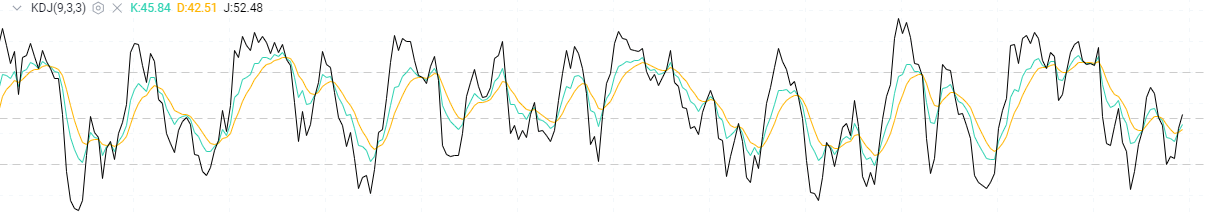
The stochastic indicator KDJ is calculated based on the highest price, lowest price, and closing price, and the K value, D value, and J value form a point on the coordinate of the indicator, connecting countless such points to form a complete KDJ indicator that reflects the trend of price fluctuations. It mainly uses the true range of price fluctuations to reflect the strength and overbought and oversold phenomena of price trends, and is a technical tool that issues buy and sell signals before prices rise or fall. In the design process, it mainly studies the relationship between the highest price, lowest price, and closing price, and also integrates some advantages of momentum concept, strength index, and moving average line, so it can judge the market situation quickly, intuitively, and accurately.
II. The main points of practical analysis and judgment of the KDJ indicator are as follows:
(1) Overbought and Oversold
1) The K line is the fast confirmation line—values above 90 are overbought, and values below 10 are oversold; 2) The D line is the slow main line—values above 80 are overbought, and values below 20 are oversold; 3) The J line is the direction-sensitive line. When the J value is greater than 100, especially for more than five consecutive periods, the coin price will at least form a short-term top. Conversely, when the J value is less than 0, especially for several consecutive periods, the coin price will at least form a short-term bottom.
(2) Golden Cross
When the K value gradually becomes greater than the D value, showing the K line crossing above the D line on the graph, indicating the current trend is upward, so when the K line breaks above the D line on the graph, it is a buy signal. In practical terms, when the K and D lines cross upwards below 20, the short-term buy signal is relatively accurate; if the K value is below 50 and crosses above the D value twice in a row, forming a "W bottom" with the right bottom higher than the left bottom, the future coin price may have a considerable increase.
(3) Death Cross
When the K value gradually becomes less than the D value, showing the K line crossing below the D line on the graph, indicating the current trend is downward, so when the K line breaks below the D line on the graph, it is a sell signal. In practical terms, when the K and D lines cross downwards above 80, the short-term sell signal is relatively accurate; if the K value is above 50 and crosses below the D value twice in a row, forming an "M top" with the right top lower than the left top, the future coin price may have a considerable decrease.
(4) Divergence
Judging the coin price top and bottom through the trend divergence between KDJ and the coin price is also a practical method:
1) When the coin price reaches a new high and the KD value does not reach a new high, it is a top divergence and should be sold; 2) When the coin price reaches a new low and the KD value does not reach a new low, it is a bottom divergence and should be bought; 3) When the coin price does not reach a new high and the KD value reaches a new high, it is a top divergence and should be sold; 4) When the coin price does not reach a new low and the KD value reaches a new low, it is a bottom divergence and should be bought.
It should be noted that the method of determining KDJ top and bottom divergence can only be compared with the KD value at the previous high and low points, and cannot skip comparisons. Of course, everything has its pros and cons. Due to its high sensitivity, KDJ will change frequently and sometimes produce false signals. Correct use of the KDJ indicator can help you navigate the digital currency market with ease and confidence.
I am Coin Master! I publish market analysis and guidance strategies at fixed times every day, and also provide occasional real-time price calls! This team will be carefully created by Coin Master and more than 20 top analysts in the industry to provide free technical support and risk management for coin friends.
The road of trading is full of variables, and every decision needs to be cautious. By continuously learning, improving your knowledge and skills, and maintaining a good mindset, you can go further and gain more on this path. It is not only the pursuit of wealth, but also the process of self-awareness and growth.
For more real-time singles, follow my public account to get them. You can also learn about real-time market technical analysis and unwinding. I have studied the market for many years, analyzed the major trends in the coin circle, and have studied and guided BTC, ETH, DOT, LTC, FIL, EOS, BCH, ETC, and other coins multiple times. Welcome all coin friends who are not familiar with operations to study and learn together!

免责声明:本文章仅代表作者个人观点,不代表本平台的立场和观点。本文章仅供信息分享,不构成对任何人的任何投资建议。用户与作者之间的任何争议,与本平台无关。如网页中刊载的文章或图片涉及侵权,请提供相关的权利证明和身份证明发送邮件到support@aicoin.com,本平台相关工作人员将会进行核查。