Crypto News
July 6th Hot Topics:
1. The U.S. House of Representatives will vote next week to overturn President Biden's veto of SAB 121.
2. Multicoin will provide up to $1 million in Solana donations to candidates supporting cryptocurrencies.
3. U.S. tech stocks collectively hit historic highs, while the crypto market seems to be in danger, seemingly unrelated to technology.
4. Zircuit mainnet is set to be released, with the first quarter snapshot scheduled for July 7th.
5. QCP Capital: Market panic is gradually subsiding, with Bitcoin finding good support at 54k, and the probability of interest rate cuts in September and December increasing.
Trading Insights
Public panic, experts rejoice. The current market is extremely cold, and yesterday's sharp drop has caused widespread lamentation. Many people believe that the bull market has ended, and are cutting losses one after another, indicating the market's icy state. This kind of decline would completely wipe out anyone who has leveraged their positions, leaving almost nothing behind. This is why leveraging is not recommended. As long as you don't use leverage and avoid impulsive trading, this kind of market won't hurt you. Now is the time when the public is extremely panicked, while the experts are extremely pleased. The entire market has been undervalued for too long, and now is the time for patience and competition.
LIFE IS LIKE A JOURNEY ▲
Below are the real trading signals from the Da Bai Community this week. Congratulations to the friends who followed. If your trading hasn't been smooth, you can give it a try.
Real data, each signal has a screenshot taken at the time.
Search for the public account: Da Bai Lun Bi
BTC
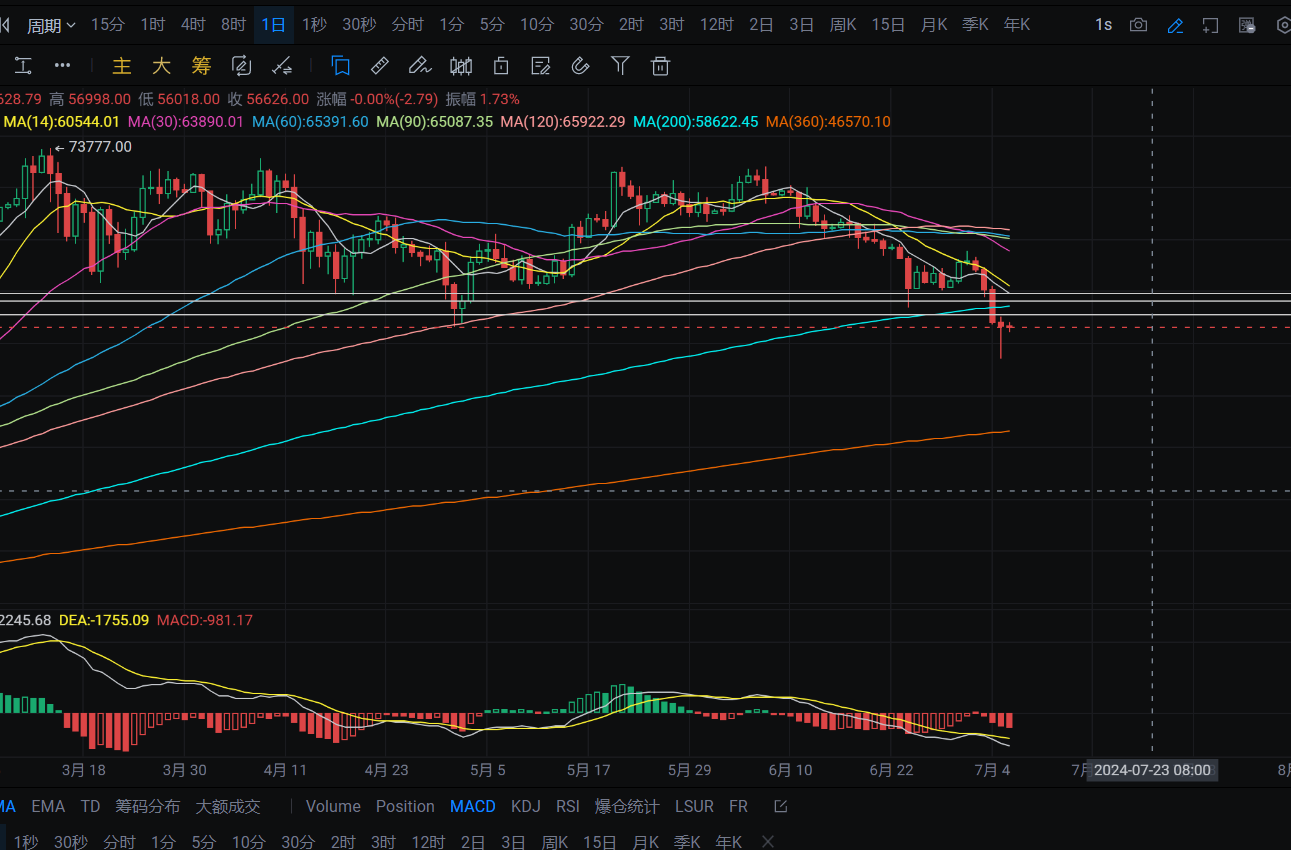
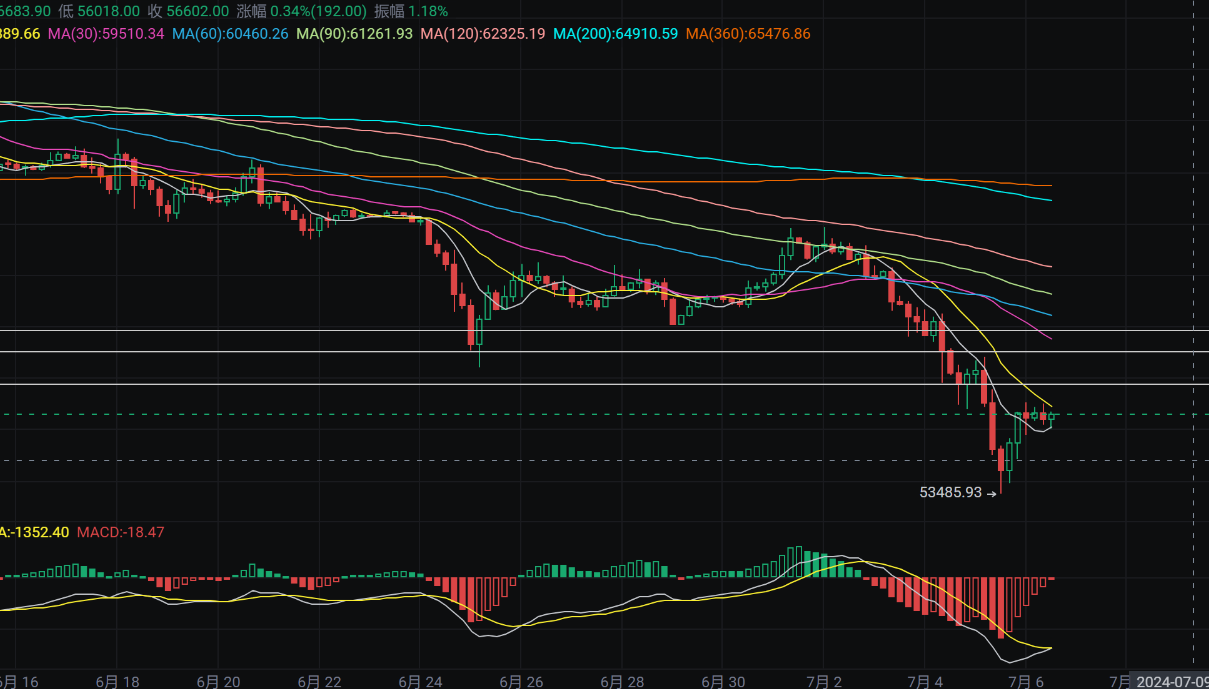
Analysis
Bitcoin's daily chart yesterday saw a downward spike to around 53480 before rebounding and closing near 56600. The top pressure is near the MA7 moving average line. If it rebounds to this level, you can try to short here. The MACD is showing increasing bearish momentum. The four-hour structure pressure is near the MA14 moving average line. If a breakthrough occurs, it can be seen up to near the MA30. The MACD is showing decreasing bearish momentum and there are signs of a golden cross. Short-term shorts can be entered near 59800, with targets around 59000-57750.
ETH
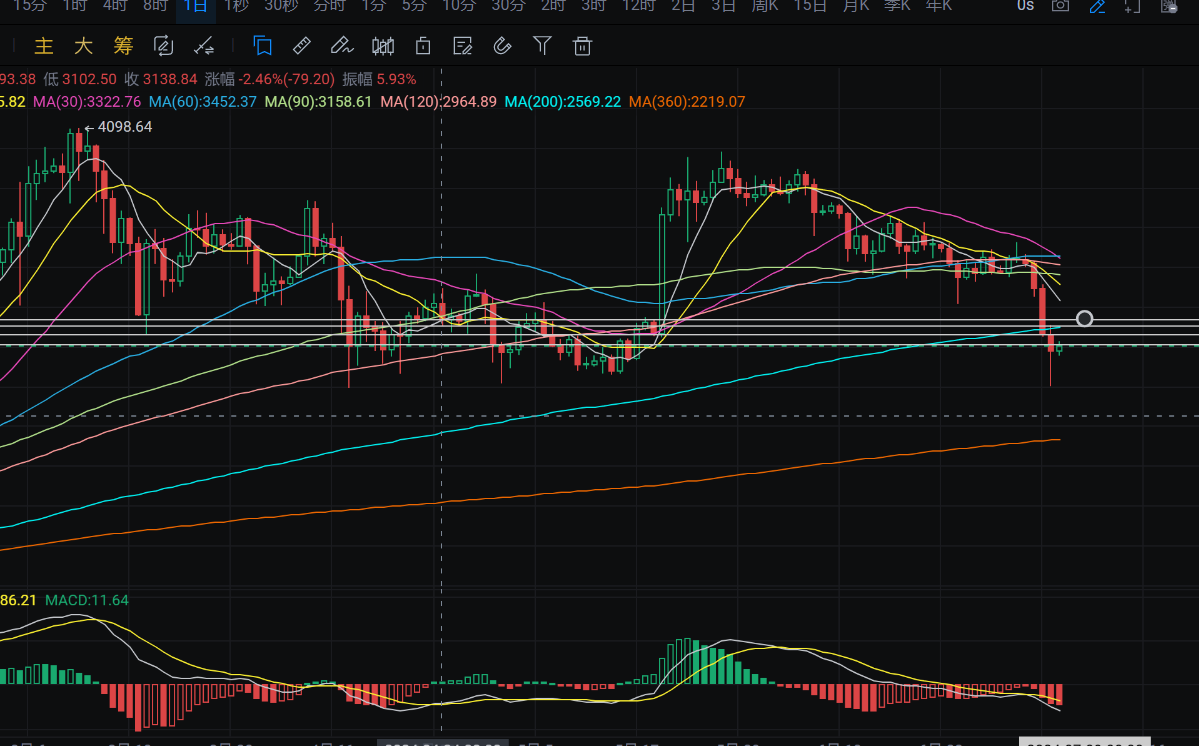
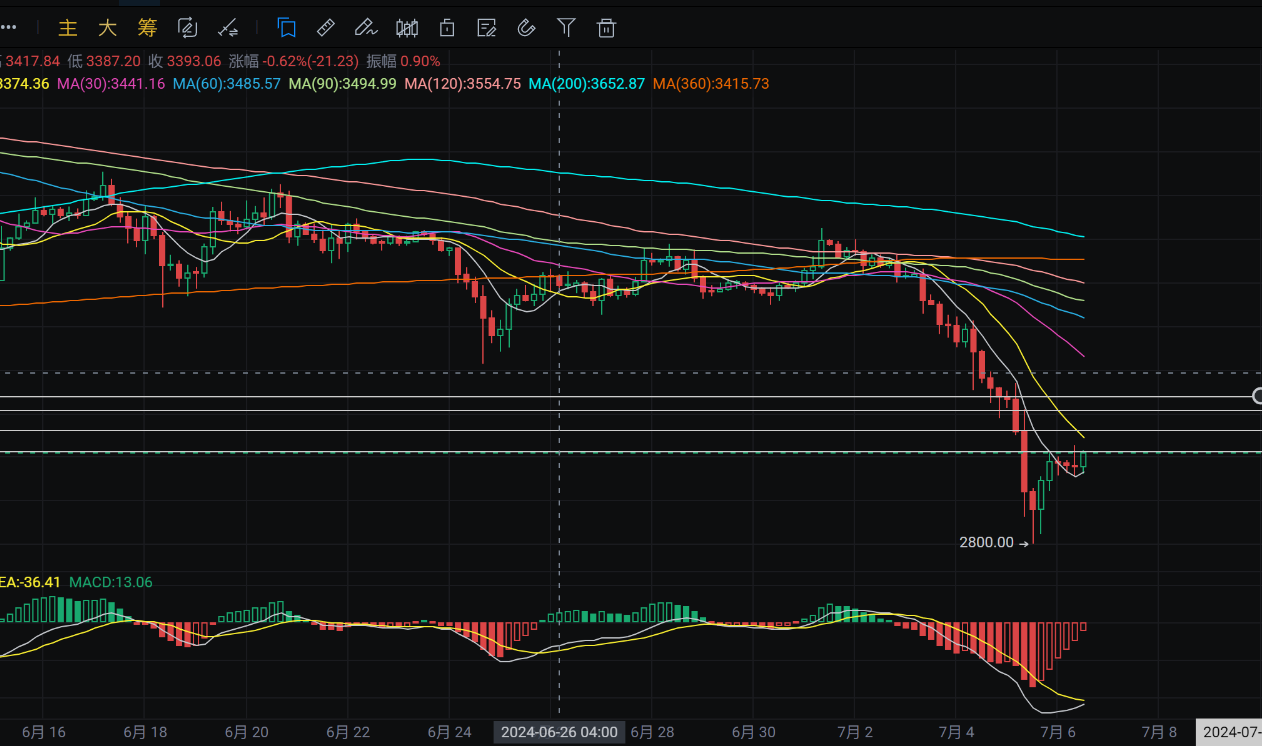
Analysis
Ethereum's daily chart yesterday saw a downward spike from the MA200 moving average line to around 2800 before rebounding and closing near 2980. The upper pressure is near the MA200 moving average line. If it rebounds to this level again, you can short. The MACD is showing increasing bearish momentum. The four-hour structure has tested the MA7 moving average line multiple times and is stabilizing support. The upper pressure is near the MA14 moving average line. The MACD is showing decreasing bearish momentum and there are signs of a golden cross. Short-term shorts can be entered near 3108-3140, with target positions around 3060-3010.
Disclaimer: The above content is for personal reference only and does not constitute specific trading advice, nor does it bear legal responsibility. Market conditions change rapidly, and the article has a certain lag. If there is anything you don't understand, feel free to ask for advice.
免责声明:本文章仅代表作者个人观点,不代表本平台的立场和观点。本文章仅供信息分享,不构成对任何人的任何投资建议。用户与作者之间的任何争议,与本平台无关。如网页中刊载的文章或图片涉及侵权,请提供相关的权利证明和身份证明发送邮件到support@aicoin.com,本平台相关工作人员将会进行核查。


