Continuous Decline! Only a few words can describe the cryptocurrency market this week. Starting from around $63,894 on Monday (July 1st), the price has been falling continuously, reaching a new low of around $53,485 on Friday noon, the lowest in nearly four months. At the time of writing, the price is quoted at $55,330, with a 6.01% decrease in the past 24 hours.
Summarizing the recent reasons for the Bitcoin decline, first, at around 8:30 am today, Mt.Gox transferred approximately $2.71 billion worth of Bitcoin from its cold wallet. Although the purpose of this transfer is unclear, it is speculated that it may be related to the exchange's debt repayment, causing panic in the market. Second, the German government's wallet address once again transferred approximately $175 million worth of Bitcoin yesterday, totaling about $300 million worth of Bitcoin in two weeks, and still holding over 40,000 coins worth about $2.32 billion.
Bitcoin 4-hour chart
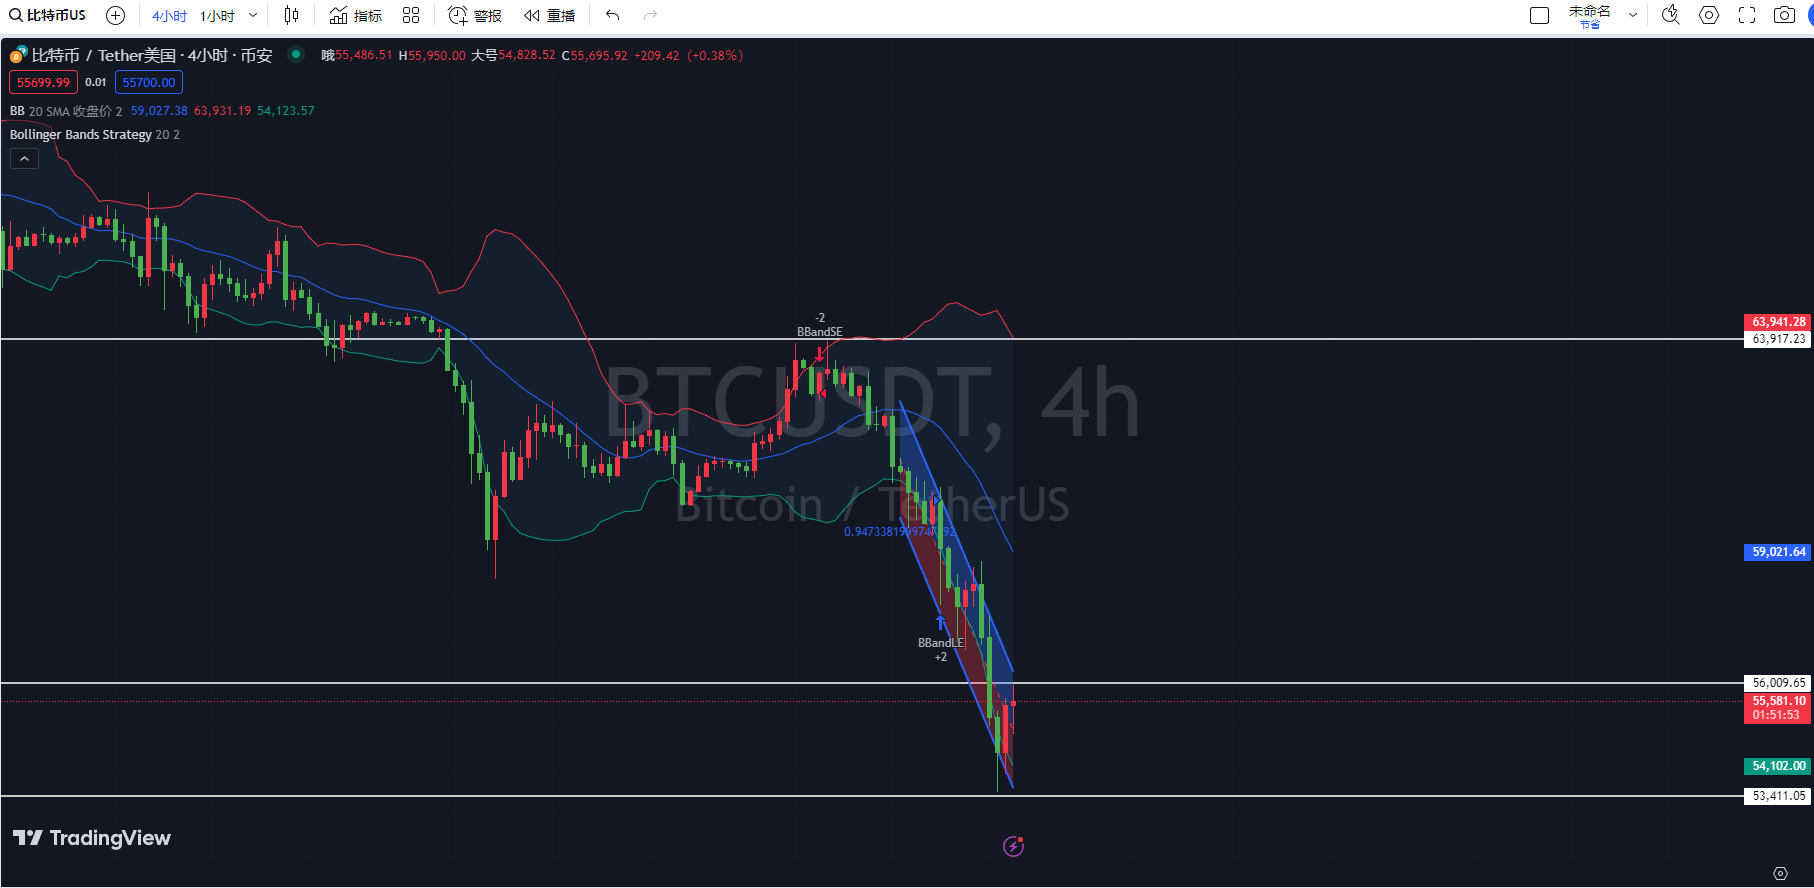
First, according to the Bollinger Bands indicator on the 4-hour Bitcoin chart, the price is running between the middle band and the lower band, close to the lower band, indicating that the market is currently in a weak state. The widening of the Bollinger Bands indicates increased market volatility, possibly leading to significant price fluctuations.
Second, based on the KDJ indicator on the 4-hour Bitcoin chart, all three lines are running at low levels, indicating that the market is still in a weak state. However, the J line is in the oversold zone, indicating a demand for a rebound, but the K line and D line have not formed a clear rebound signal.
Finally, according to the MACD indicator on the 4-hour Bitcoin chart, the DIF line is running below the DEA line, and both lines are moving downward, indicating a bearish trend in the market. The MACD histogram is continuously increasing, indicating a continued strengthening of the bearish force.
Bitcoin 1-hour chart
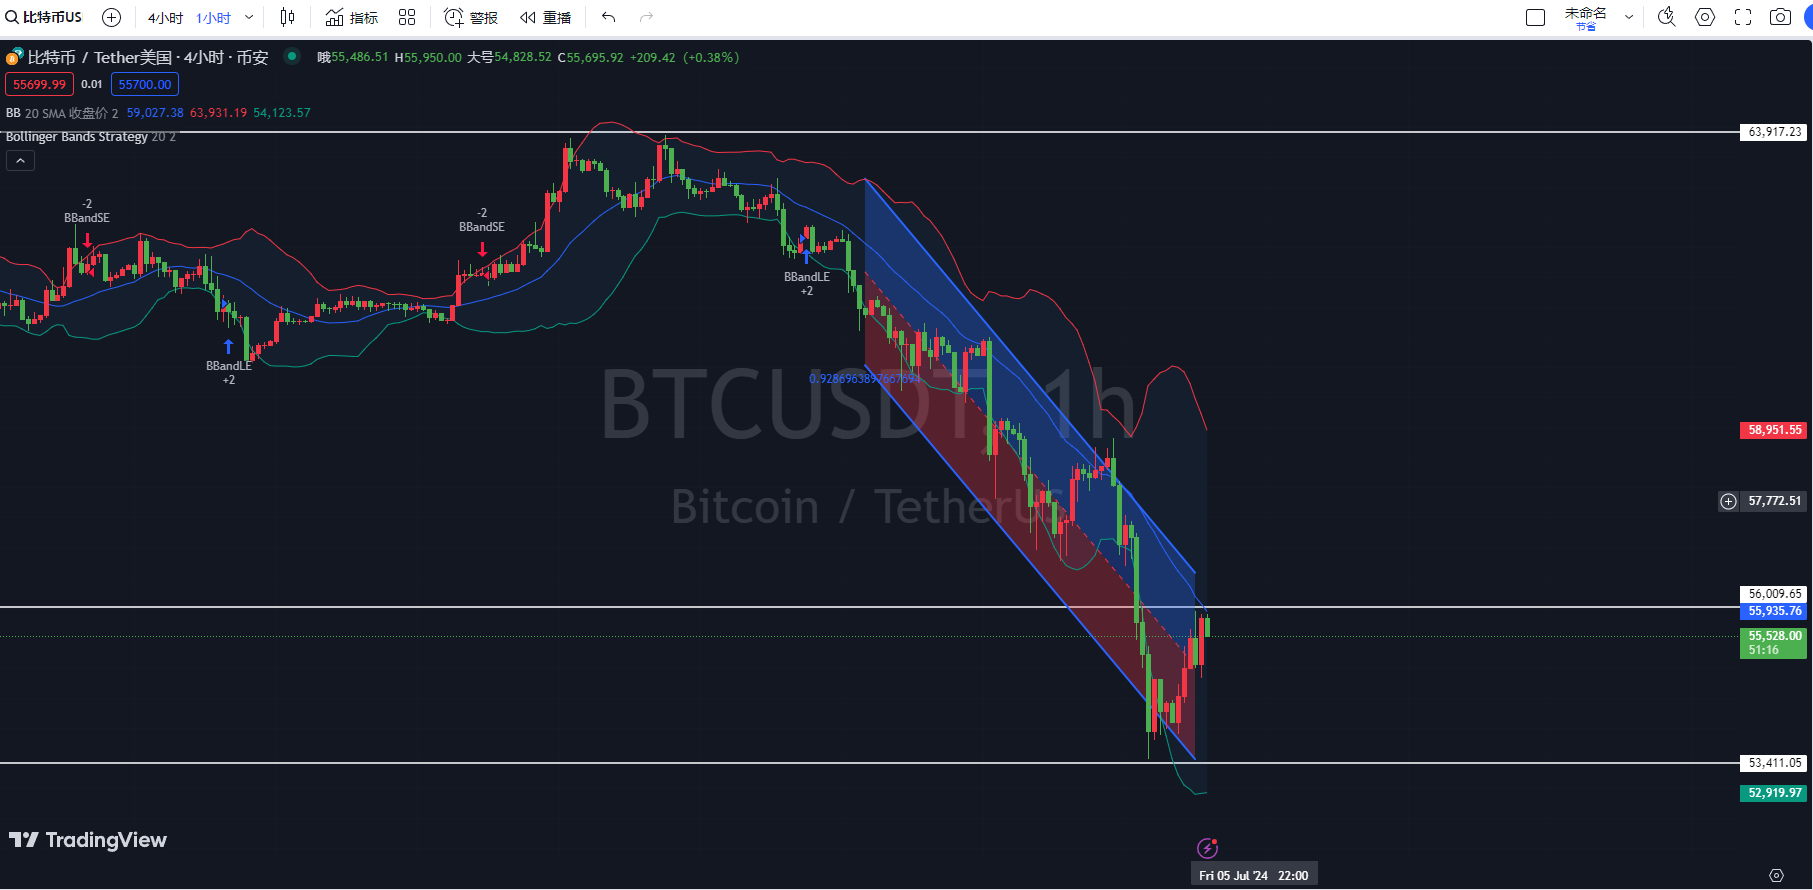
First, according to the Bollinger Bands indicator on the 1-hour Bitcoin chart, the price is running between the middle band and the upper band, indicating a relatively strong market state. There are signs of slight contraction in the Bollinger Bands, indicating a decrease in market volatility. There are no clear signs of a rebound or pullback, and further observation is needed to see if the price breaks through the upper band or falls below the middle band.
Second, based on the KDJ indicator on the 1-hour Bitcoin chart, the K line is running above the D line, showing strong short-term upward momentum in the market. However, the J line is at a high level, in the overbought zone, indicating the risk of a short-term pullback.
Finally, according to the MACD indicator on the 1-hour Bitcoin chart, the DIF line is approaching the DEA line from below, and there is a trend of the two lines forming a golden cross. If the DIF line can cross above the DEA line, it will be a clear buying signal. The MACD green histogram is gradually shortening, indicating a weakening bearish force. If the histogram changes from green to red, it will further confirm the bullish trend.
Comprehensive analysis: Based on the 4-hour Bitcoin chart, there may continue to be a downward oscillation in the short term, but due to the oversold KDJ, one should be cautious of potential rebounds. Based on the 1-hour Bitcoin chart, there may be a small rebound in the short term, but due to the overbought KDJ, there is a risk of a pullback. Therefore, it is advisable to wait for the MACD to form a golden cross before confirming the upward trend before taking action.
In conclusion, the following suggestions are provided for reference:
Short Bitcoin at around 56,000-56,100 for a target of 54,800 and a defensive position at 56,700.
Instead of giving you a 100% accurate suggestion, it's better to provide you with the correct mindset and trend. After all, teaching someone to fish is better than giving them a fish. The suggestion is to focus on the mindset, grasp the trend, and plan the market layout and position. I can only use my practical experience to help everyone make investment decisions and manage operations in the right direction.
Drafting time: (2024-07-05, 21:25)

(By - Coin Master) Disclaimer: The publication on the internet has a delay, and the above suggestions are for reference only. The author is dedicated to research and analysis in the investment fields of Bitcoin, Ethereum, altcoins, foreign exchange, stocks, and has been involved in the financial market for many years, with rich experience in actual trading operations. Investment involves risks, so caution is advised when entering the market. For more real-time market analysis, please follow Coin Master for discussions and exchanges.
免责声明:本文章仅代表作者个人观点,不代表本平台的立场和观点。本文章仅供信息分享,不构成对任何人的任何投资建议。用户与作者之间的任何争议,与本平台无关。如网页中刊载的文章或图片涉及侵权,请提供相关的权利证明和身份证明发送邮件到support@aicoin.com,本平台相关工作人员将会进行核查。