Daily Sharing
Bitcoin has currently dropped below 56552. Structurally, it is currently undergoing a weekly downtrend, negating the previous view of constructing a daily line center through oscillation over the past few months. The target of the weekly downtrend is the retracement of the rise from 15476 to 73777, with the first retracement position being the 0.382 of the previous rise at 51500, and the second position being the 0.5 of the previous rise at 44626. It is more reasonable to actually retrace to 0.382, but precautions need to be taken to prevent further retracement to the 0.5 position.
It should be noted that although a weekly downtrend has formed, it does not mean that the weekly downtrend has just begun. From mid-March to now in July, the nearly 4-month oscillating downtrend is part of the weekly downtrend. In other words, the entire weekly downtrend has been going on for 4 months, but it was only confirmed after dropping below 56552.
Next, we still need to pay attention to the downward momentum and see if the area around 50000 can hold. If it cannot, the next step will be to look towards 44500.
Since it is a weekly downtrend, there is no need to be overly anxious. After the drop, Bitcoin will not reverse so quickly, and the bottom will need at least another 1-2 months of oscillation. The market will transition from a one-way downtrend to a low-level oscillation and washing out. During this stage, repeatedly making short-term trades in Bitcoin is the most comfortable. Of course, the one-way downtrend here has not ended yet, and there should still be a period of further decline. So, for those who want to trade in the range of oscillation, they can wait a little longer.
For altcoins, they have already moved out of the bear market route, but in reality, July and August are also opportunities for altcoins to pick up cheap chips. When the next wave of weekly uptrend in Bitcoin starts, altcoins will rebound 5-10 times from the low level.
BTC Medium and Long Term
Weekly:
At the weekly level, the structure has undergone a new change. Since the daily retracement has dropped below 56552, Bitcoin has completed a down-up-down trend structurally, forming a weekly downtrend.
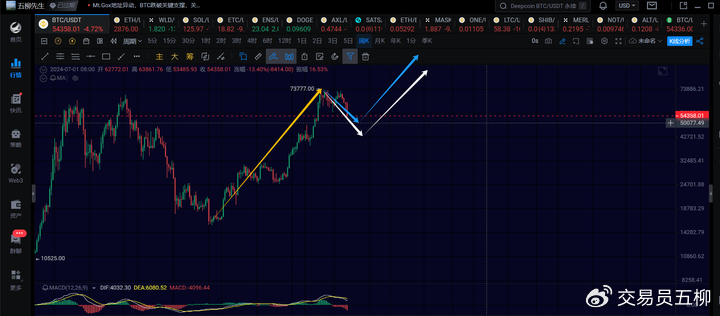
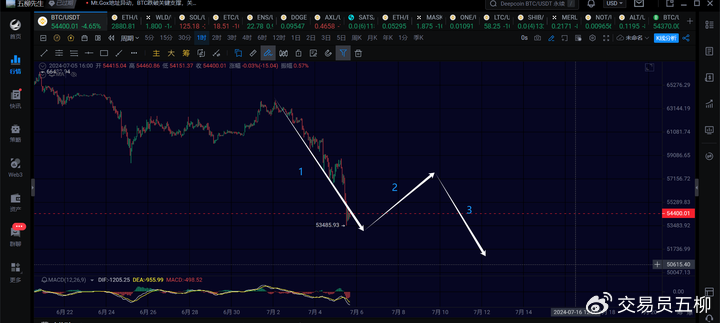
Starting from 15476, the rise from 15476 to 73777 is a weekly uptrend, and the retracement from 73777 to 53485 (not the final point) is a weekly downtrend. This weekly downtrend has not yet ended, and it remains to be seen whether it will go near 50000 (as indicated by the blue arrow) or near 44500 (as indicated by the white arrow). After this weekly downtrend is completed, there will be a third wave of weekly uptrend, with the expected target being over 100,000.
Daily:
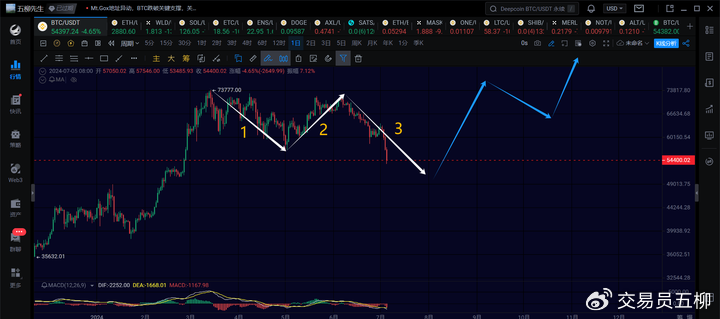
At the daily level, the structure of the entire weekly downtrend is as shown in the above figure. From 73777 to 56552 is the first daily downtrend within the weekly retracement, from 56552 to 71997 is the second daily rebound within the weekly retracement, and from 71997 to below 54000 is the third daily downtrend within the weekly retracement.
This third daily downtrend is clearly not over yet, and it may not end until August. Currently, 53485 is not the final low point, and attention can be paid to the support near 50000. If it still cannot hold, further observation near 44500 will be needed.
After the completion of the three retracements indicated by the white arrows in the above figure, the next wave will be the blue arrow's weekly uptrend, which still requires waiting.
4H:
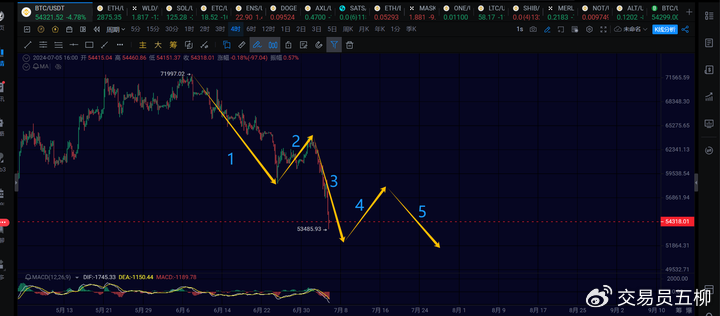
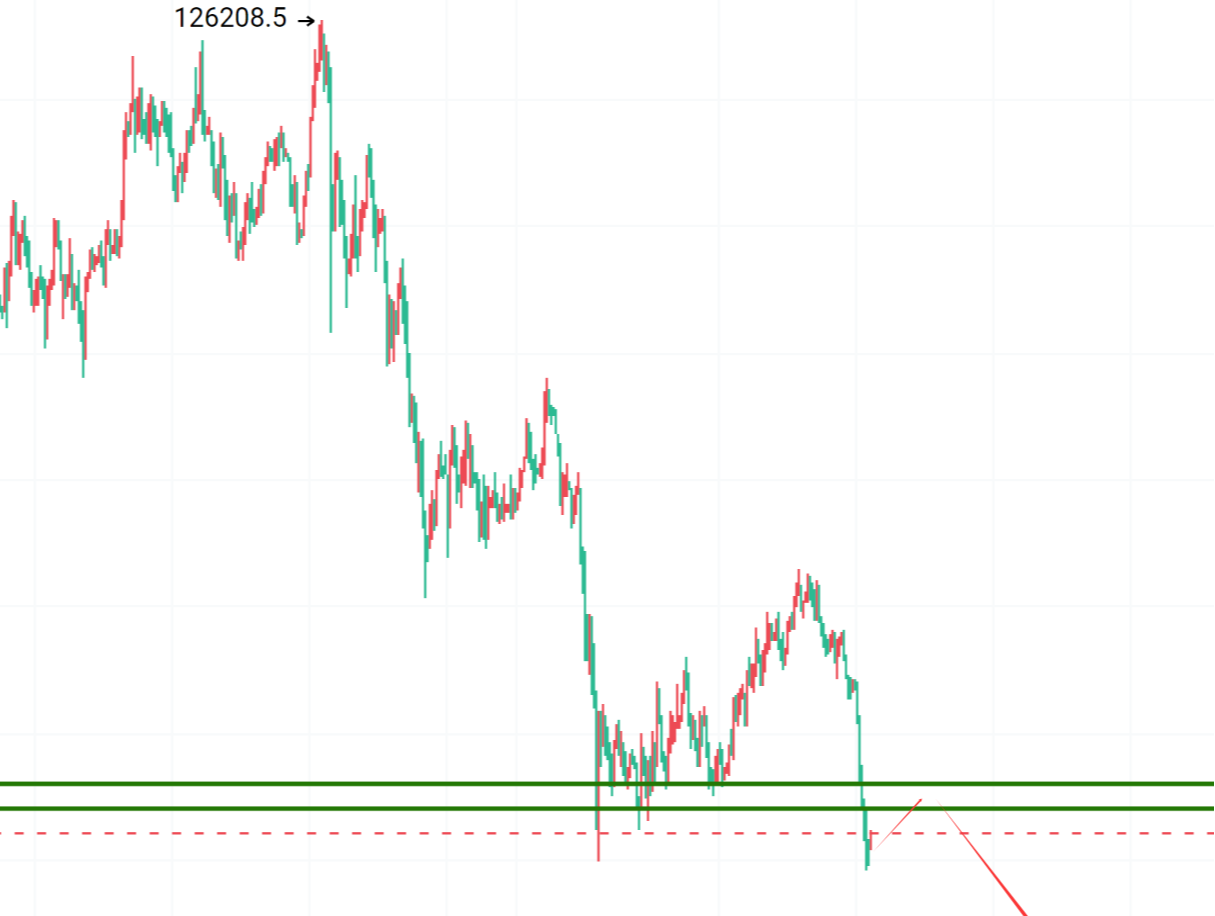
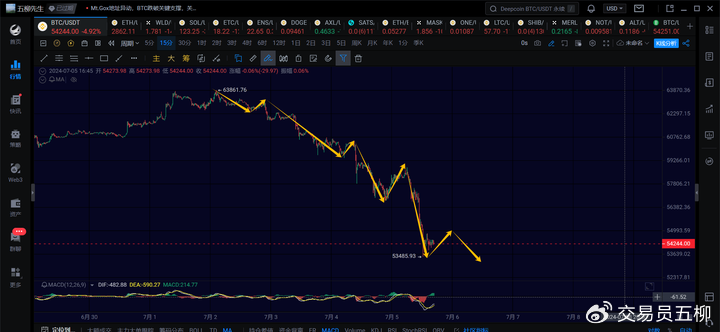
At the 4-hour level, the third 4-hour downtrend within the daily downtrend is currently underway. This 4-hour downtrend started at 63861 and has already dropped by 16.2% in just 3 days, indicating a major downtrend. The third 4-hour downtrend has not yet ended, and further attention should be paid to the area near 51500-52000. After this 4-hour retracement is completed, there will be a fourth 4-hour rebound and a fifth 4-hour retracement, indicating an overall oscillating downtrend that is expected to take about a month to complete.
BTC Short Term
Due to the rapid changes in the market, this article can only make predictions about the market at the time of publication. Short-term players should pay attention to the latest market changes and use this information as a reference only.
1H:
At the 1-hour level, it is still the first 1-hour downtrend within the 4-hour downtrend. This 1-hour downtrend has already dropped by $10,000, constituting the main downtrend within the entire 4-hour downtrend. In the short term, attention should be paid to the support near 52500-53000. If it holds, a 1-hour rebound can be expected over the weekend. The second 1-hour rebound will face resistance near 57500-58500, and the expected rebound strength is not likely to reach that high, indicating a weak rebound. After the third 1-hour downtrend is completed, a stronger rebound may be possible.
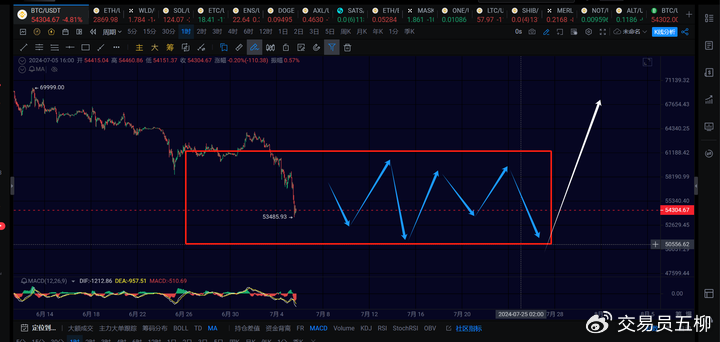
From the 1-hour structure, after the completion of this 4-hour retracement in Bitcoin, there will definitely be repeated oscillations within a certain range, constructing a center, until the daily downtrend structure is complete, and only then can a new uptrend be expected.
15M:
At the 15-minute level, the first 1-hour downtrend is still not over, and there may be another retracement to the 52000-53000 range in the short term. Specific observations can be made, and if the short-term rebound breaks through 55500, a second 1-hour rebound is likely. If the short-term retracement stabilizes above 52000, then a 1-hour rebound can also be expected.
ETH
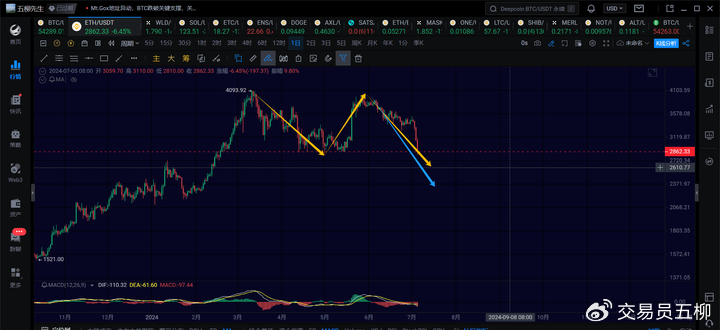
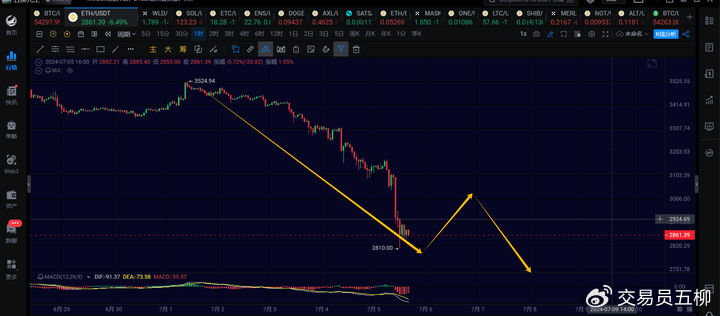
Ethereum has also dropped below the previous low of 2817. The current third daily retracement first looks for support near 2600, and if it drops further, it will be observed near 2350. If Bitcoin can stabilize near 50000, then Ethereum may also have a chance to stabilize above 2600. Specific observations can be made over a period of time.
At the 1-hour level, it is currently the first 1-hour downtrend within the 4-hour downtrend. This downtrend has dropped by 20%, indicating a relatively sharp decline. The first 1-hour downtrend may not have ended yet, and further support can be observed near 2750-2800. It is expected that a 1-hour rebound will occur over the weekend, with resistance already near 3000. After the rebound, there will be a third 1-hour downtrend.
At the current stage, it is still not an opportunity to buy at the bottom, and patience is needed until the 4-hour structure is in place.
Trend Direction
Weekly Level: Downward, currently undergoing a weekly downtrend, which needs to be completed before a new weekly uptrend towards over 100,000.
Daily Level: Downward, currently undergoing a retracement from around 72000, with attention to 50000 or 44500.
4-hour Level: Downward, currently undergoing the third 4-hour downtrend, which is the main downtrend and has not yet ended.
1-hour Level: Downward, still the continuation of the first 1-hour downtrend, with a possible weak rebound over the weekend.
15-minute Level: Downward, with attention to the 52000-53000 range.
Feel free to follow my work account for further discussion and exchange:

The article is time-sensitive, so be aware of the risks. The above is only personal advice and is for reference only!
免责声明:本文章仅代表作者个人观点,不代表本平台的立场和观点。本文章仅供信息分享,不构成对任何人的任何投资建议。用户与作者之间的任何争议,与本平台无关。如网页中刊载的文章或图片涉及侵权,请提供相关的权利证明和身份证明发送邮件到support@aicoin.com,本平台相关工作人员将会进行核查。