
The cryptocurrency market has been heavily criticized recently, similar to the situation with cancer stocks. As of the time of writing, Bitcoin has dropped to a low of 53485, and Ethereum to 2810. The fear and greed index is expected to reach 29 today, hitting a new low in a year. It was mentioned yesterday that the retest of the "M" head support is a key watershed for the bull and bear market. If it falls below 56552, it is recommended to reduce holdings by half in the spot market to prevent the occurrence of a special event similar to the 519/312 black swan. Many people are comparing it to 312/519 today, and the daily decline of the copycat is unbearable after being halved.
We have already warned about the comparison with the current situation and the 519 market on April 25, and reminded about the potential "M" head pattern at the weekly level on June 12. It was advised to reduce holdings on the spot market at high levels and be cautious of a sharp decline similar to the 519 market. This includes the reasons for the bearish view. On June 14, it was reminded that under strong pressure, the rejection occurred, with a double negative on the daily chart, indicating an imminent sharp decline. Those interested can take a look!

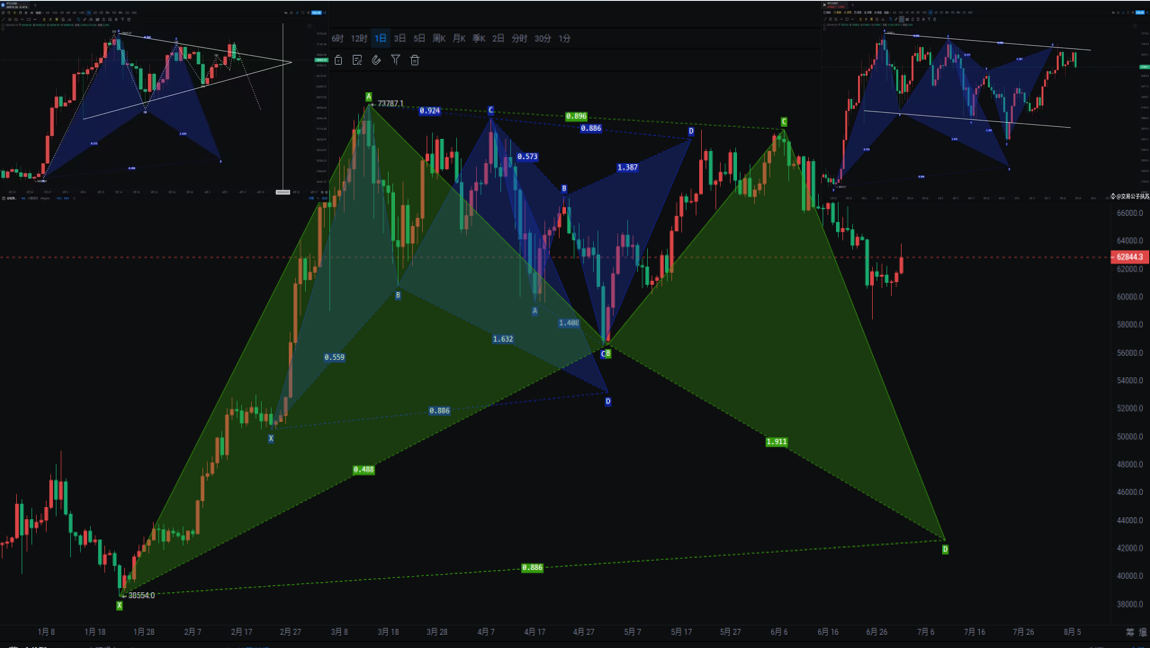
Bitcoin
It was mentioned yesterday that if the diagonal line breaks the horizontal line, the morning will break the "M" head neckline, maintaining a high-level oscillation for 4 months, and choosing to break. The MACD has repeatedly indicated that the downward trend has not changed as it has been in a continuous state of increasing downward bars.
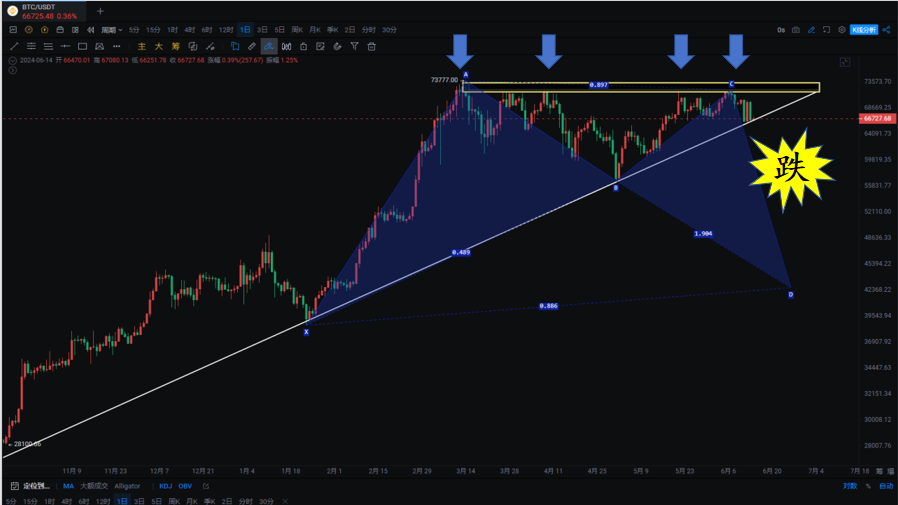
The daily chart is accelerating its decline, with a significant increase in trading volume. The decline is not over yet, so friends who want to buy the dip should not rush. Previously, we mentioned the first buying opportunity at 59600-62000 (already broken), the second buying opportunity at 55000-56552 (already broken), and the third buying opportunity at 43000-45000 (in extreme cases). It will correct and patience is required. This means there is still a minimum of 10,000 points of downside in this wave, a drop of 37%-40%.
Support:
Resistance:
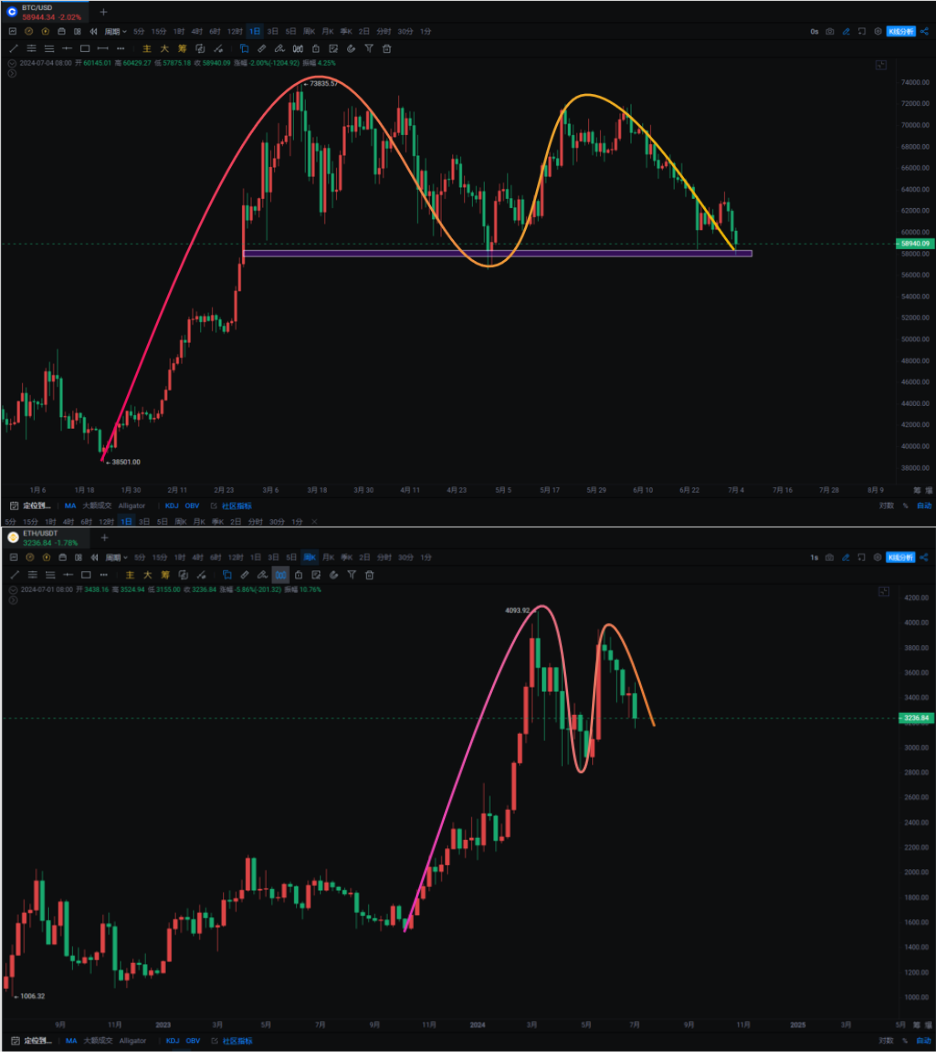
Ethereum
After breaking the triangle, Ethereum directly tested the support near the previous bottom around 2800. In the short term, there is support, but if Bitcoin fails to recover after breaking the "M" head, Ethereum is likely to break as well. Once it breaks, it will return to its original state. Wait for the dip to return to these levels! Specific changes in the middle can be continuously monitored, and updates will be provided.
Support:
Resistance:
If you like my views, please like, comment, and share. Let's go through the bull and bear markets together!!!
The article is time-sensitive and is for reference only, with real-time updates.
Focus on candlestick technical research, and win-win global investment opportunities. WeChat public account: 交易公子扶苏

免责声明:本文章仅代表作者个人观点,不代表本平台的立场和观点。本文章仅供信息分享,不构成对任何人的任何投资建议。用户与作者之间的任何争议,与本平台无关。如网页中刊载的文章或图片涉及侵权,请提供相关的权利证明和身份证明发送邮件到support@aicoin.com,本平台相关工作人员将会进行核查。


