Originally, the market expected Bitcoin to experience a significant rebound in July, but the market's optimism was dampened yesterday. The price of Bitcoin reached around $59,570 yesterday evening, although it briefly rose above $60,000. However, the lowest point today reached $56,771, marking the lowest point in nearly two months. At the time of writing, the price has slightly increased to $57,245.
The reason for Bitcoin's renewed decline is attributed by many to the German government transferring a total of 1,300 BTC to three exchanges in the afternoon. Although the German government's transfer of Bitcoin to exchanges may not necessarily be for selling, this move could cause investor panic and lead to a sell-off.
On the other hand, many may wonder how far Bitcoin will need to fall before stabilizing or reversing. Through the MA indicator, we can see that the key support level of 200MA at $58,484 has been breached. The next support point will be at $56,500, which is the RSI bottom and has formed a double bottom. If this point can effectively stop the downward trend, there is a chance of a bullish divergence and a potential return to around $60,500. If this position cannot effectively support the price, Bitcoin may fall to $50,000-52,000.
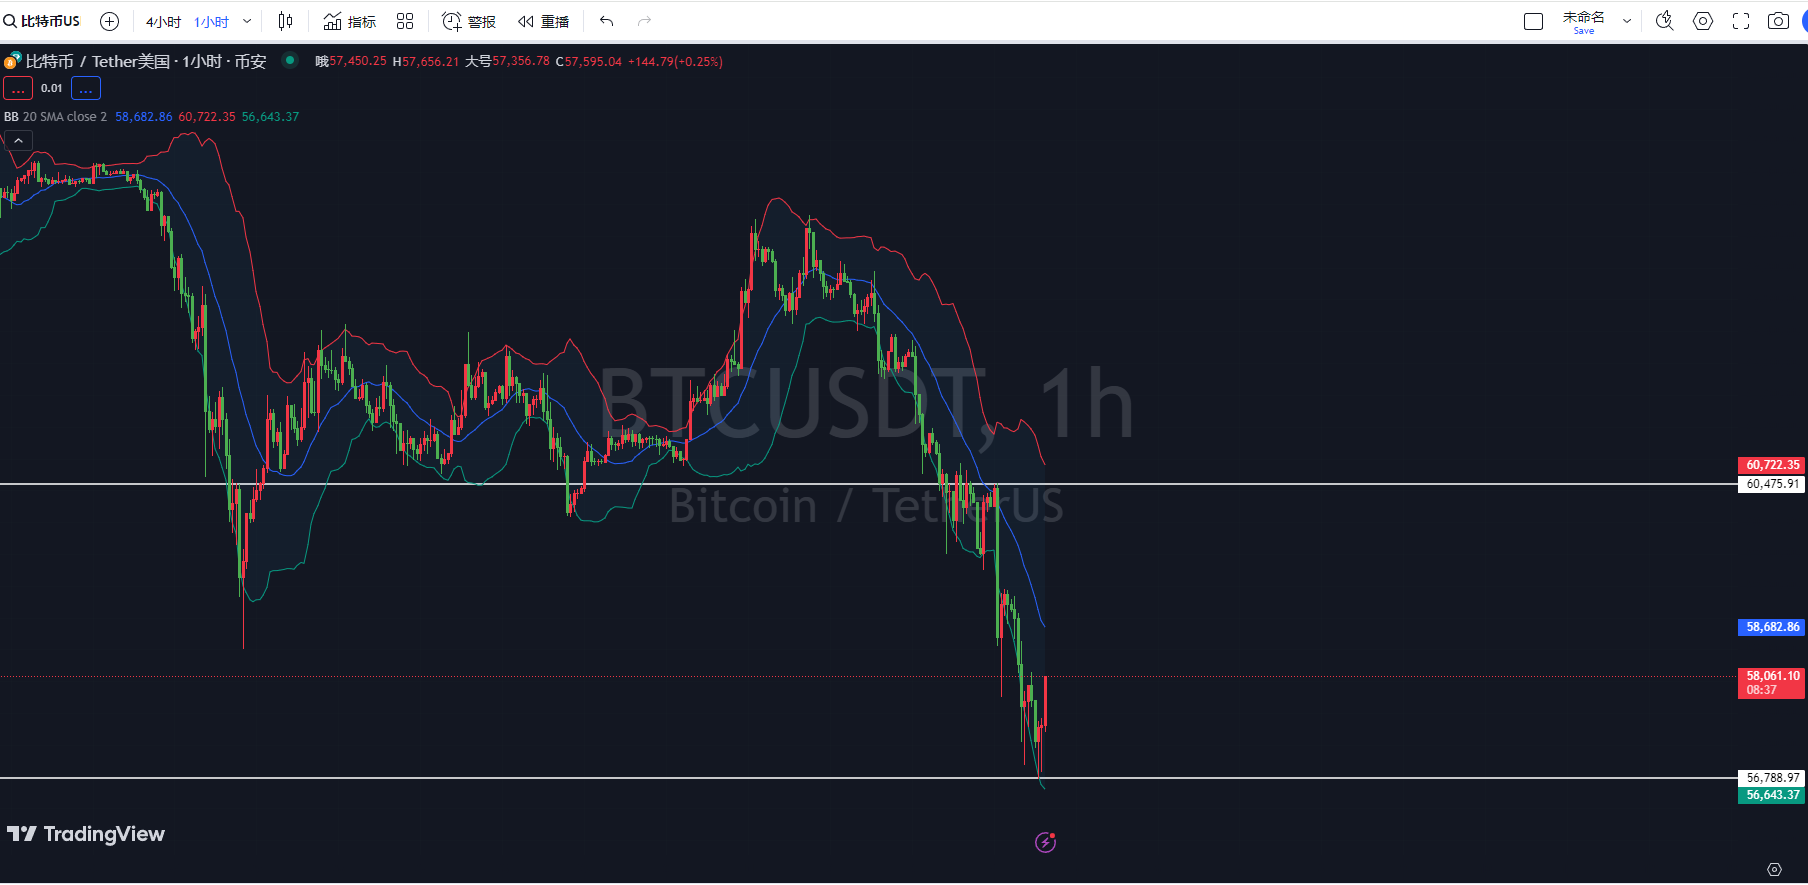
Bitcoin 4-hour chart
Firstly, according to the Bollinger Bands indicator on the 4-hour chart, the current price is running below the lower Bollinger Band and has a continuing downward trend, indicating strong bearish momentum.
Secondly, based on the KDJ indicator on the 4-hour chart, the current KDJ three-line values are at a low level, indicating oversold conditions and the possibility of a rebound. However, the J-line value has not turned, and there is no clear reversal signal at the moment.
Finally, according to the MACD indicator on the 4-hour chart, the DIF line is below the DEA line, and the gap between the two is widening, indicating a clear downward trend in the market. The MACD green histogram is gradually lengthening, indicating an increasing downward momentum.
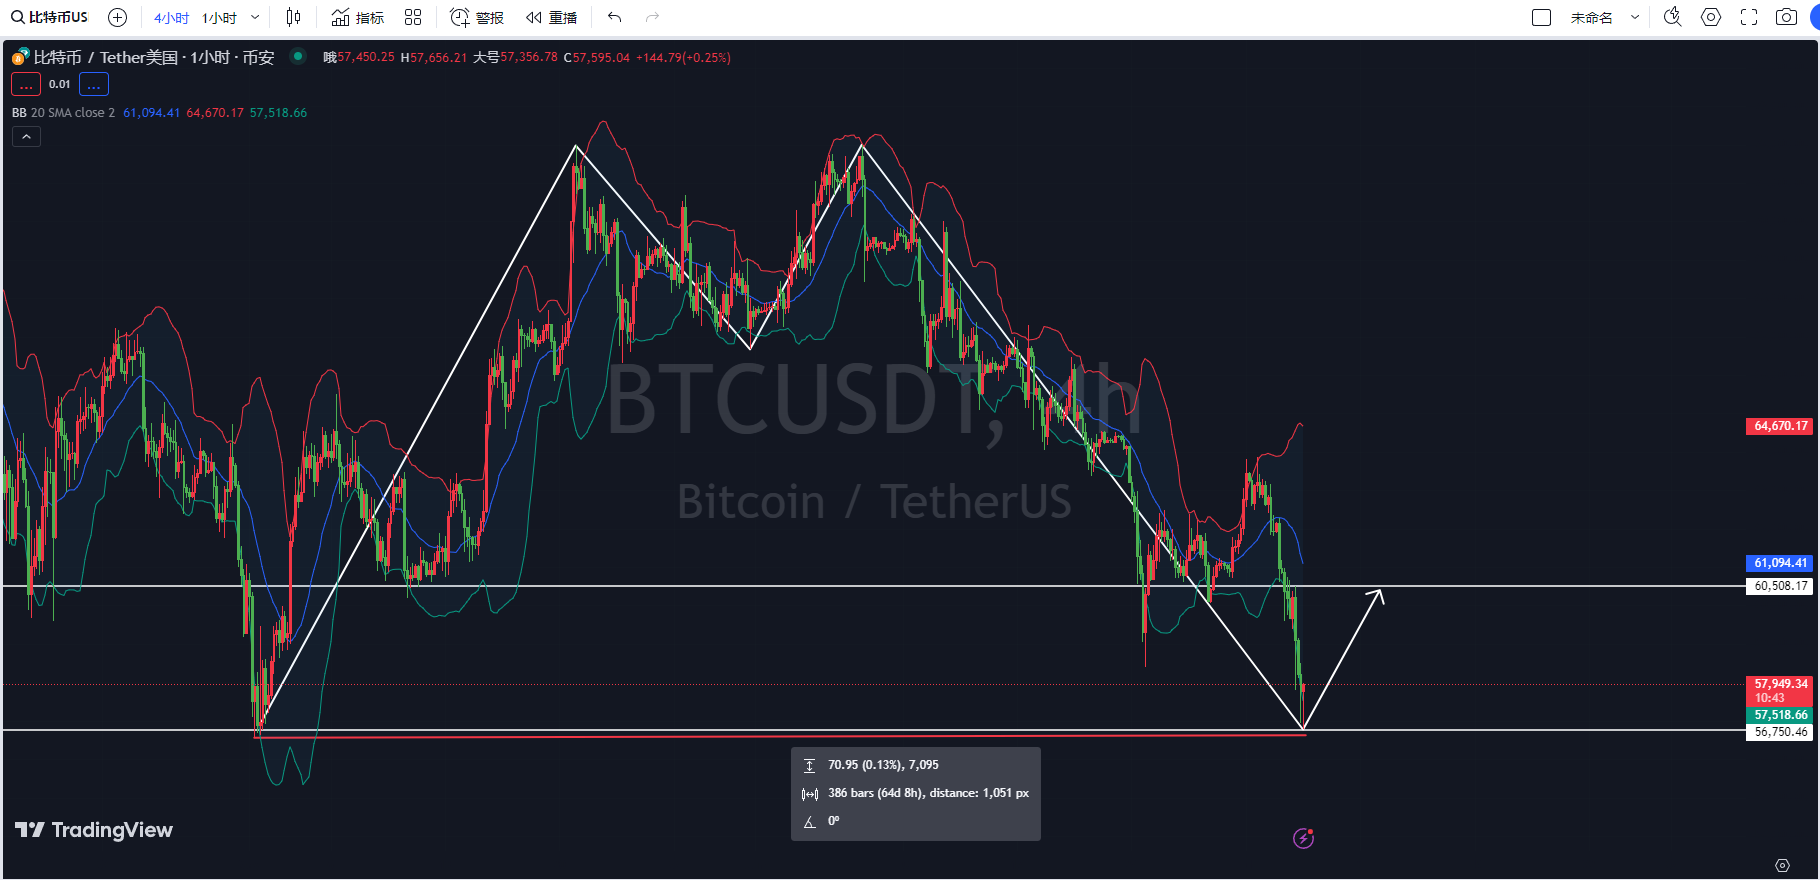
Bitcoin 1-hour chart
Firstly, according to the Bollinger Bands indicator on the 1-hour chart, the current price is running between the middle and lower Bollinger Bands, showing a trend of rebounding towards the middle band, indicating that the lower band has formed support and there are signs of a rebound. However, it still needs to be observed whether it can effectively break through the middle band.
Secondly, based on the KDJ indicator on the 1-hour chart, the current KDJ three-line values are hovering at a low level and have a trend of crossing upwards to form a golden cross, indicating a possibility of a short-term rebound. At the same time, the indicator is in oversold conditions, and buying pressure is gradually increasing.
Finally, according to the MACD indicator on the 1-hour chart, the DIF line is running below the DEA line but shows signs of turning upwards. The MACD green histogram is gradually shortening, indicating a weakening downward momentum and the possibility of a sideways movement or rebound.
In summary: Based on the indicators on the 4-hour chart, Bitcoin may continue to decline until a clear reversal signal appears. There may be a small rebound in the short term, but the overall trend still leans towards a downward movement. Based on the indicators on the 1-hour chart, Bitcoin may also experience a certain rebound in the short term. However, the overall downward trend has not completely reversed. It is necessary to closely monitor the changes in the MACD and KDJ indicators, especially to observe whether the KDJ indicator will continue to rise and whether the green bars in the MACD indicator will continue to shorten, in order to judge the sustainability of the rebound.
In conclusion, the following advice is provided for reference:
Long Bitcoin near $57,300, with a target of $58,645. If the level is broken, look at $69,600. If it cannot be broken, reverse to short. Defend at $56,700.
Instead of giving you a 100% accurate recommendation, it's better to provide you with the correct mindset and trend. After all, teaching someone to fish is better than giving them a fish. The suggestion is to focus on the mindset, grasp the trend, and plan the layout and position of the market. What I can do is to use my practical experience to help everyone make investment decisions and manage operations in the right direction.
Drafting time: (2024-07-04, 22:25)

(By - Da Xian Shuo Bi) Disclaimer: The publication on the internet has a delay, and the above suggestions are for reference only. The author is dedicated to research and analysis in the investment fields of Bitcoin, Ethereum, altcoins, foreign exchange, stocks, and has been involved in the financial market for many years, possessing rich experience in actual trading operations. Investment involves risks, and entry into the market should be cautious. For more real-time market analysis, please follow Da Xian Shuo Bi for discussion and exchange.
免责声明:本文章仅代表作者个人观点,不代表本平台的立场和观点。本文章仅供信息分享,不构成对任何人的任何投资建议。用户与作者之间的任何争议,与本平台无关。如网页中刊载的文章或图片涉及侵权,请提供相关的权利证明和身份证明发送邮件到support@aicoin.com,本平台相关工作人员将会进行核查。


