Daily Sharing
Bitcoin is currently in the first decline on the 1-hour chart within the 4-hour downtrend. The lowest point of this decline has reached 56952, which is deeper than expected. It is very likely to further drop below 56500, and the overall daily chart correction may go further to around 50000. Before the appearance of the 4-hour center, it is difficult for the daily chart expectation to directly reverse. This undoubtedly means that the consolidation period will be extended, and it is likely to end the daily chart correction by early August. If it continues to oscillate at a low level for another month, the subsequent breakthrough may not occur until September.
At this stage, altcoins are undoubtedly the most painful, entering a period of darkness. Only by enduring it can we see the light.
BTC
Due to the rapid changes in the market, this article can only make predictions based on the market changes at the time of publication. Short-term players should pay attention to the latest market changes and use this information as a reference only.
1H
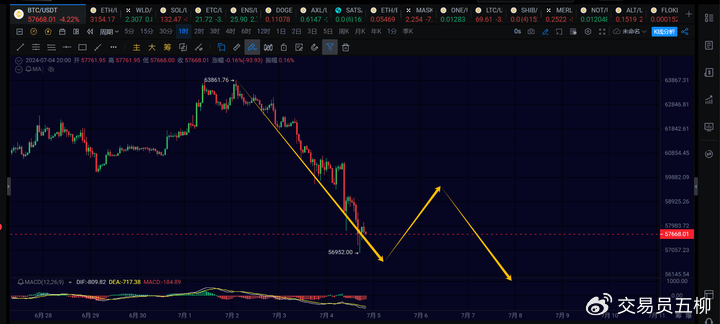
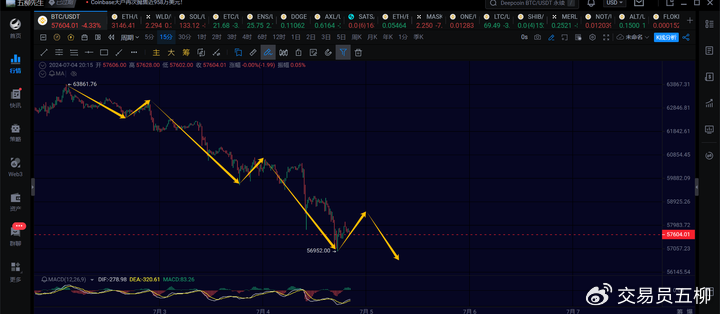
Currently, it is in the first decline on the 1-hour chart within the 4-hour downtrend of the daily chart correction. This decline has already reached 56952, which is only $400 away from 56552, so it is highly probable to break below. The first decline on the 1-hour chart should be close to normal now. It was originally expected to rebound in the afternoon, but it slipped down a bit again in the afternoon.
Here, we can observe again to see if it can stabilize around 56000 and initiate a rebound on the 1-hour chart. The resistance for the 1-hour chart rebound is around 60600. Normally, a 1-hour chart rebound should occur tomorrow. If it successfully rebounds, we can pay attention to around 59000 to 60000. After that, there may be a third decline on the 1-hour chart, which may go to around 55000 or 54400.
It still needs further observation to see if the completion of the 3 declines can end the 4-hour correction. The overall expectation is that the daily chart correction needs to go through a 5-wave 4-hour structure.
15M:
On the 15-minute chart, it seems that the first decline on the 1-hour chart may not have ended yet. In the short term, there may still be a 15-minute rebound and a 15-minute decline before it can end. Therefore, observe the support around 56000 below.
ETH
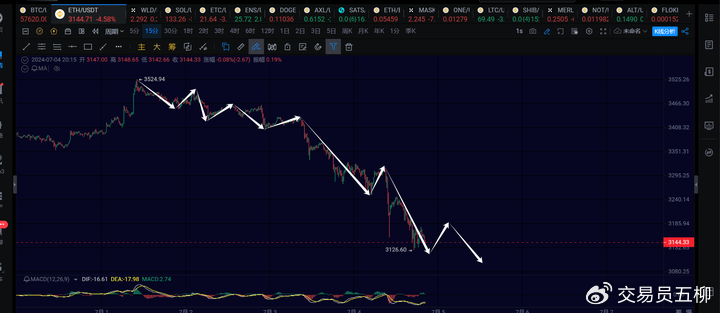
The ongoing 1-hour decline in Ethereum is likely not over yet. It should go through another 15-minute rebound and decline before ending. Pay attention to the support around 3100 to 3050.
Normally, a 1-hour rebound should occur in the afternoon or evening tomorrow, with resistance at 3300. We should see the range of 3250 to 3300. Subsequently, the third 1-hour decline should be around 2950 to 3000.
Trend Direction
Weekly Chart: Upward direction, with the upward target at $180,000.
Daily Chart: Downward direction, currently undergoing a correction from around 72000, with an increased probability of a deep correction.
4-hour Chart: Downward direction, currently in the third 4-hour decline, which has not ended yet.
1-hour Chart: Downward direction, still in the first 1-hour decline, with support at 56000.
15-minute Chart: Downward direction, there should still be a rebound and decline in the short term.
Feel free to follow my public account for further discussion and exchange:

This article is time-sensitive. Please be aware of the risks. The above is only personal advice and is for reference only!
免责声明:本文章仅代表作者个人观点,不代表本平台的立场和观点。本文章仅供信息分享,不构成对任何人的任何投资建议。用户与作者之间的任何争议,与本平台无关。如网页中刊载的文章或图片涉及侵权,请提供相关的权利证明和身份证明发送邮件到support@aicoin.com,本平台相关工作人员将会进行核查。


