Author: 0xWeilan, EMC Labs
The information, opinions, and judgments mentioned in this report regarding markets, projects, currencies, etc. are for reference only and do not constitute any investment advice.
After the COVID-19 crisis, the United States seems to be turning the "story" of using the status of the US dollar as the world's largest reserve currency to harvest other economies through the "dollar tide" into reality. All economies are under pressure, and the exchange rate of the Japanese yen against the US dollar has fallen to its lowest level since 1986.
- On June 5th, Canada cut interest rates, and on June 6th, the euro cut interest rates. Why hasn't the Fed cut interest rates?
- Because only when the yen exchange rate collapses, it hasn't had enough to eat.
Europe can't hold on, Canada can't hold on, only the United States can hold on. The US dollar index continues to rise, putting tremendous pressure on the equity market.
Under the tremendous pressure of macro finance, the cryptocurrency market ended the rebound in May and fell by 7.12% in June, continuing the deep consolidation after BTC set a historical high. This consolidation has lasted for nearly 4 months. There are few sectors in the cryptocurrency market that have shown independent trends.
Although stablecoin inflows on the funding side have recovered to $856 million from May, it remains at a low level. The ETF channel funds amount to $641 million, far below the $1.9 billion of the previous month.
There is a two-tier differentiation in on-chain activities. On the one hand, BTC data continues to deteriorate, while public chains such as Ethereum and Solana remain active. These data lead people to believe that the bull market is still there, and the blood has not yet cooled.
Macro Finance
On June 12th, the US released the CPI for May, which fell by another percentage point to 3.3% from April, lower than the expected value of 3.4%. Thus, the US CPI has fallen for two consecutive months in a high-interest-rate environment. At the same time, the PMI data on the corporate side fell from 49.2% to 48.7%, accelerating the contraction, which also provided support for the decline in CPI.
The downturn in economic data exceeded market expectations, raising expectations of interest rate cuts and causing the Nasdaq to continue to price in the expectation of interest rate cuts. As a result, the Nasdaq rose by 5.69% in June, achieving two consecutive months of gains. Although the S&P 500 index did not reach a new high as strong as the Nasdaq, it also maintained a monthly upward trend.
On June 7th, the newly added non-farm employment data greatly exceeded the forecast value (182,000), reaching 272,000. The market pointed out that there are significant problems in the statistical caliber of this data, suspecting that it may suppress expectations of interest rate cuts.
The market chooses to believe in the direction it is willing to believe in, such as interest rate cuts. There are still funds in the interest rate swap market betting on two interest rate cuts in 2024, while UBS claims that the market underestimates the magnitude of this round of interest rate cuts, even predicting that the "first cut" will still be in September. Against the backdrop of the US dollar index breaking through 106, the Nasdaq continues to set new highs, which is the result of these long funds betting based on their own judgment.
The "hawkish" remarks released by the US government and the Federal Reserve in June may have reached the highest level this year. US Treasury Secretary Yellen stated that she "sees no signs of the US entering a recession," while Fed Governor Bowman emphasized that "there is still upward risk of inflation, and there may be no interest rate cuts until 2024."
Although the CPI has fallen for two consecutive months, the strong employment data allows the Fed to buy more time to maintain high interest rates and wait for the CPI to approach 2%.
The high-interest-rate environment of the US dollar puts tremendous pressure on global capital markets, and the cryptocurrency market is no exception.
EMC Labs believes that with BTC setting a historical high, some investors continue to sell to lock in profits, and the high US dollar interest rates have greatly reduced the inflow of funds into the cryptocurrency market, ultimately leading to selling pressure that cannot be absorbed by sufficient buying power. This is the fundamental reason why the cryptocurrency market is currently unable to effectively break through and even continues to challenge the lower boundary of the adjustment range.
Cryptocurrency Market
In June, BTC opened at $67,473.07 and closed at $62,668.26, a monthly decline of $4,804.15, or 7.12%, with a fluctuation of 20.10%, and the trading volume shrank for three consecutive months.
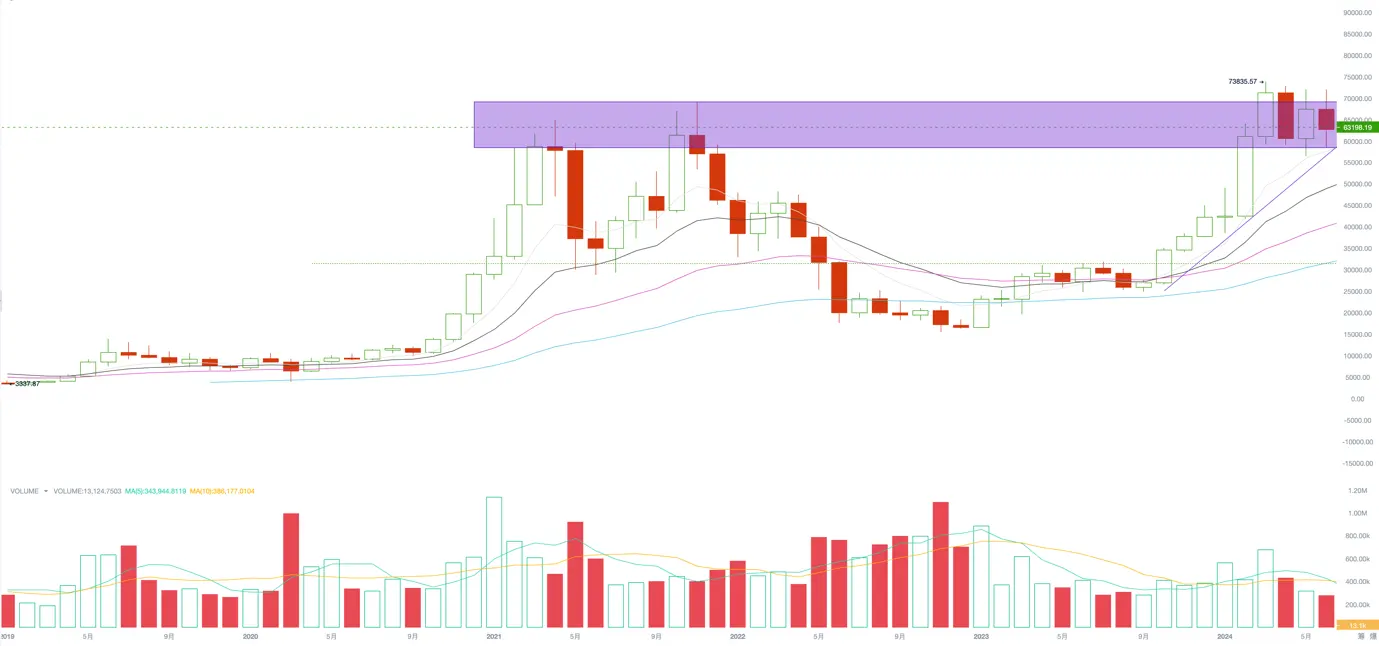
In June, BTC showed a divergence from the Nasdaq, falling by 7.12% for the month while the Nasdaq rose by 5.69%, losing most of the rebound from May.
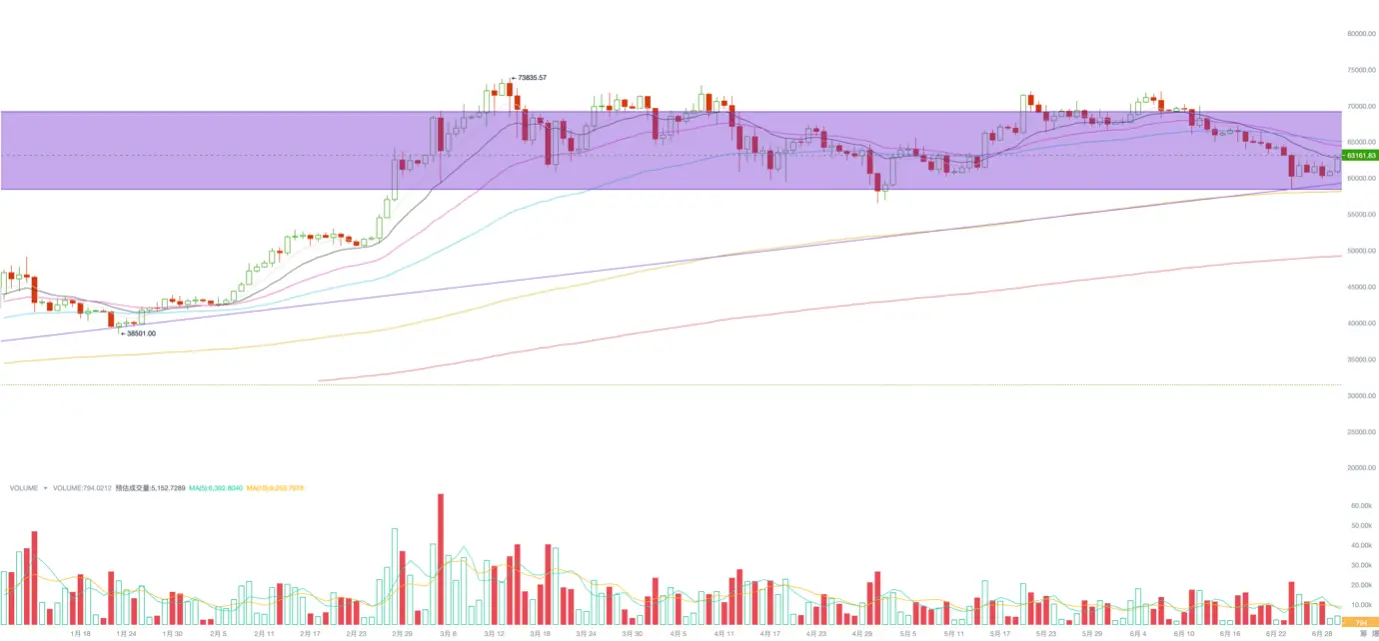
From a technical perspective, influenced by the news of BTC issuance by Mt.GOX exchange and BTC sales by the German government, the price of BTC retraced the uptrend line since October last year and rebounded on June 24th. On the same day, the BTC price also completed a retracement to the lower boundary of the new high consolidation range (i.e., $58,000). The support of these two major technical trend lines is relatively strong, and the BTC price subsequently rebounded above $63,000 in the short term, but it remains uncertain in the medium term.
Influenced by the expectation of the imminent approval of ETFs, the trend of ETH is slightly stronger than that of BTC. This month, the ETH/BTC trading pair has basically preserved the gains from the rebound in May, indicating that industry capital is still betting on the launch of ETH ETFs.
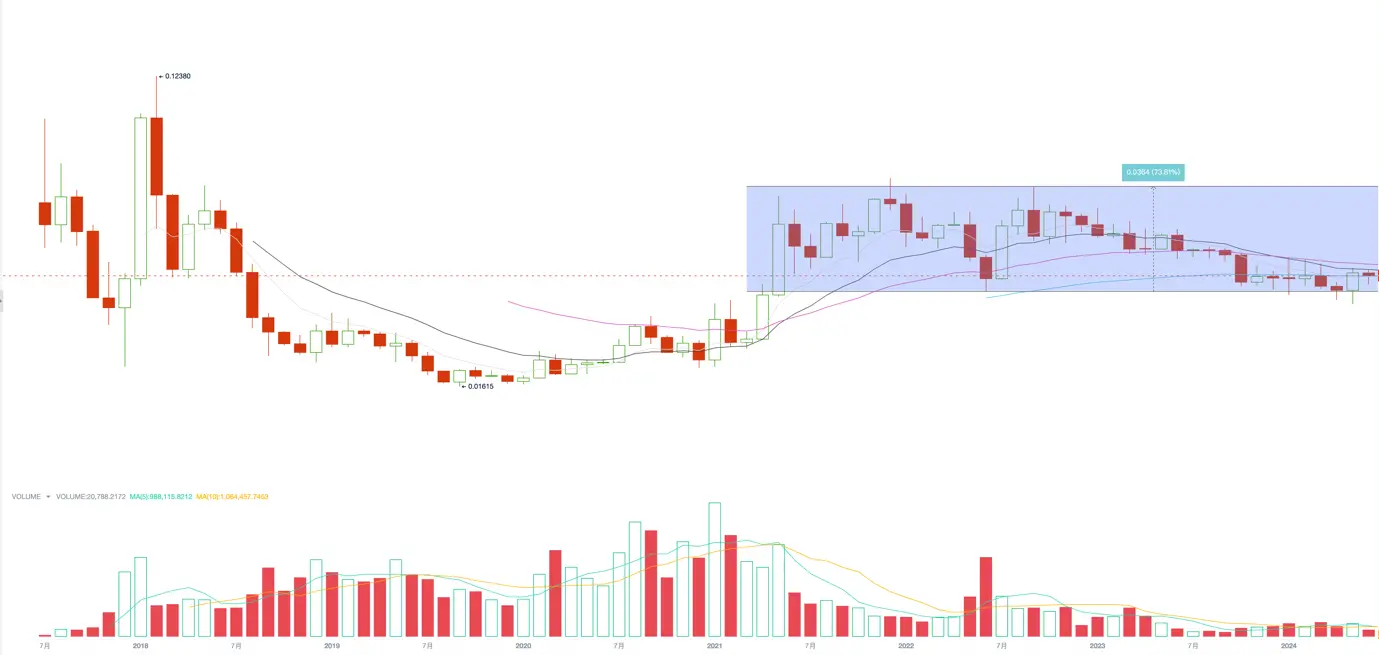
ETH ETF is highly likely to be approved for trading in July. However, in the current context of severe capital shortage, once the positive news is realized, ETH may face significant selling pressure in the short term. After the formal trading, can the ETH ETF bring in a substantial net inflow of funds like the BTC ETF? At present, the outlook is not optimistic.
Capital Flow
A bull market is first and foremost a capital phenomenon.
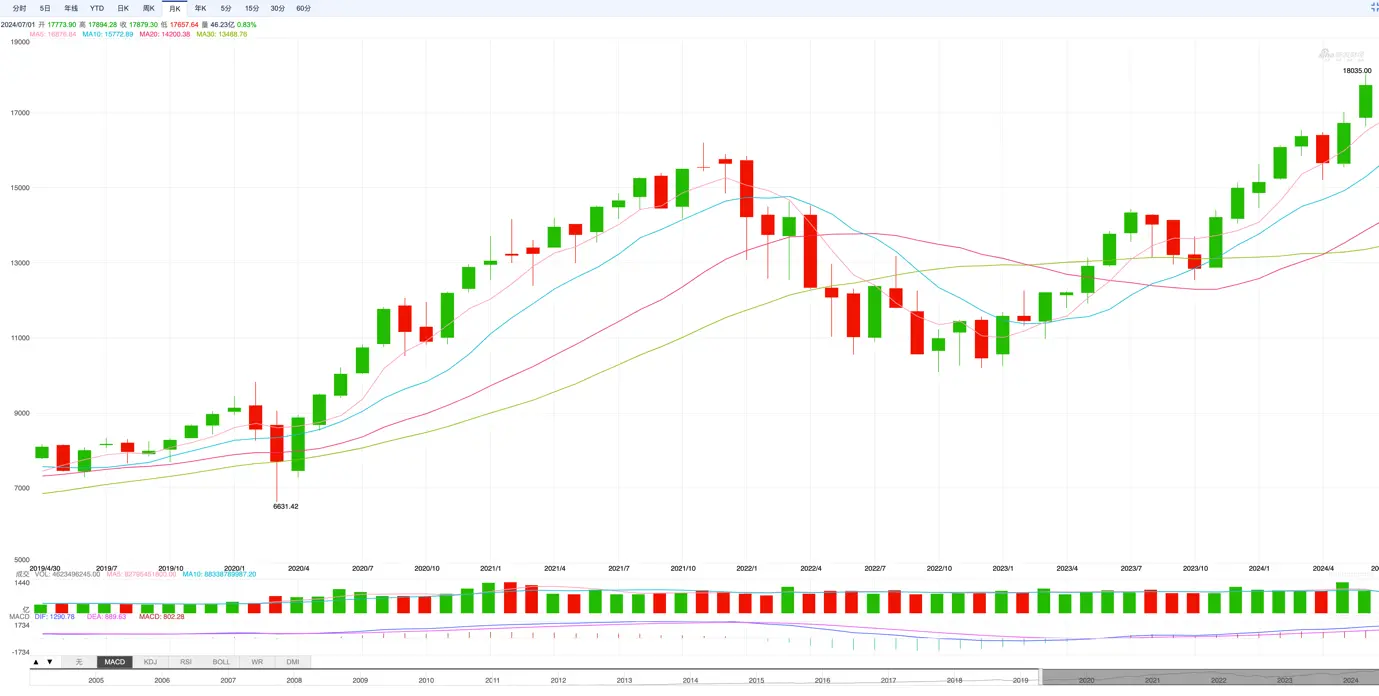
Based on the source of funds, we can divide the trend of BTC since last year into four stages:
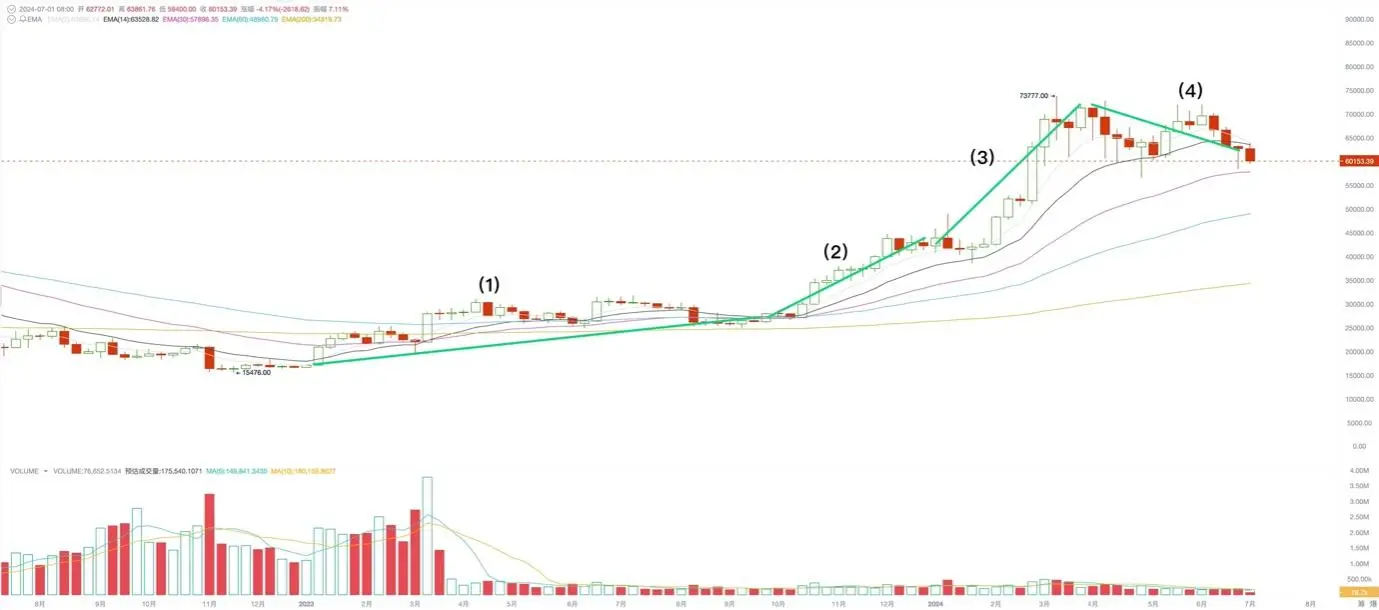
BTC market in 4 stages from January 2023 to June 2024
- January 2023 to September: Stablecoin net outflows, buying power comes from internal funds returning to replenish positions, pushing the BTC price from $16,000 to $32,000.
- October 2023 to January 2024: With the approval of BTC ETF and the anticipation of halving, stablecoin net inflows turned positive, and the price continued to rise, pushing the BTC price from $32,000 to $49,000.
- February 2024 to April: After the approval of BTC ETF, speculative funds withdrew, and fiat funds from the ETF channel and stablecoin channel continued to flow in, pushing BTC to a new high of $73,000. Because the ETF channel funds exceeded expectations, BTC set a new high before the halving. Starting in January, long and short-term profit-taking began to sell off in large volumes to lock in profits, reaching a peak in early March, and then the BTC price peaked and started to pull back on March 18th.
- May to June 2024: After March, the BTC price entered a new high consolidation area. The previous large sell-off led to the complete extinguishment of the market's enthusiasm for long positions. Under the pressure of the high US dollar interest rates, the inflow of funds from the stablecoin and fiat channels rapidly shrank to $341 million and $856 million in May and June. BTC has built a new high consolidation range between $58,000 and $73,000 and is waiting for new funds to enter.
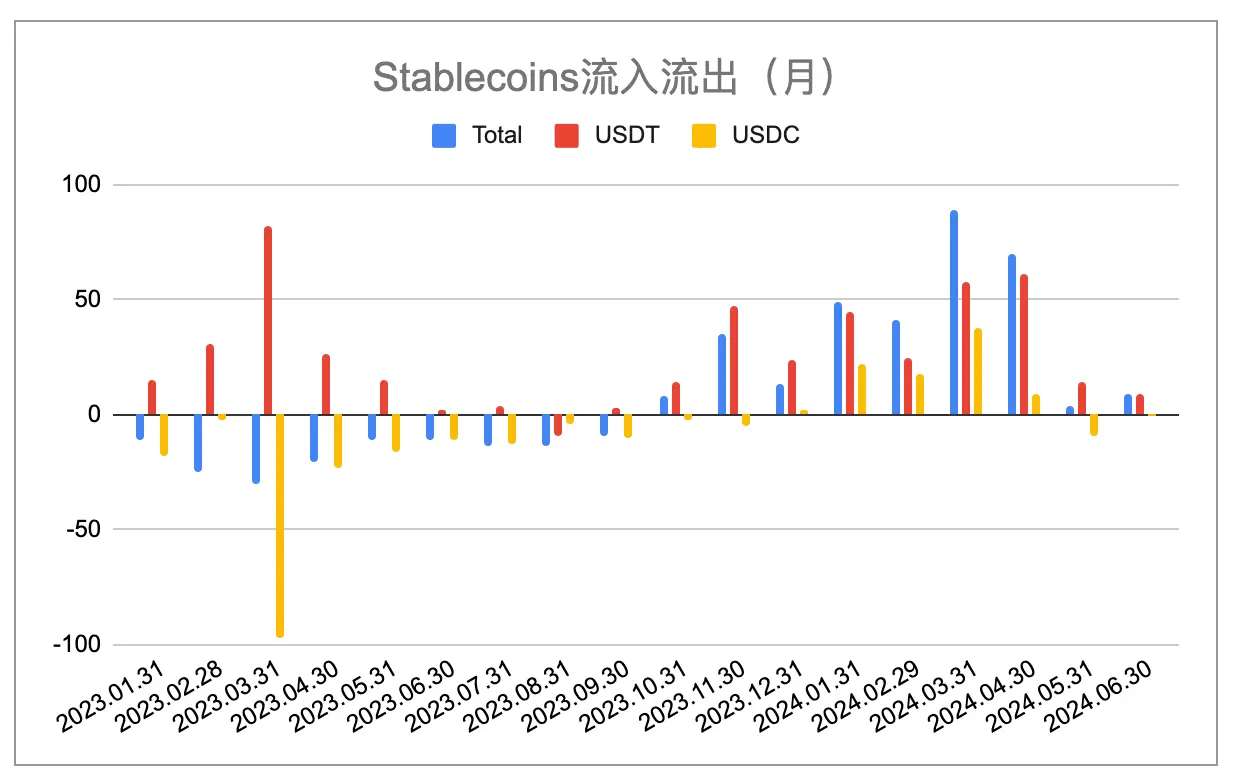
Monthly Changes in Major Stablecoin Supply (EMC Labs Chart)
A bull market is characterized by the influx of new funds in an optimistic environment, revaluing assets and pushing up prices, while long-term holders sell to lock in profits after the price rises. During the development of a bull market, selling often occurs in several stages, and the recent one was just the first wave. The next round of selling will occur at higher prices.
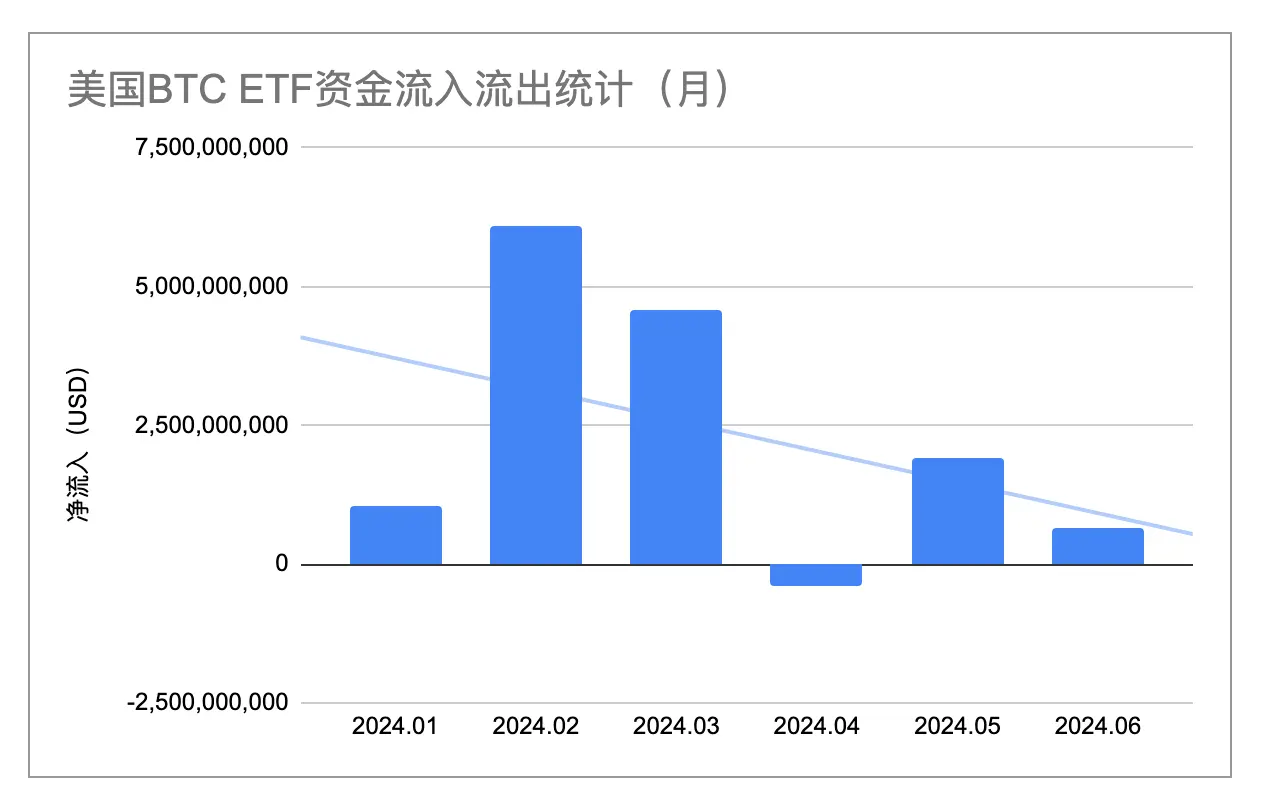
Statistics of 11 BTC ETF Fund Inflows and Outflows in June (EMC Labs Chart)
Since the approval of operation in January, BTC ETF has been seen as an important new channel for inflow of funds into the cryptocurrency market. Since January, a total of $13.882 billion has flowed in through all channels, but the inflow has gradually decreased since March, following the halt of BTC prices at $73,000.
In June, the inflow of funds through the ETF channel was $641 million, which is quite close to the $856 million through the stablecoin channel. In our May report, we proposed that "ETF channel funds are expected to become an independent force for pricing BTC." With the growth in scale and the gradually independent decision-making, this channel of funds is expected to take on this important role. Its scale and behavior are worth continuous attention, but it is currently difficult to bear this responsibility.
Market Supply
In a bull market, long-term investors and short-term investors use different valuation systems for BTC assets. After the price rises, BTC flows from long-term investors to short-term investors, and value also shifts accordingly.
Based on this, two phenomena inevitably occur in a bull market: "fund inflow" and "BTC holder group transfer." These two phenomena interact and shape the market trend together. In the previous section, we analyzed the inflow of funds. In this section, we focus on the changes in the BTC holder group.
Analyzing the holdings of long-term investors, short-term investors, exchanges, and miners since last year, we found that in the first 11 months of 2023, long-term investors increased their holdings, while short-term holders decreased theirs. The turning point occurred in December, when the BTC price approached the previous high. Long-term investors began distributing chips, and short-term holders began increasing their holdings. With BTC reaching a historical high in March, this game of chip exchange reached its peak. Afterward, the price began to collapse, and the scale of long-term investor selling quickly shrank in April. This selling completely ended in May and June, and long-term investors began to increase their chip holdings again.
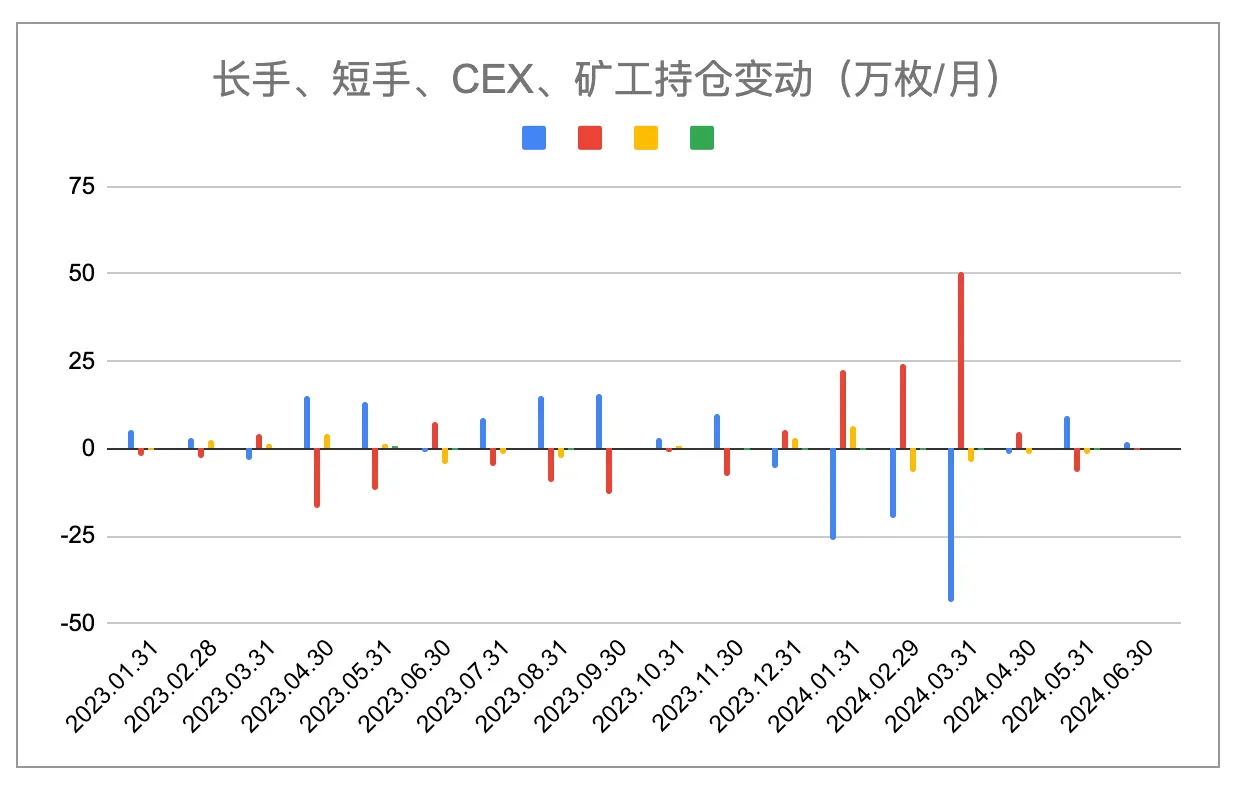
Analysis of Changes in Holdings of Long-term Investors, Short-term Investors, Exchanges, and Miners (EMC Labs Chart)
From March to May, the chip exchange around the previous high price of $69,000 for BTC was one of the main activities in the market cycle, signifying the first phase of the bull market. Chips held by low-frequency traders (long-term investors) flowed into the hands of high-frequency traders (short-term investors), causing a sudden increase in market liquidity. New funds were quickly consumed by selling pressure, leading to a price drop, a cooling of speculation, and a return to a hesitant stage in the market after the frenzy.
Will the bull market come to an abrupt end? We look back at the previous rounds of bull markets.
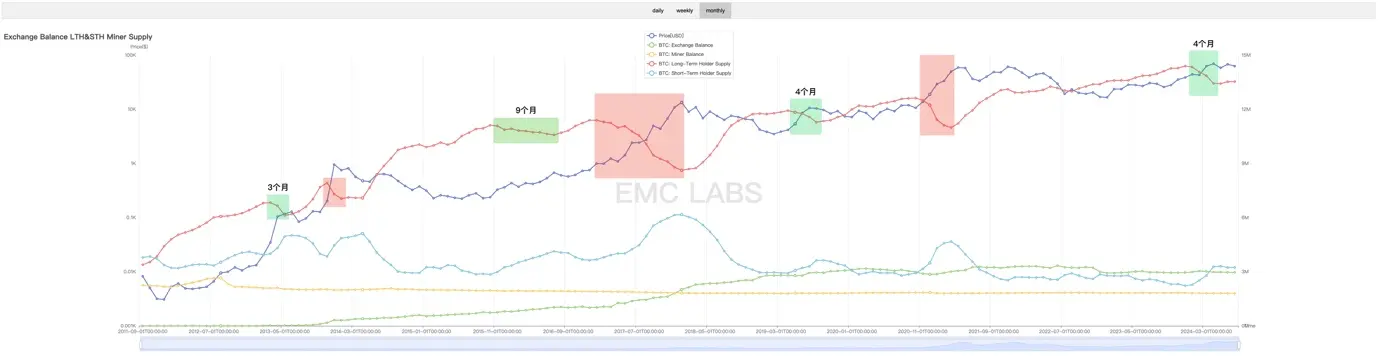
Statistics of Distribution of BTC by Long-term Investors
As indicated by the green boxes in the above chart, in the past three rounds of bull markets, we observed that after the price rise, long-term investors would conduct two large-scale rounds of chip selling to lock in profits. The first round of selling would pause the price increase, and the second round would destroy the market. Historically, the first round of selling lasted for 3 months, 9 months, and 4 months in the previous cycles, and this round from December to March also lasted exactly 4 months, the same as the previous cycle.
According to historical patterns, after the first round of selling, the long-term holder group returns to an accumulation state, waiting for the price to rise. As indicated by the red boxes in the chart, they then return to a state of reducing holdings and mercilessly selling when the price continuously sets new highs. This phased selling to lock in profits aligns with the behavior pattern of long-term investors and the market movement, so we believe that this selling pattern still applies to the current cryptocurrency market.
Based on this, EMC Labs believes that the recent large-scale selling was just the first wave of selling in the bull market. With the reduction of market selling pressure as the long-term investor group returns to an accumulation state, and the return of funds, the market will regain momentum and continue to rise. At that time, the market will enter the second and most lucrative stage of the bull market. The end of the high US dollar interest rate environment is highly likely to occur in the second half of this year. Therefore, although market confidence is currently low and trading is light, we still optimistically believe that BTC is highly likely to start a rally ahead of schedule in the autumn.
Conclusion
Market movement is a process of interaction between internal and external factors.
In the first half of 2024, long-term investors in the market completed the first wave of selling, locking in profits of over a hundred billion dollars, and have now returned to an accumulation state.
After the approval of 11 BTC spot ETFs in the United States, nearly $14 billion flowed into the ETF channel, with 240,000 new BTC holdings and a cumulative holding of 860,000 BTC, totaling $53.1 billion.
Considering that this record was achieved in a high US dollar interest rate environment, such market performance is already very impressive.
The US dollar has not yet started to cut interest rates, and the pressure of funds on global capital markets has reached an unprecedented level.
The first phase of the bull market is ending, and the second phase has not yet begun. We believe that the major changes are highly likely to occur in the autumn.
The biggest risk is the unexpected interest rate hike by the Federal Reserve and the increased selling of US bonds, as well as the issuance of BTC by Mt.Gox and the sale of BTC held by the US government.
Now is the most depressing and painful moment before the storm.
EMC Labs was founded in April 2023 by cryptocurrency investors and data scientists. It focuses on blockchain industry research and investment in the Crypto secondary market, with industry foresight, insights, and data mining as its core competencies. It is committed to participating in the thriving blockchain industry through research and investment, and to promoting the well-being of humanity through blockchain and cryptocurrency.
免责声明:本文章仅代表作者个人观点,不代表本平台的立场和观点。本文章仅供信息分享,不构成对任何人的任何投资建议。用户与作者之间的任何争议,与本平台无关。如网页中刊载的文章或图片涉及侵权,请提供相关的权利证明和身份证明发送邮件到support@aicoin.com,本平台相关工作人员将会进行核查。


