Title: AICoin
Data Analysis:
BTC's network computing power has dropped to a new low since December 2022, indicating that the price may have bottomed out.

① According to CryptoQuant data, the computing power of the Bitcoin network has dropped to a new low level since December 2022, when the FTX explosion event triggered a significant drop in the market to around $15,500, and it continued to oscillate at the bottom for two months.
② The current real Bitcoin computing power has dropped by -7.6%, reaching a new low. Historically, this may indicate that the BTC price may have bottomed out. However, this time it is the high mining cost that has eliminated the miners with low computing power, which is slightly different from the previous situation where the price drop eliminated miners.

③ The Bitcoin Hash Ribbons indicator reflects the current slowdown in BTC network computing power and has also issued a buy signal. (It measures the hash rate of the network by comparing the 60-day moving average of the Bitcoin hash rate with the 30-day average. When the 30-day average is lower than the 60-day average, it indicates a relative decrease in the hash rate.)
④ The decrease in computing power indicates that some miners have shut down and exited. According to historical patterns, after miners with weak computing power are forced to shut down, the market will rebound. This phenomenon has usually occurred in the weeks following the halving, but there is a delay in the current cycle.
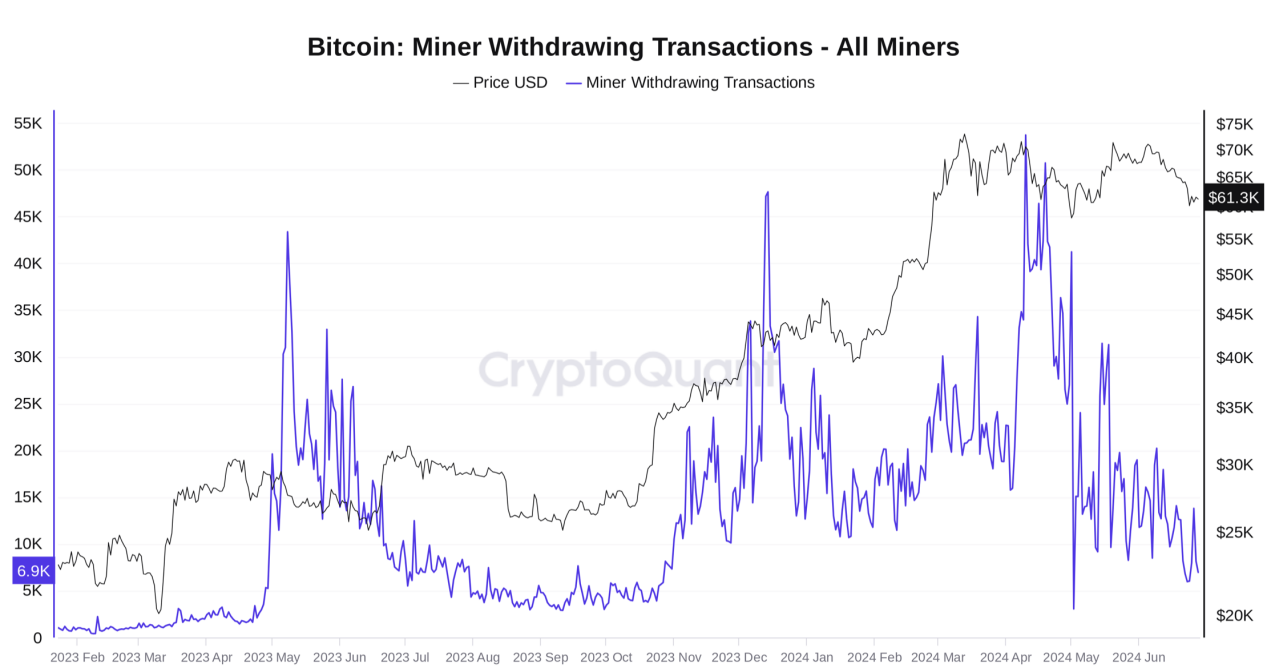
⑤ This chart shows the data of BTC miner withdrawals. The peak value has dropped from over 53,000 times before the halving to about 8,000 times currently, a 90% decrease, further indicating a reduction in selling pressure and the potential for a continued rebound in Bitcoin prices.
⑥ Other indicators, such as the Bitcoin exchange balance we discussed before, the Miner Position Index (MPI), and Bitcoin miner reserves, also show a reduction in selling pressure, supporting the view of a temporary bottom in the market.
Technical Analysis:

① BTC monthly chart: After closing in June, it reported a candlestick with an equally long upper and lower shadow (marked with a yellow circle). However, the body is also of moderate size with equally long upper and lower shadows, indicating intense competition between bulls and bears. The candlestick appears in a declining market, and the cumulative decline is relatively large, usually occurring in the middle to late stages of a major market movement. This requires our close attention.
Combining the mid-sized bearish candlestick in June with the long bullish candlestick in March, the long bearish candlestick in April, and the mid-sized bullish candlestick in May (marked with a blue circle), it indicates an alternating arrangement of bullish and bearish trends at the previous market high. This suggests that the market was in a wide-ranging consolidation phase in the range of $56,500 to $73,780, without a clear trend direction. However, after continuous alternation, a turning point is usually reached, and the probability of continuing the trend of the last candlestick, which is a bearish trend, is relatively high.

② BTC weekly chart: The weekly chart closed with a small-bodied hammer candlestick with a relatively long lower shadow (marked with a yellow circle), indicating strong buying support below. If it appears at the short-term bottom of the market, there is a high probability of a rebound in the first half of this week, which was confirmed by the rise on Monday. However, considering the previous two consecutive mid-sized bearish candlesticks, the rebound height may be limited. The short-term resistance above is around $64,520, and the mid-term resistance is around $67,300.
According to our previous analysis, if the closing price in the future falls below $59,000, there is a high probability of breaking below $56,550, which may form a weekly M-top pattern (drawn with a blue arrow), but for now, there is no need to worry about this as it has not effectively fallen below $59,000.
If the support level in the range of $56,550 to $59,000 stabilizes, the market will likely continue the wide-ranging consolidation phase seen previously.

③ Looking at the BTC daily chart, after breaking through the upper boundary of the previous bottom oscillation range at $62,480 over the weekend, it rose with momentum, testing the 38.2% Fibonacci retracement level of the current decline and then fell back, closing with a long upper shadow inverted hammer bullish candlestick. It is expected that there will be a decline followed by a rise overall in the short term, with the short-term support around the upper boundary platform of the previous oscillation range, approximately $62,000 to $62,400. The MACD currently shows a daily golden cross, which will also enhance market confidence in the rebound. However, considering the underwater golden cross, the strength may be relatively weak, and it is expected to maintain a weak rebound. After encountering resistance at around $64,500 to $67,300, it also aligns with the overall bearish trend on the monthly and weekly charts.

④ BTC four-hour chart: Currently, in the short term, it has tested the upper resistance of the descending channel since $72,000 and is suppressed by the downtrend line since mid-June (white line). It is oscillating at the position marked with a yellow circle. Since the first resistance has been broken, the probability of breaking the second downtrend line has increased. After a power accumulation adjustment, it may break the downtrend and rise. The upper reference resistance is currently around $64,500, based on the Vegas channel.
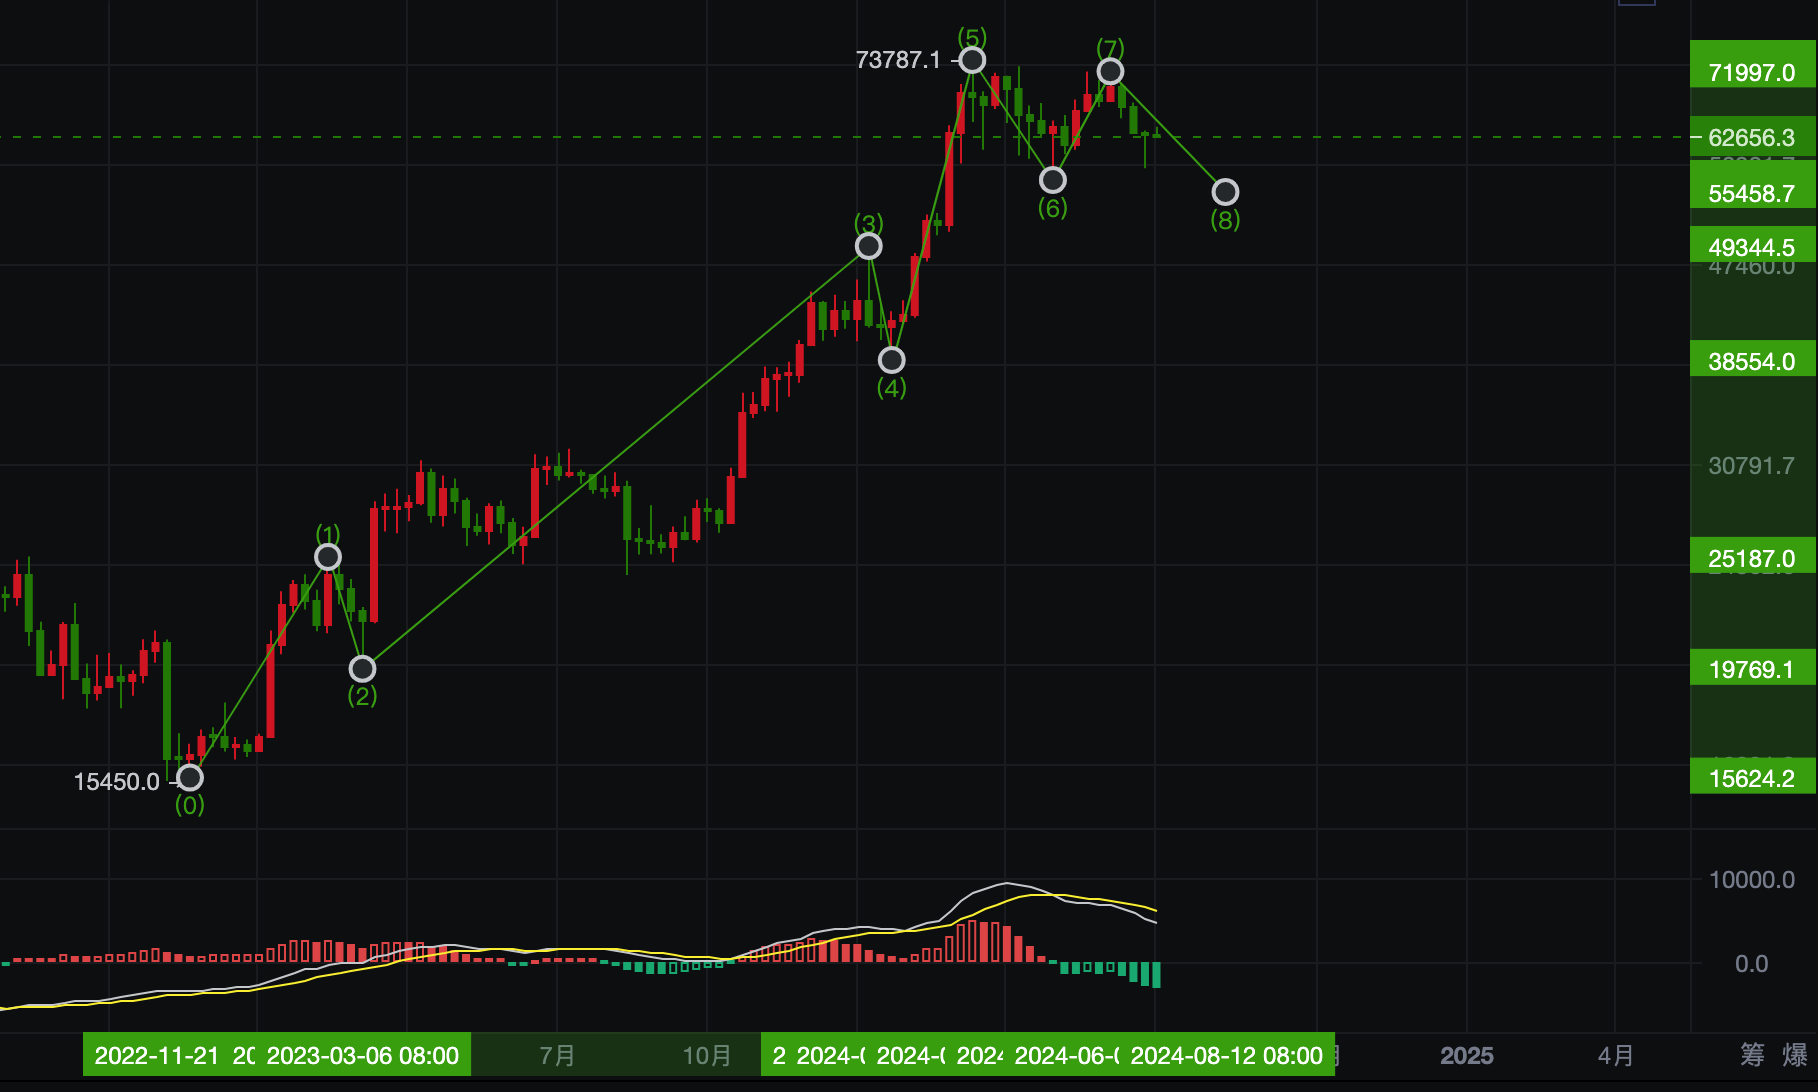
⑤ From the Elliott Wave Theory perspective, assuming that around $73,787 is the peak of the upward 5th wave, the current experience is the 3rd wave of the ABC correction wave, which generally lasts a long time and contains 5 sub-waves. In other words, since the second decline from $72,000, it may continue for a long time in terms of time. The C wave usually occurs after several rounds of ups and downs in the market and is the most intense. Currently, the downward space and time are far from sufficient, so it may not necessarily be the C wave. If the future market breaks through the 61.8% Fibonacci retracement level of the current decline, around $66,620, it does not conform to the C wave wave type and proportion, and it may return to the rebound and upward phase.

⑥ Looking at the four-hour BTC contract volume and price distribution chart, the control point below is around $61,415, which can be considered a support level, and the dense trading prices above are roughly around $66,500, which can be considered a reference resistance level.

⑦ From the STH indicator, which represents the short-term holders of Bitcoin, namely those whose holding period does not exceed 155 days, the cost price is $65,000. Short-term holders are currently facing losses and may potentially close their positions at a loss or break-even, which will increase selling pressure around $65,000. This is also the first time since August last year that the BTC price has fallen below the cost of short-term holders, testing the mentality of this group.
⑧ From a trading logic perspective, in addition to the above analysis, we suggest seeking short positions at rebound resistance levels. There is also the fact that the compensation for the mudslide in Mentougou has not yet been fully realized, and the recent selling by the German and US governments, as well as a significant decrease in net inflows of funds after continuous outflows from ETFs.
Follow us: AICoin
免责声明:本文章仅代表作者个人观点,不代表本平台的立场和观点。本文章仅供信息分享,不构成对任何人的任何投资建议。用户与作者之间的任何争议,与本平台无关。如网页中刊载的文章或图片涉及侵权,请提供相关的权利证明和身份证明发送邮件到support@aicoin.com,本平台相关工作人员将会进行核查。


