Bitcoin fell to a low of $60,055 last Saturday and continued to fluctuate narrowly around $61,000. However, it broke through $62,000 in the early morning of the 1st and continued to rise, reaching a high of around $63,800. At the time of writing, it has fallen to $62,794, with a 3.84% increase in the past 24 hours. On Saturday (the 29th), Daxian placed a long position near $60,700 and successfully took a profit of 1300 points at $62,000.
Although it's only the first day of July, Bitcoin has shown a long-awaited increase. However, whether the trend has reversed still needs time to observe. Next, Daxian has summarized several key focus points that may bring market fluctuations this week.
On Wednesday evening, the Federal Reserve will release the minutes of the June Federal Open Market Committee meeting, which can further analyze officials' attitudes. However, the attitudes of most officials have been noticeably conservative in recent months, so there is not expected to be too much volatility.
On Friday evening, US non-farm payroll data will be released. Economists expect the unemployment rate to remain at 4%, and average hourly earnings are expected to grow by 3.9% from June last year, the smallest annual increase in three years.
Bitcoin 4-hour chart
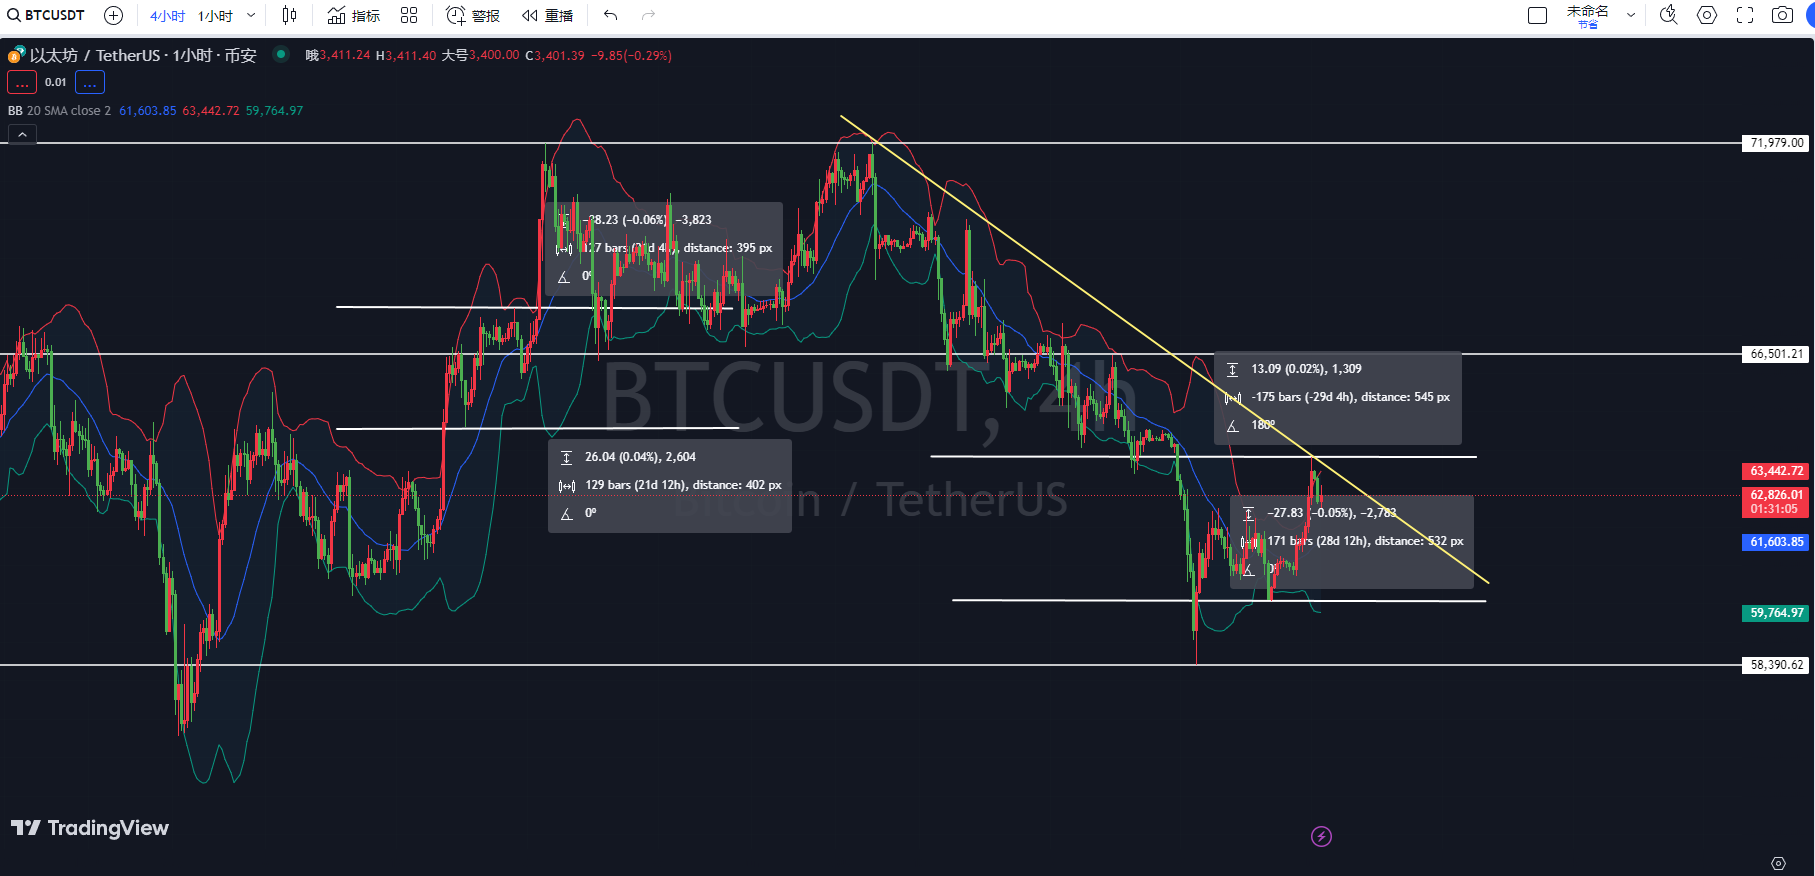
First, according to the Bollinger Bands indicator on the 4-hour chart of Bitcoin, the price is currently fluctuating between the midline and the upper band of the Bollinger Bands. The upper and lower bands of the Bollinger Bands form the resistance and support levels for the price. Currently, the price is close to the midline, indicating that there may be consolidation or a slight pullback in the market in the short term. If the price breaks through the upper band and continues to rise, there may be further upward potential; if it falls below the midline, it may approach the lower band.
Second, according to the KDJ indicator on the 4-hour chart of Bitcoin, both the K line and the D line are above 70, indicating an overbought condition. The J line is currently around 80 but shows signs of starting to decline. This means that the market may be in an overbought state, with potential for short-term pullback pressure.
Finally, according to the MACD indicator on the 4-hour chart of Bitcoin, the DIF line and the DEA line are running above the zero axis, and the DIF line has just crossed the DEA line from top to bottom to form a bearish signal, indicating that the market may experience a pullback. The red histogram of the MACD is gradually shrinking, which also supports the view that there may be a pullback in the short term.
Bitcoin 1-hour chart
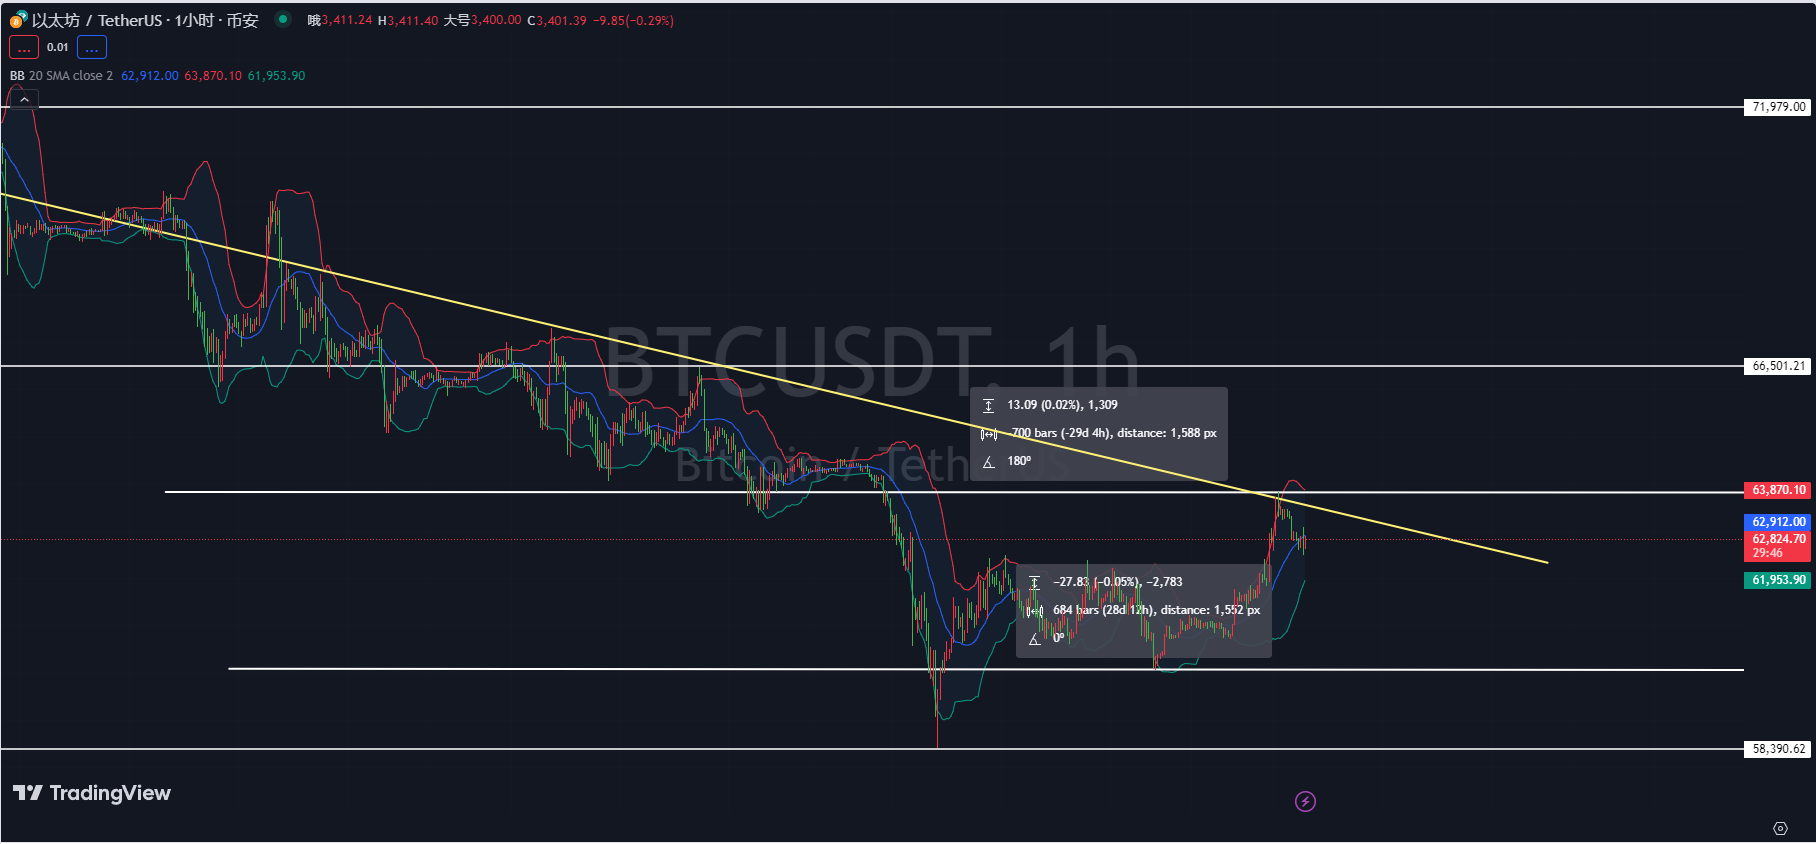
First, according to the Bollinger Bands indicator on the 1-hour chart of Bitcoin, the price has just fallen from the upper band of the Bollinger Bands to near the midline. Currently, the price is fluctuating slightly above the midline, indicating that the market may be in an adjustment phase in the short term. If the price can stay above the midline and rise again, there may be a chance to test the resistance of the upper band; if it falls below the midline, it may further test the support of the lower band.
Second, according to the KDJ indicator on the 1-hour chart of Bitcoin, both the K line and the D line are below 30, indicating that the market is currently in an oversold state, with a chance of rebound. However, it should be noted that the J line has started to rebound, and there are signs of the K line and the D line forming a golden cross, which is a buying signal, indicating that there may be a certain rebound in the short term.
Finally, according to the MACD indicator on the 1-hour chart of Bitcoin, the DIF line and the DEA line are still running above the zero axis, but the DIF line has already crossed the DEA line from top to bottom, forming a bearish signal. In addition, the green histogram of the MACD is gradually increasing, indicating that the downward momentum is still strong.
Comprehensive analysis: The 4-hour chart of Bitcoin currently shows signs of a possible short-term pullback. The price is fluctuating near the midline of the Bollinger Bands, the KDJ indicator shows overbought conditions, and the MACD indicator has formed a dead cross and the histogram is shrinking. These signals collectively indicate that there may be short-term pullback pressure in the market. The 1-hour chart of Bitcoin currently shows that the market may be in a consolidation or a slight rebound phase in the short term. The price is fluctuating near the midline of the Bollinger Bands, the KDJ indicator shows oversold conditions and has a golden cross signal, and the MACD indicator has formed a dead cross, with the green histogram gradually increasing, indicating that there may be a slight rebound followed by a continued decline in the short term.
In conclusion, Daxian provides the following suggestions for reference:
Short Bitcoin around $63,200, with a target of $62,200-61,650 and a defensive position at $63,700.
Instead of giving you a 100% accurate suggestion, it's better to give you the correct mindset and trend. After all, teaching someone to fish is better than giving them a fish. The suggestion is to focus on the mindset, grasp the trend, and plan the layout and position of the market. What I can do is to provide help based on my practical experience, so that your investment decisions and management can go in the right direction.
Drafting time: (2024-07-01, 22:00)

(By Daxian Shuibi) Disclaimer: Online publications have a delay, and the above suggestions are for reference only. The author is committed to research and analysis in the investment fields of Bitcoin, Ethereum, altcoins, foreign exchange, stocks, etc., and has been involved in the financial market for many years, with rich experience in actual trading operations. Investment involves risks, so entry into the market should be cautious. For more real-time market analysis, please follow Daxian Shuibi for discussion and exchange.
免责声明:本文章仅代表作者个人观点,不代表本平台的立场和观点。本文章仅供信息分享,不构成对任何人的任何投资建议。用户与作者之间的任何争议,与本平台无关。如网页中刊载的文章或图片涉及侵权,请提供相关的权利证明和身份证明发送邮件到support@aicoin.com,本平台相关工作人员将会进行核查。


