Daily Sharing
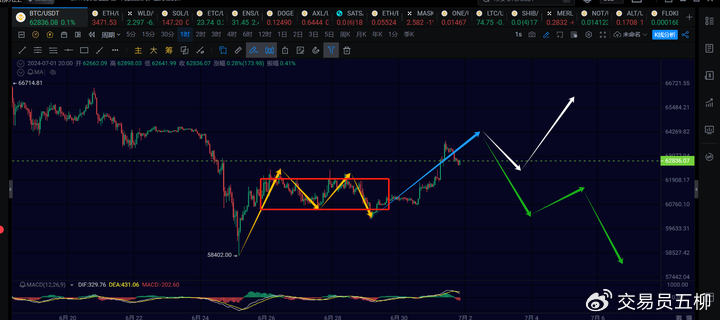
Bitcoin finally broke through 62500 this morning and has reached a high near 63818. The current rebound may not have ended yet, and there is still a chance for a short-term upward movement. We should observe whether it can reach the vicinity of 65000 to 66000.
The current rebound is only the second 4-hour rebound within the daily downtrend. After the rebound, there will be another decline. However, we need to closely monitor the strength of the upward rebound. If the rebound is significant, such as reaching 68000 or 69000, the probability of a subsequent decline breaking below 56552 will be relatively low. If the rebound fails to break through 66000, then it is very likely that the subsequent 4-hour decline will break below 56552.
BTC
Due to the rapid changes in the market, this article can only make predictions based on the market conditions at the time of publication. Short-term players should pay attention to the latest market changes and use this information as a reference only.
1H:
On the 1-hour chart, the current upward movement is leaving the 1-hour center, with the starting point of this 1-hour upward movement near 60060. It has not ended yet and should at least have another 15-minute rebound. We will see if it can reach around 65000. As shown by the blue arrows in the image.
Many people may not be able to distinguish between the 4-hour and 1-hour rebounds. Here's a simple explanation. The rebound from the low point of 58402 on June 25 to the high point of 63818 on July 1, lasting 8 days, is referred to as the 4-hour rebound. When we say the 4-hour rebound has not ended, it means that the current high point of 63818 may not be the final high point of the 4-hour rebound, and there may be even higher high points.
We also emphasize the current 1-hour rebound leaving the center, which refers to the rebound from the low point of 60060 on June 29 to the high point of 63818 on July 1. This is referred to as the 1-hour rebound leaving the center, or a 1-hour upward movement as indicated by the blue arrows in the image.
A 4-hour rebound generally takes at least 5 to 7 days, commonly 7 to 15 days. It can include many 1-hour structures in the middle. At least, it needs to have one 1-hour upward movement, one 1-hour decline, and then another 1-hour upward movement, which means it should include at least three movements: up, down, up. In practice, it can also have 5 movements, 7 movements, or even nine or more movements. It can be understood that a 4-hour upward or downward movement contains several 1-hour structures, and several consecutive 1-hour upward and downward movements can form a 4-hour structure. They belong to the relationship of containment between the current level and the sub-level.
15M:
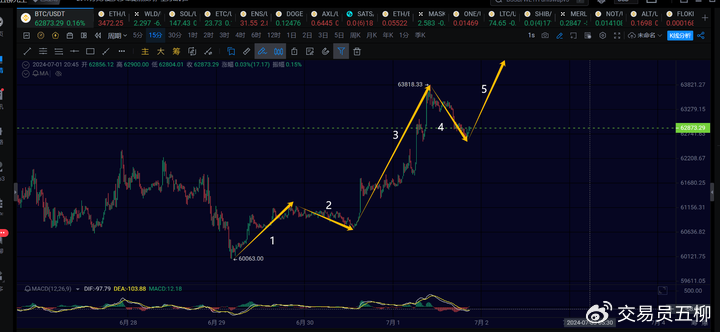
On the 15-minute chart, since the third 15-minute upward movement is not diverging compared to the first movement, there should normally be a fifth 15-minute rebound. Pay close attention to whether the fifth 15-minute rebound can break through 64500.
ETH
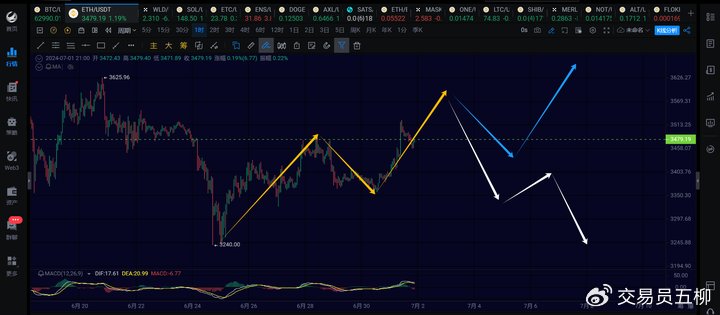
Ethereum is currently in the third 1-hour rebound within the 4-hour rebound, as indicated by the yellow arrows in the image. The second 1-hour retracement returned to around 3350, which basically meets our previous expectations. The third 1-hour rebound should not have ended yet, and we will see if it can further reach 3600. After this 1-hour rebound is completed, we will observe the strength of the next 1-hour retracement. If it falls below 3350 again, it means a new 4-hour retracement is starting, as indicated by the white arrows in the image. If it does not fall below, we will see if it can build a 1-hour center to continue upward, as indicated by the blue arrows in the image.
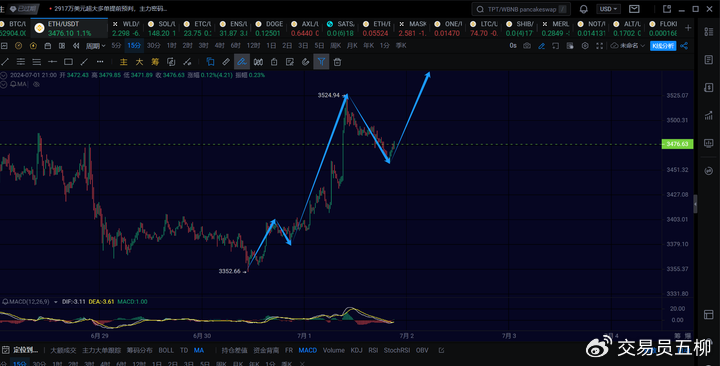
On the 15-minute chart, since the third 15-minute rebound is not diverging, there should normally be a fifth 15-minute rebound to break through 3524 again in the short term. We will continue to observe. The short-term support is around 3440.
Trend Direction
Weekly Chart: Upward direction, with an upward target of $180,000.
Daily Chart: Downward direction, currently undergoing a daily retracement from around 72000, testing the range of 56000 to 59000 again.
4-hour Chart: Upward direction, watching whether the 4-hour rebound can reach 65000 or 66000 again.
1-hour Chart: Upward direction, the 1-hour rebound should not have ended yet, and in the short term, we will see if it can go above 64500.
15-minute Chart: Upward direction, if it can stay above 62500 in the short term, it should be able to reach 64500 again.
Feel free to follow my public account for further discussion and exchange:

The article is time-sensitive, so please be aware of the risks. The above is for personal reference only and should be used as a reference only!
免责声明:本文章仅代表作者个人观点,不代表本平台的立场和观点。本文章仅供信息分享,不构成对任何人的任何投资建议。用户与作者之间的任何争议,与本平台无关。如网页中刊载的文章或图片涉及侵权,请提供相关的权利证明和身份证明发送邮件到support@aicoin.com,本平台相关工作人员将会进行核查。


