After two oscillations and sideways trading over the weekend, BTC successfully broke through the resistance near 62500 points this morning, with a volume increase, and the current price is 62950. The trend basically conforms to the analysis made in the article on Friday.
It is now 7:35 in the morning, and in less than half an hour, as long as the current price is maintained, the daily bottom fractal of the "big cake" will be established. From the daily chart, this is the first truly meaningful bottom fractal structure after a continuous decline from the high point of 72000 points on June 7, lasting more than 20 days. Judging from the rebound strength, it is highly probable that a upward movement will emerge from the daily chart.

Looking at the daily chart first, with the establishment of the bottom fractal, the focus in the future will be on the height of this upward rebound. The 65000 point line will be another resistance point for the bulls to encounter. Combined with the MACD below the zero axis, which is currently pulling back to the zero axis, it is highly probable that a secondary center will be constructed after this upward movement.
From the perspective of the daily chart, the current upward movement should only be regarded as a rebound. The end of this upward movement is an opportunity for medium to long-term reduction of positions. After the probable construction of the secondary center, it will likely continue to seek a bottom and may even challenge the daily three-buy point at 56555.
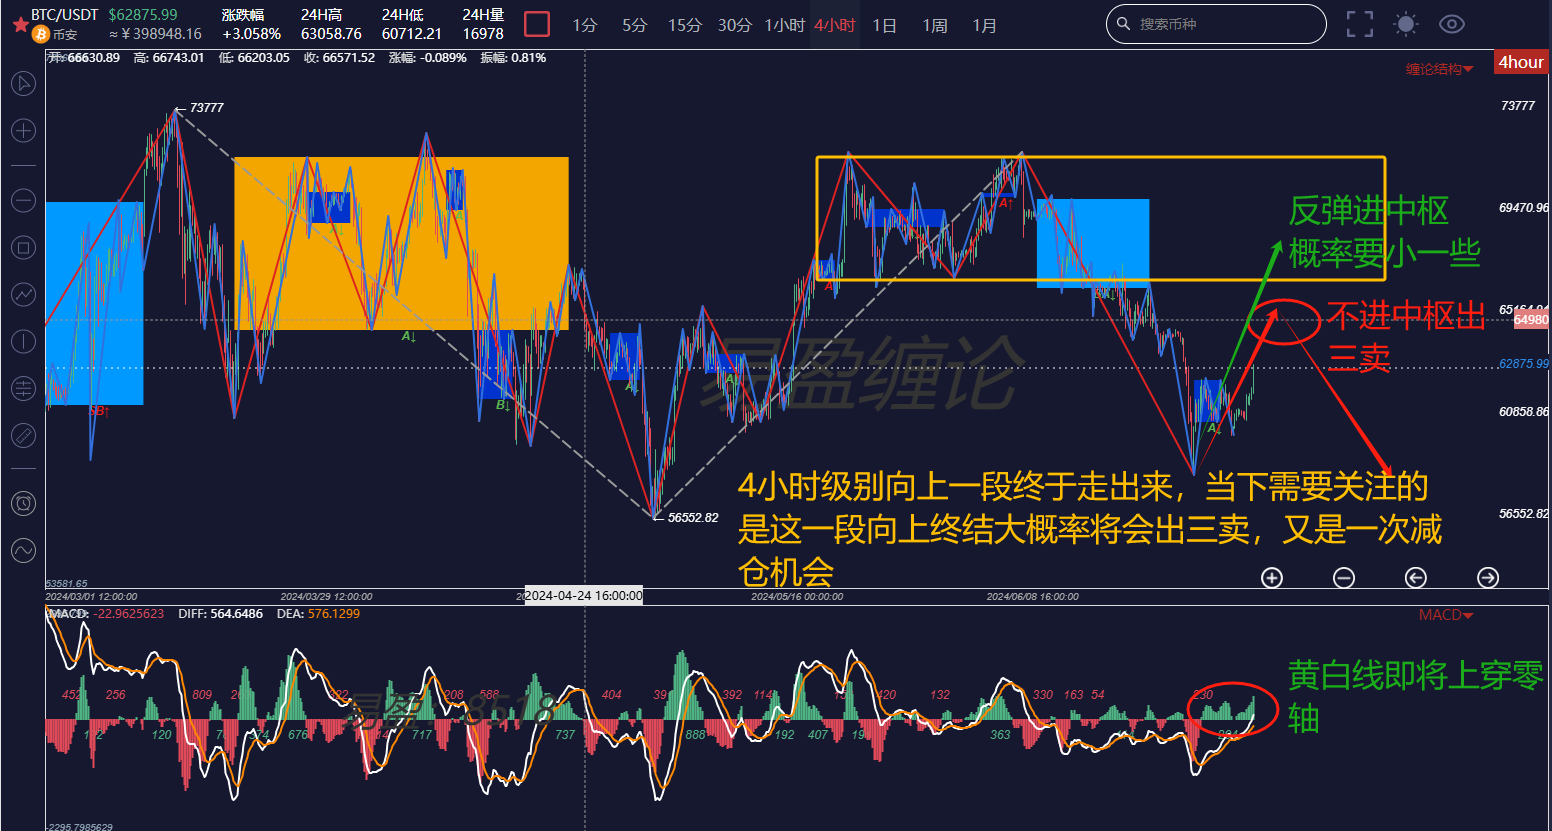
Looking at the 4-hour chart, with the "big cake" price breaking through 62500, the upward movement in the 4-hour chart has finally emerged. There are two possible scenarios as shown in the chart, and this account believes that the red trend is more probable. If the rebound does not enter the center, a three-sell will occur, and after the three-sell, it will once again seek a bottom.

Finally, looking at the 30-minute chart, the current center is moving upward, and from the intensity, the departure from the center is a non-divergent upward movement. In addition, there is no structure inside the departure, so it is highly probable that it is not finished rising. As for the subsequent trend, the chart also provides two possible scenarios with differences in strength. In any case, for short to medium-term positions below the center, the main focus should be on reducing positions when a sell signal appears above the secondary level of the center, and no long positions should be taken without a three-buy signal above the center.
The above analysis is for reference only and does not constitute any investment advice!
If you are interested in the "缠论" and want to obtain free learning materials, watch public live broadcasts, participate in offline "缠论" training camps, improve your trading skills, and build your own trading system to achieve stable profitability, you can scan the code to follow the public account below, private message to obtain and add the WeChat of this account to join the group for learning!

免责声明:本文章仅代表作者个人观点,不代表本平台的立场和观点。本文章仅供信息分享,不构成对任何人的任何投资建议。用户与作者之间的任何争议,与本平台无关。如网页中刊载的文章或图片涉及侵权,请提供相关的权利证明和身份证明发送邮件到support@aicoin.com,本平台相关工作人员将会进行核查。