Recently, all Ethereum market news has been pointing to the progress of the Ethereum spot ETF approval. Although the market believes that the approval process has entered the final stage, yesterday, according to relevant sources, the estimated listing date has been postponed from the original July 2nd to after July 8th.
Informed sources indicated that the SEC has returned the S-1 form to the issuer of the Ethereum spot ETF, with a few minor revisions and comments attached, requiring them to address the issues and resubmit the documents. The issuer has been asked to respond to these comments and submit the updated documents before July 8th. These documents will need to undergo another round of review before the ETF can begin trading. Once this news was released, the price of Ethereum experienced a decline, dropping from a daily high of $3487 to a low near $3365. At the time of writing, the price was quoted at $3391, representing a 1.3% decrease over the past 24 hours.
Ethereum 4-hour chart
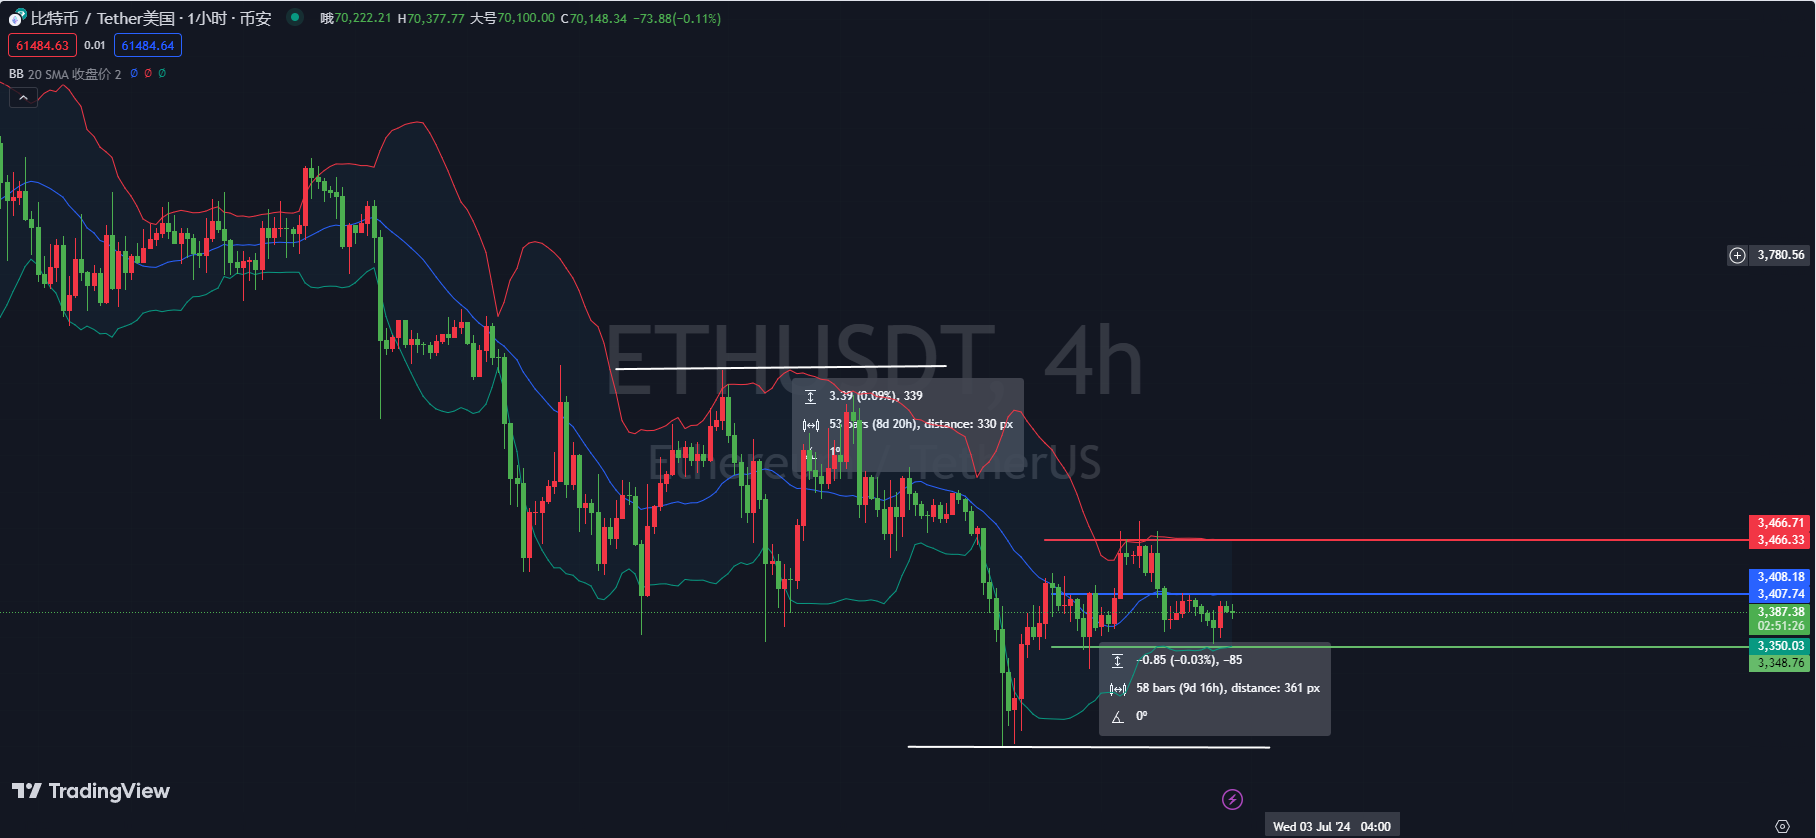
Firstly, according to the Bollinger Bands indicator in the Ethereum 4-hour chart, the current price is fluctuating between the middle band and the lower band, consolidating near the middle band. If the price can effectively break through the middle band and hold, it may move upwards. If it fails to break through the middle band or moves towards the lower band, the market will continue to decline.
Secondly, based on the KDJ indicator in the Ethereum 4-hour chart, the K line and D line are forming a golden cross and the J line is rapidly rising close to the overbought zone, indicating that there is still some upward potential in the short term. However, attention should be paid to whether the J line can continue its upward trend.
Finally, according to the MACD indicator in the Ethereum 4-hour chart, the DIF line and the DEA line are running below the zero axis and the two lines are converging. If the DIF line breaks upward through the DEA line to form a golden cross, there may be a short-term upward trend. However, if it continues to stay below the DEA line, the bearish market will continue.
Ethereum 1-hour chart
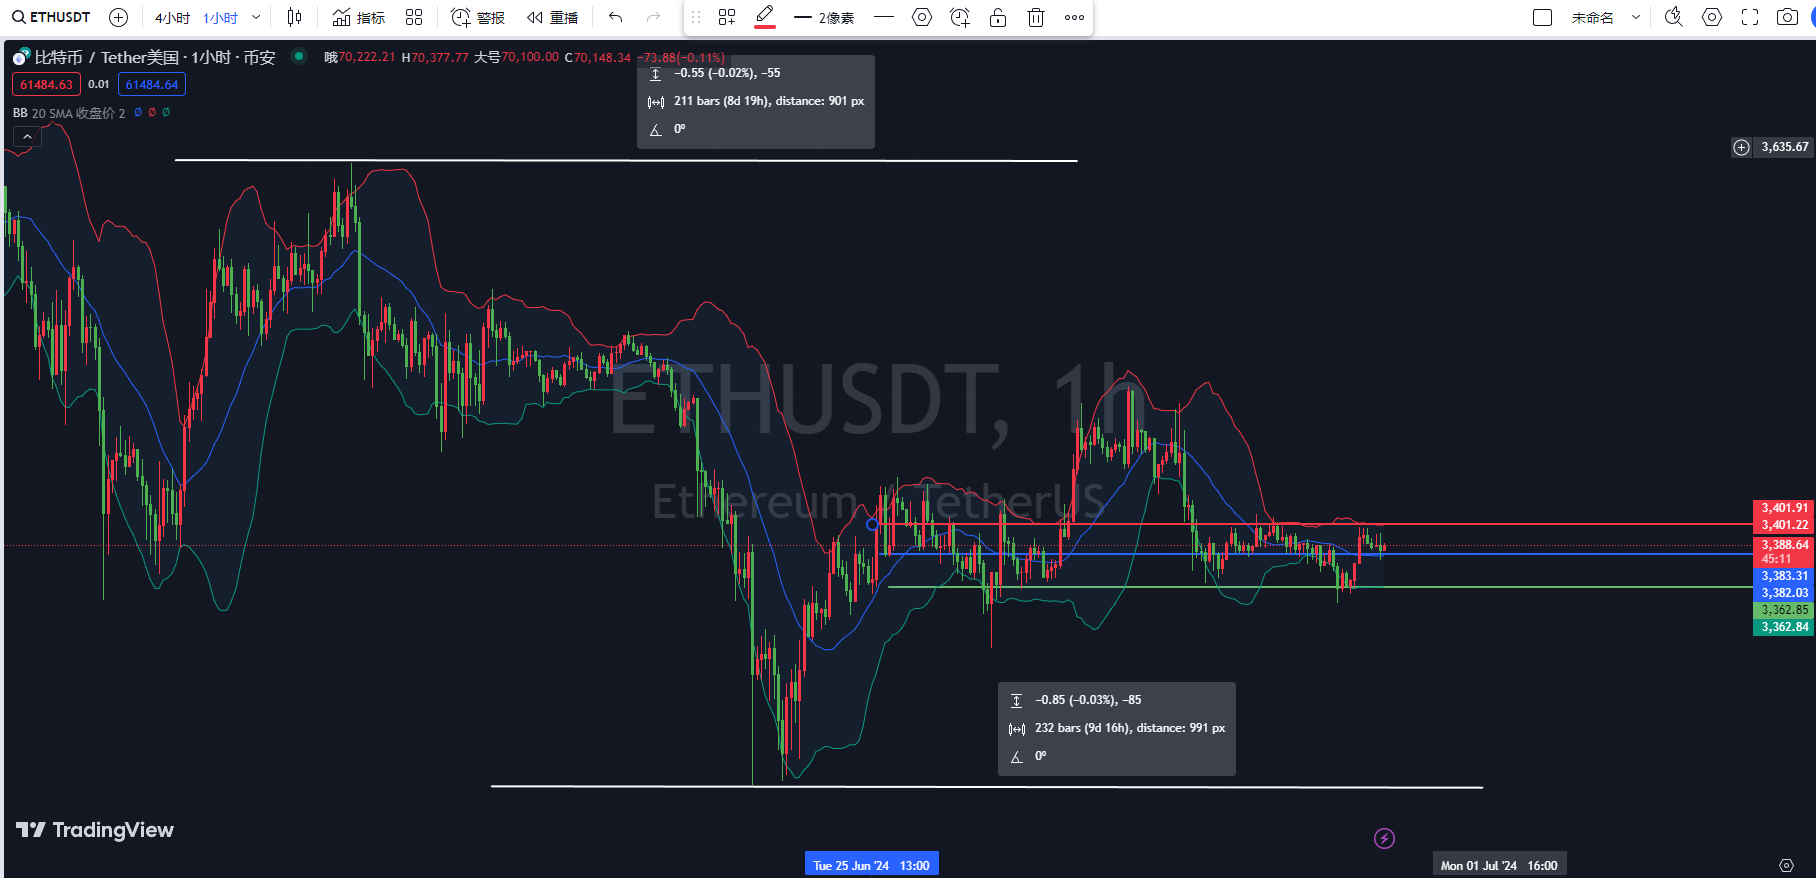
Firstly, according to the Bollinger Bands indicator in the Ethereum 1-hour chart, the current price is running between the middle band and the upper band, showing some upward potential, but facing strong resistance at the upper band. If the price is supported at the middle band, it will continue to test the upper band. If it fails to find effective support at the middle band, it will reverse and trend downwards.
Secondly, based on the KDJ indicator in the Ethereum 1-hour chart, all three KDJ lines are running near 80, in the overbought zone, and both the K line and D line are showing a downward trend, indicating the possibility of a short-term pullback.
Finally, according to the MACD indicator in the Ethereum 1-hour chart, both the DIF line and the DEA line are running near the zero axis, and the red histogram of the MACD is starting to shorten, indicating the weakening of the bullish momentum and the imminent appearance of a bearish reversal signal.
Comprehensive analysis: Based on the Bollinger Bands, the current price is between the middle band and the upper band, showing some upward potential but requiring attention to the support at the middle band. The KDJ indicator shows the risk of a pullback due to overbought conditions, indicating a possible adjustment in the short term. The MACD indicator shows the weakening of the bullish strength and the risk of a bearish reversal.
In conclusion, Da Xian provides the following suggestions for reference:
Short Ethereum rebound to the 3395-3400 level, with a target of 3360-3345 and a defensive position at 3420.
Instead of giving you a 100% accurate suggestion, it's better to provide you with the correct mindset and trend. After all, teaching someone to fish is better than giving them a fish. The suggestion is to focus on the mindset, grasp the trend, and plan the layout and position of the market. What I can do is to use my practical experience to help everyone make investment decisions and manage operations in the right direction.
Drafting time: (2024-06-30, 20:00)

(By Da Xian Shuo Bi) Disclaimer: The publication on the internet has a delay, and the above suggestions are for reference only. The author is dedicated to research and analysis in the investment fields of Bitcoin, Ethereum, altcoins, foreign exchange, stocks, and has been involved in the financial market for many years, possessing rich experience in actual trading operations. Investment involves risks, and entering the market requires caution. For more real-time market analysis, please follow Da Xian Shuo Bi for discussion and exchange.
免责声明:本文章仅代表作者个人观点,不代表本平台的立场和观点。本文章仅供信息分享,不构成对任何人的任何投资建议。用户与作者之间的任何争议,与本平台无关。如网页中刊载的文章或图片涉及侵权,请提供相关的权利证明和身份证明发送邮件到support@aicoin.com,本平台相关工作人员将会进行核查。


