In a depressed market sentiment, June also ushered in the last weekend, and the price of Bitcoin has dropped from around $71,900 at the beginning of the month to around $61,100 currently, with a pullback of nearly 10%.
During this decline, the selling off by miners is considered one of the main reasons for the market downturn. After the latest halving on April 20th, due to the increase in mining operating costs and the fading of the mining boom, mining companies have had to sell Bitcoin to obtain operating funds to purchase new equipment to improve their mining capabilities.
As of June 27th, compared to the first nine days after the Bitcoin halving, the number of withdrawals from miner wallets has dropped from a peak of 53,000 times to 8,000 times, a decrease of nearly 90%. It can be seen that the selling pressure from miners on the market is gradually weakening, and the recent decrease in the amount of currency withdrawn from their Bitcoin wallets indicates that Bitcoin is expected to usher in a new round of upward market trends. If all selling pressure is absorbed, the upward trend will reach a higher level.
Bitcoin 4-hour chart
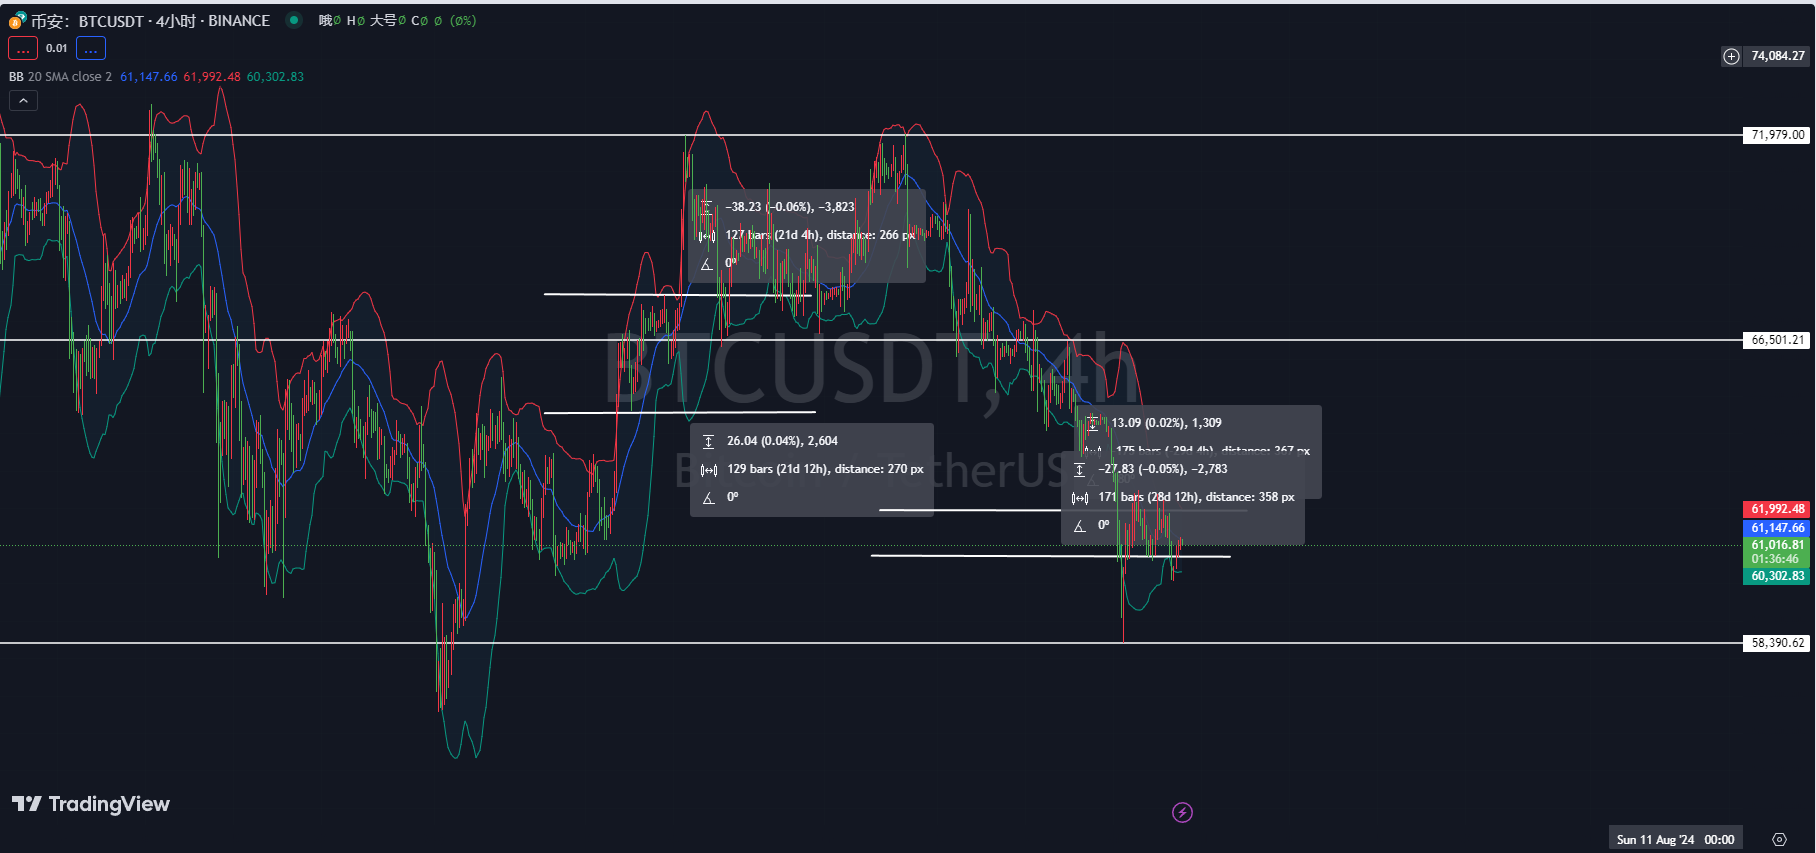
First, according to the Bollinger Bands indicator on the 4-hour chart of Bitcoin, the current price is fluctuating near the middle band of the Bollinger Bands, and the upper and lower bands are expanding outward, indicating an increase in market volatility. If the price effectively breaks through the middle band, it indicates a strong upward trend. If the price falls below the lower band, there is a significant downside risk.
Second, according to the KDJ indicator on the 4-hour chart of Bitcoin, the KDJ three-line value is currently near 50 and is crossing upwards, which is generally seen as a signal of an upward breakthrough, especially when the K line value crosses above the D line value from below. However, there is currently no obvious overbought or oversold condition, indicating a weak market over the weekend that has not yet reacted.
Finally, according to the MACD indicator on the 4-hour chart of Bitcoin, the DIF line is below the DEA line, and both values are attempting to cross upwards, which is generally seen as a rebound signal. If the DIF line breaks upwards through the DEA line to form a golden cross, it further confirms the rebound signal. The red histogram of the MACD is gradually increasing, indicating that the bullish momentum is gaining strength, and a subsequent wave of upward market trends is expected.
Bitcoin 1-hour chart
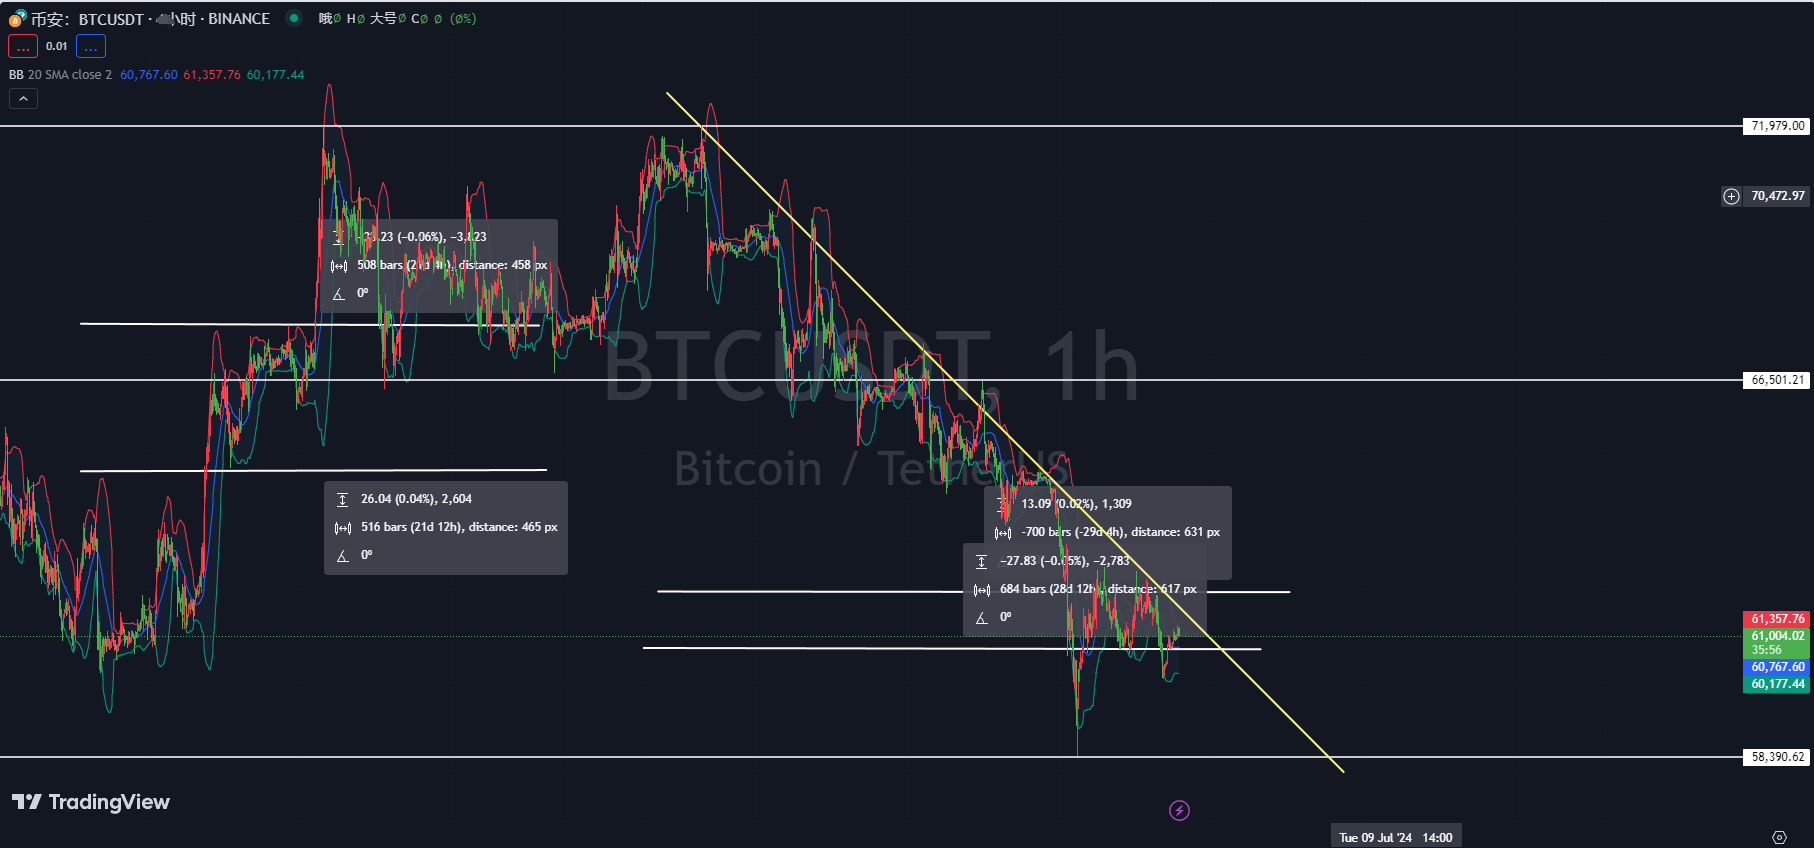
First, according to the Bollinger Bands indicator on the 1-hour chart of Bitcoin, the current price is running above the middle band of the Bollinger Bands, and the bands are expanding outward, indicating significant market volatility. If the price falls below the middle band, there may be downside risk. If it can be supported above the middle band, the current sideways movement or upward trend will be maintained.
Second, according to the KDJ indicator on the 1-hour chart of Bitcoin, the KDJ three-line value is in the overbought zone at a high level, and the K line value and D line value have started to trend downwards, which is generally seen as a signal for short selling, indicating some pressure for a market correction.
Finally, according to the MACD indicator on the 1-hour chart of Bitcoin, the DIF line is running below the DEA line, and both are trending downwards, indicating a downward trend in the market. The red histogram of the MACD is slightly starting to shorten, indicating the possibility of a short-term correction.
Comprehensive analysis: Bitcoin may have a certain rebound trend on the 4-hour chart. Both the MACD and KDJ indicators show potential buying signals, while the fluctuation near the middle band of the Bollinger Bands suggests that the current market is in a consolidation phase. It is necessary to closely monitor the crossover of the DIF line and DEA line, as well as the trend of the KDJ indicator. Additionally, it should be emphasized that if the price can effectively break through the upper middle band of the Bollinger Bands, there may be further upward movement; conversely, if the price falls below the middle band, there may be a risk of a pullback. Bitcoin may face some downward pressure on the 1-hour chart. Both the MACD and KDJ indicators show selling signals, and the support situation of the middle band of the Bollinger Bands needs further observation. If the price falls below the middle band of the Bollinger Bands, there may be further downward movement; if it can be supported above the middle band, there may be a brief rebound.
In conclusion, the following advice is provided for reference by the expert:
Long Bitcoin around 60,700 on the pullback, with a target of 61,800-62,000 and a stop loss at 60,170.
Instead of giving you a 100% accurate recommendation, it's better to provide you with the correct mindset and trend, after all, teaching someone to fish is better than giving them a fish. The suggestion is to focus on the mindset, grasp the trend, and plan the layout and position of the market. What I can do is to use my practical experience to help everyone make investment decisions and manage operations in the right direction.
Drafting time: (2024-06-29, 22:00)

(Written by Master Coin) Disclaimer: The publication on the internet has a delay, and the above suggestions are for reference only. The author is dedicated to research and analysis in the investment fields of Bitcoin, Ethereum, altcoins, foreign exchange, stocks, and has been involved in the financial markets for many years, with rich experience in actual trading operations. Investment involves risks, and caution is needed when entering the market. For more real-time market analysis, please follow Master Coin for discussion and exchange.
免责声明:本文章仅代表作者个人观点,不代表本平台的立场和观点。本文章仅供信息分享,不构成对任何人的任何投资建议。用户与作者之间的任何争议,与本平台无关。如网页中刊载的文章或图片涉及侵权,请提供相关的权利证明和身份证明发送邮件到support@aicoin.com,本平台相关工作人员将会进行核查。


