Daily Sharing
This morning, Bitcoin surged to around 62,000 but failed to break through 62,500 effectively. The short-term market is currently in a small-scale oscillation. It is suggested to observe whether there will be another surge in the short term. Currently, a 1-hour level center is being constructed, and it is expected that after the oscillation, a rebound at the 4-hour level should be completed.
In last Friday's article, it was mentioned that the probability of a 4-hour level rebound after the Bitcoin's surge was increasing, indicating a high probability of a daily level decline. It was suggested that Bitcoin would likely pull back to around 63,000, but it actually extended to around 58,400 this week before showing signs of rebound.
The entire market has experienced a further decline from last Friday's prices, making the current market extremely cold and barren, with no profit-making effect. In this situation, it is believed to be in line with the purpose of the main force's washing out. It is still in the adjustment stage since mid-March, having already adjusted for three and a half months. It still needs some time to continue oscillating and adjusting before the next violent surge.
BTC Medium and Long Term
Weekly:
There are two possible scenarios to consider for the current weekly structure:
First, if Bitcoin's current daily decline does not fall below 56,552:
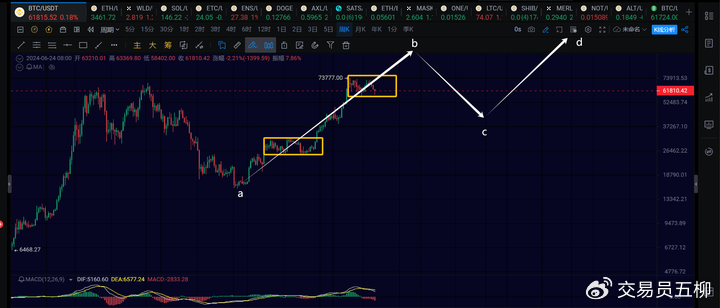
As long as the current daily decline of Bitcoin does not fall below 56,552, it can be considered as a high-level oscillation, constructing the second daily level center. The first daily level center was constructed from April to September last year, when Bitcoin continued to oscillate in the range of 24,900 to 31,000, and now it is constructing the second center. After the center is constructed, there will be a rise in the daily level center leaving phase. The expected target is over 100,000, which means the overall rebound at the weekly level is from point a to point b in the above picture. After the weekly level is completed, there will be a new weekly level decline to point c, followed by a new CD segment of weekly level rise.
If this is the case, the ongoing continuous oscillation and decline from 73,777 is targeted at the rise from 24,900 to 73,777.
Second, if Bitcoin's current daily decline falls below 56,552:
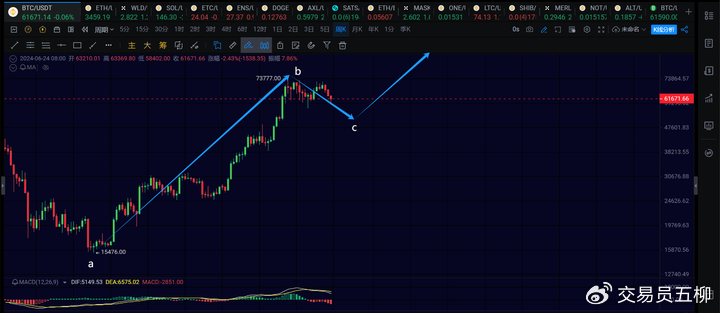
If Bitcoin's current daily decline falls below 56,552, it actually constitutes a weekly level decline. That is, the rise from 15,476 to 73,777 is a weekly level rise, and the decline from 73,777 to point c, the BC segment, is a weekly level decline. After the weekly level decline, a new weekly level rise will begin. In this case, the ongoing continuous oscillation and decline from 73,777 is targeted at the rise from 15,476 to 73,777. The depth and duration of the decline will definitely be extended.
At present, the probability of the first scenario seems to be higher, regardless of whether it is a fork or Ethereum, the water level is relatively low. However, the possibility of the second scenario should also be guarded against.
Daily:
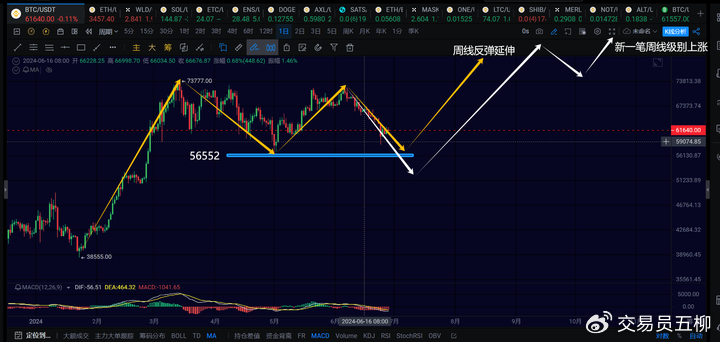
At the daily level, the current situation belongs to the third daily level decline starting from 73,777. The first daily decline was from 73,777 to 56,552, the second was the daily level rebound from 56,552 to 71,997, and the third is the daily decline from 71,997 to the present.
The third daily level decline has not ended yet, with 56,552 being an important observation point. If Bitcoin's current daily decline does not fall below 56,552, then the overall situation is not a weekly level decline, but a continuous oscillation in the range of 57,000 to 72,000, constructing a daily level center. After that, there will be at least one more daily level rise to break through 80,000, continuing the overall rise from 15,476. As shown by the yellow arrows in the above picture.
Of course, if Bitcoin's current daily level decline falls below 56,552, then it structurally constitutes a weekly level decline. After the decline, a new weekly level rise will begin, and 100,000 will be difficult to hold.
If it is a weekly level decline, there are two scenarios to consider:
a) After falling below 56,552, although it is a weekly level decline, the main force does not want a deep decline, just to scare the retail investors, which is a false break below 56,552. For example, it may only drop to around 54,000, and after the retail investors have cut their losses, it will quickly return above 58,000 to complete the washing out.
b) After falling below 56,552, it continues to decline deeply, for example, to the anticipated levels of 50,000, 45,000? The market enters a brief bear market in the bull market, similar to the trend in 2021 around May 19. The fork coins continue to decline deeply.
Personal Comments: From the current perspective, it is in the transition from the early stage of the bull market to the middle stage. It is not believed that the main force will continue to decline deeply to conduct a major market cleansing. The reason is that the market bubble is not significant. Bitcoin has only slightly surpassed the previous bull market high of 69,000 after a year and a half of oscillation, and most of the fork and mainstream coins are quickly returning to the starting point of last October. Ethereum has not yet surpassed the peak of the previous bull market. In this case, the market does not have much bubble to digest, making it difficult to undergo a significant deep decline for washing out. Excessive washing out will only lead to more and more cheap chips, which is not conducive to the subsequent surge.
Therefore, if three results are compared, personally, the probability is more inclined to: not falling below 56,552 to complete the mid-term adjustment in the high-level center oscillation > falling below 56,552 for a shallow weekly decline to scare retail investors > falling below 56,552 for a deep weekly decline.
4H:
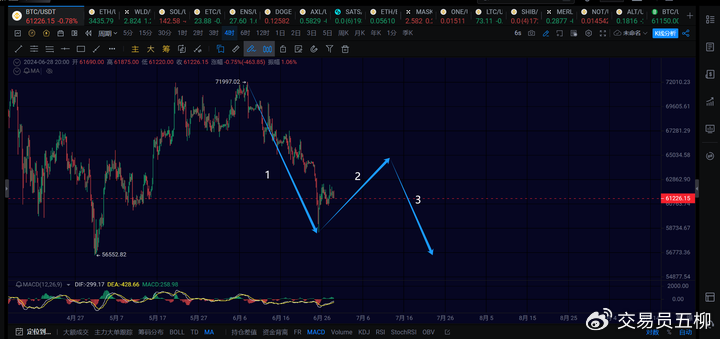
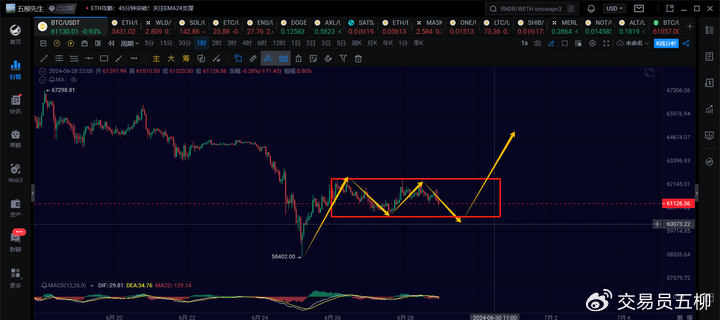
Why is it said that the daily level decline of Bitcoin has not ended? Currently, the daily decline of Bitcoin needs to form at least the three-wave structure at the 4-hour level as shown in the above picture: the first 4-hour decline from 71,997 to 58,402, the second is the 4-hour rebound, and there will be a third 4-hour decline. Therefore, no matter how the daily level decline is viewed, it has not ended. So the current 58,402 is not the bottom, and there should be a low point appearing later.
Regarding the potential 4-hour level rebound, the focus is on the strength of the 4-hour level rebound. If the 4-hour rebound only reaches around 65,000 to 66,000 and cannot go higher, then the probability of the third 4-hour level decline falling below 56,552 will increase, and precautions need to be taken.
If the 4-hour rebound can break through 67,500, then the probability of the third 4-hour level decline not falling below 56,552 will be higher, indicating an overall trend leaning towards the oscillation at the daily level.
Starting from 58,402, it is inclined to run a 4-hour level rebound, which may last until early July, followed by the third 4-hour level decline. As for the final rebound strength, it can only be observed as it progresses.
BTC Short Term
Due to the rapid changes in the market, the article can only make predictions based on the market changes at the time of publication. Short-term players should pay attention to the latest market changes and use the information as a reference only.
1H:
For Bitcoin, it seems to be consolidating a 1-hour level center here. If it stays above 60,000 in the short term, it is inclined to consolidate in the center, and then continue to rise to 64,000 or 65,000. If it falls below 60,000, attention should be paid to whether it will retreat to 58,400 again. Currently, it should be a 1-hour level decline.
15M:
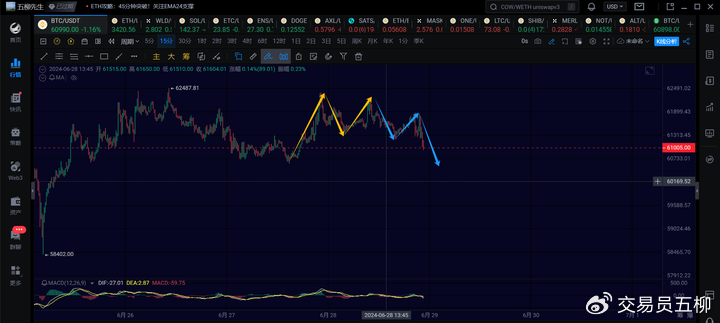
The market has been relatively weak in the past two days. In the short term, it is in the third 15-minute level decline, and attention should be paid to the support near 60,000.
ETH
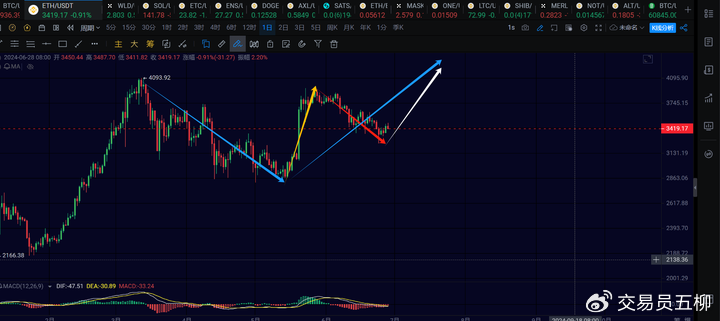
The daily level structure of Ethereum actually started a daily level rise from around 2800, and the internal structure is not complete, as shown in the above picture. The yellow arrow from 2860 to 3977 is just a 4-hour level rebound, not a daily level rise. So structurally, I often think that when the second red arrow's 4-hour level decline is completed, there should normally be a third white arrow's 4-hour level rise for the entire daily structure to be perfect. However, the ongoing red arrow continues to decline, reaching a low of 3240, which makes us doubt whether there will be another white arrow's rise above 3900.
Fortunately, the 4-hour level decline of Ethereum did not fall as deeply as Bitcoin. If 3240 can hold steady, it is not impossible to have another 4-hour level rise to around 4000, as shown by the blue arrow. But this requires Ethereum to regain strength in the next week or so and break through 3730 again. Otherwise, it will be difficult to regain strength if it continues to drag on.
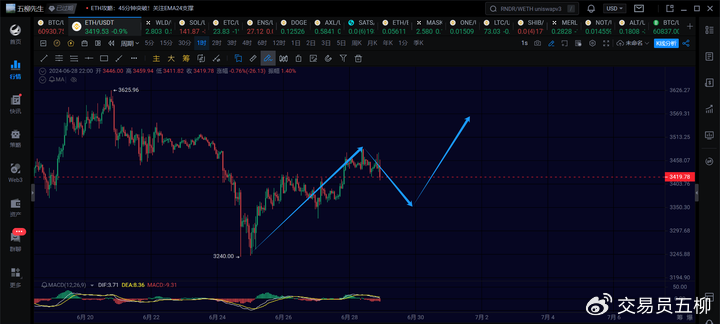
At the 1-hour level, Ethereum is currently running the second 1-hour level decline, with the position of the decline focusing on around 3350 to 3320. If it does not break 3320, there is still hope for a third 1-hour level rebound to above 3500, so patience is needed.
Altcoins
For altcoins to rise, two conditions need to be met. The first condition is that Bitcoin cannot continue to decline and refresh its low point. Bitcoin must at least remain stable, oscillating sideways or rising slightly. The second condition is that Ethereum needs to strengthen for a period of time. Here, strengthening does not just mean falling less, but continuously rising to refresh the high point, with a greater increase than Bitcoin.
Meeting these two conditions gives altcoins hope for a strong surge.
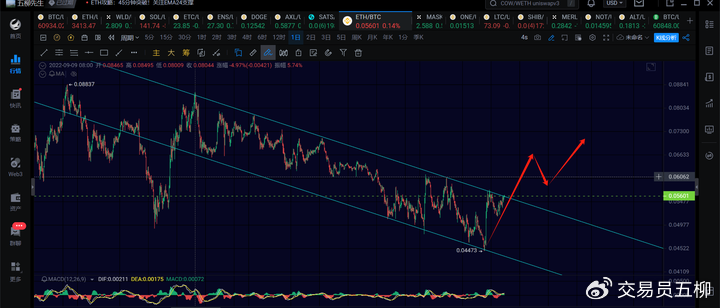
Looking at the Ethereum exchange rate, since September 2022, the exchange rate of Ethereum has been slowly declining in a downward channel. It is currently near the upper edge of the downward channel for the nth time. Can it effectively break through the downward channel in the short term and have a small one-way rise? If the Ethereum exchange rate can have a surge, then Ethereum has a higher probability of surging. The condition for Ethereum to surge naturally is for Bitcoin to stabilize temporarily and not bring it down, giving altcoins the opportunity to erupt. So in early July, we will continue to focus on Ethereum and observe whether Ethereum can rise strongly and drive a period of strength for altcoins.
Trend Direction
Weekly Level: Upward, with the weekly rise target focusing on $180,000
Daily Level: Downward, currently running a daily level decline starting from around 72,000, testing the range of 56,000 to 59,000 again
4-hour Level: Upward, with a high probability of a 4-hour rebound if it stays above 60,000
1-hour Level: Upward, with the short term leaning towards the fourth 1-hour level decline, focusing on 60,500 and 60,000 below
15-minute Level: Downward
Feel free to follow the official account for discussions and exchanges:

The article is practical, be cautious of risks, and the above is only personal advice, for reference only!
免责声明:本文章仅代表作者个人观点,不代表本平台的立场和观点。本文章仅供信息分享,不构成对任何人的任何投资建议。用户与作者之间的任何争议,与本平台无关。如网页中刊载的文章或图片涉及侵权,请提供相关的权利证明和身份证明发送邮件到support@aicoin.com,本平台相关工作人员将会进行核查。


