
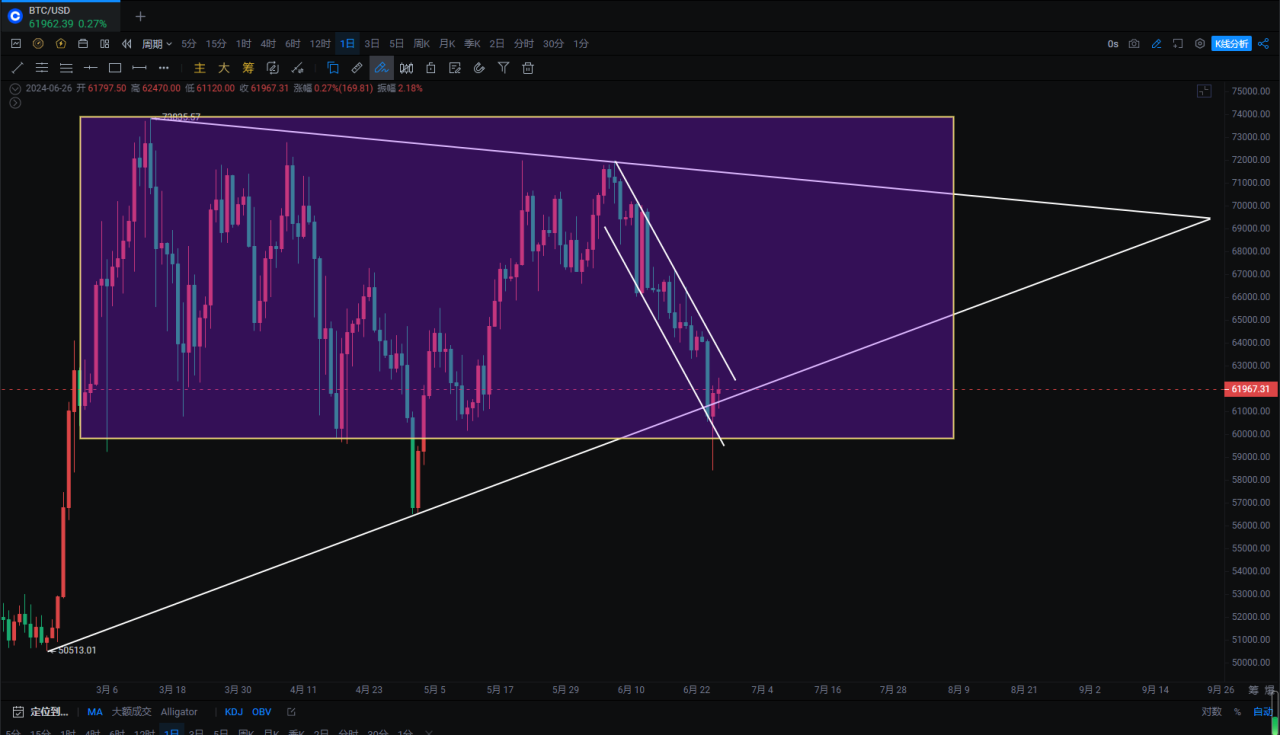
Less than a week before the end of the month, and both the monthly and weekly charts are closing. Bitcoin has been oscillating in the 60,000-74,000 range for 4 months, forming a platform oscillation. Many people think the bull market has ended, but from the current trend and structure, it has not ended. Not to mention the low probability of using the current platform as a top, Bitcoin has not historically formed a platform top for such a long time. It looks more like a platform gathering strength. In 2023, it broke through 31,800 after oscillating for about half a year before finally choosing to break through.
Bitcoin has been oscillating for 4 months. If the trading strategy of this bull market is to advance step by step in a ladder-like manner, then the initial target of 80,000-100,000 for this bull market is only preliminary, and it is possible to go even higher to 120,000-150,000…
Some people also say, what if it turns bearish? Then pay attention to breaking below 56,552 after oscillating for 4 months, failing to recover from the rebound of 60,000, and the probability of turning bearish increases. In the second week, reduce holdings if the rebound does not exceed 65,000, and clear positions if it falls below 56,552. 06/07/24 The European Central Bank cut interest rates for the first time in 5 years, and BTC was rejected multiple times at 72,000. Things to watch out for in the short term!
06/11/24 JPMorgan shorts gold futures worth trillions of dollars, the US dollar index continues to play tricks, how will the crypto market respond?
06/12/24 Potential M-top at the weekly level, reduce holdings on spot at high levels, beware of a sharp drop similar to the 5/19 market!
06/13/24 BTC staged a long and short battle, CRV may have a risk of a thunderstorm, the downtrend has not changed
06/14/24 Rejected under strong pressure, daily chart shows double negative with a positive, a sharp drop is imminent!

Bitcoin
The daily chart returns to the bottom of the box and the inside of the triangle structure. The pressure is relatively high for a rebound to 63,600-65,460. This rebound is different from the rapid pullback from 56,552. This rebound can only be seen as a short-term rebound for now. It is still bearish if the rebound does not exceed 65,000. The monthly high point touches the upper BOLL and falls back under pressure, RSI, KDJ, and OBV indicators all turn downwards, the weekly MACD continues to decline, waiting for a pullback on the weekly chart.
The daily chart is still looking for rebound strength at the bottom of the box, while waiting for a second probe opportunity. If the second probe can be recovered, it is another entry point. The general direction is still bearish, it depends on the strength of this rebound. After breaking through the downtrend channel on the 4-hour chart, continue to look for a rebound in the short term.
Support:
Resistance:
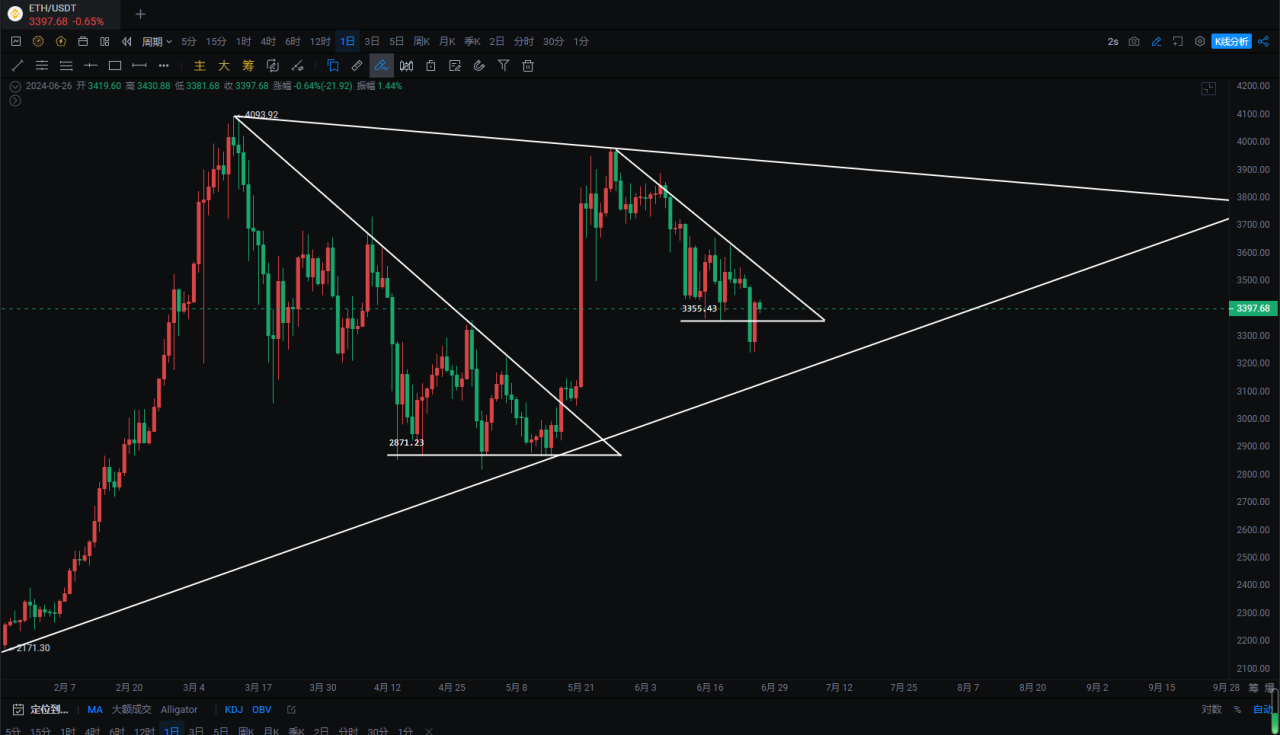
Ethereum
The daily chart fell below the bottom and returned, if it can support around 3,355 again, there is a high probability of breaking through the daily triangle upwards. Many people are betting on the chance of the ETH spot ETF passing on July 4th. The daily chart is still below the BOLL, as long as it continues to oscillate above 3,000-3,100, there is still a chance of a rebound. Let's see the specific situation on July 4th.
Support:
Resistance:
If you like my views, please like, comment, and share. Let's go through the bull and bear markets together!!!
The article is time-sensitive and is for reference only, updated in real time.
Focus on candlestick technical research, win-win global investment opportunities. Official account: Trading Master Fusu

免责声明:本文章仅代表作者个人观点,不代表本平台的立场和观点。本文章仅供信息分享,不构成对任何人的任何投资建议。用户与作者之间的任何争议,与本平台无关。如网页中刊载的文章或图片涉及侵权,请提供相关的权利证明和身份证明发送邮件到support@aicoin.com,本平台相关工作人员将会进行核查。


