Recently, Bitcoin has been continuously falling, reaching a low of $58,300 in the early morning today, the lowest point in nearly two months. As of the time of writing, the price is around $61,166, with a 4.16% decrease in the past 24 hours. The total amount of liquidation across the network has exceeded $363 million, with nearly 90,000 people being liquidated.
Bitcoin 4-hour chart
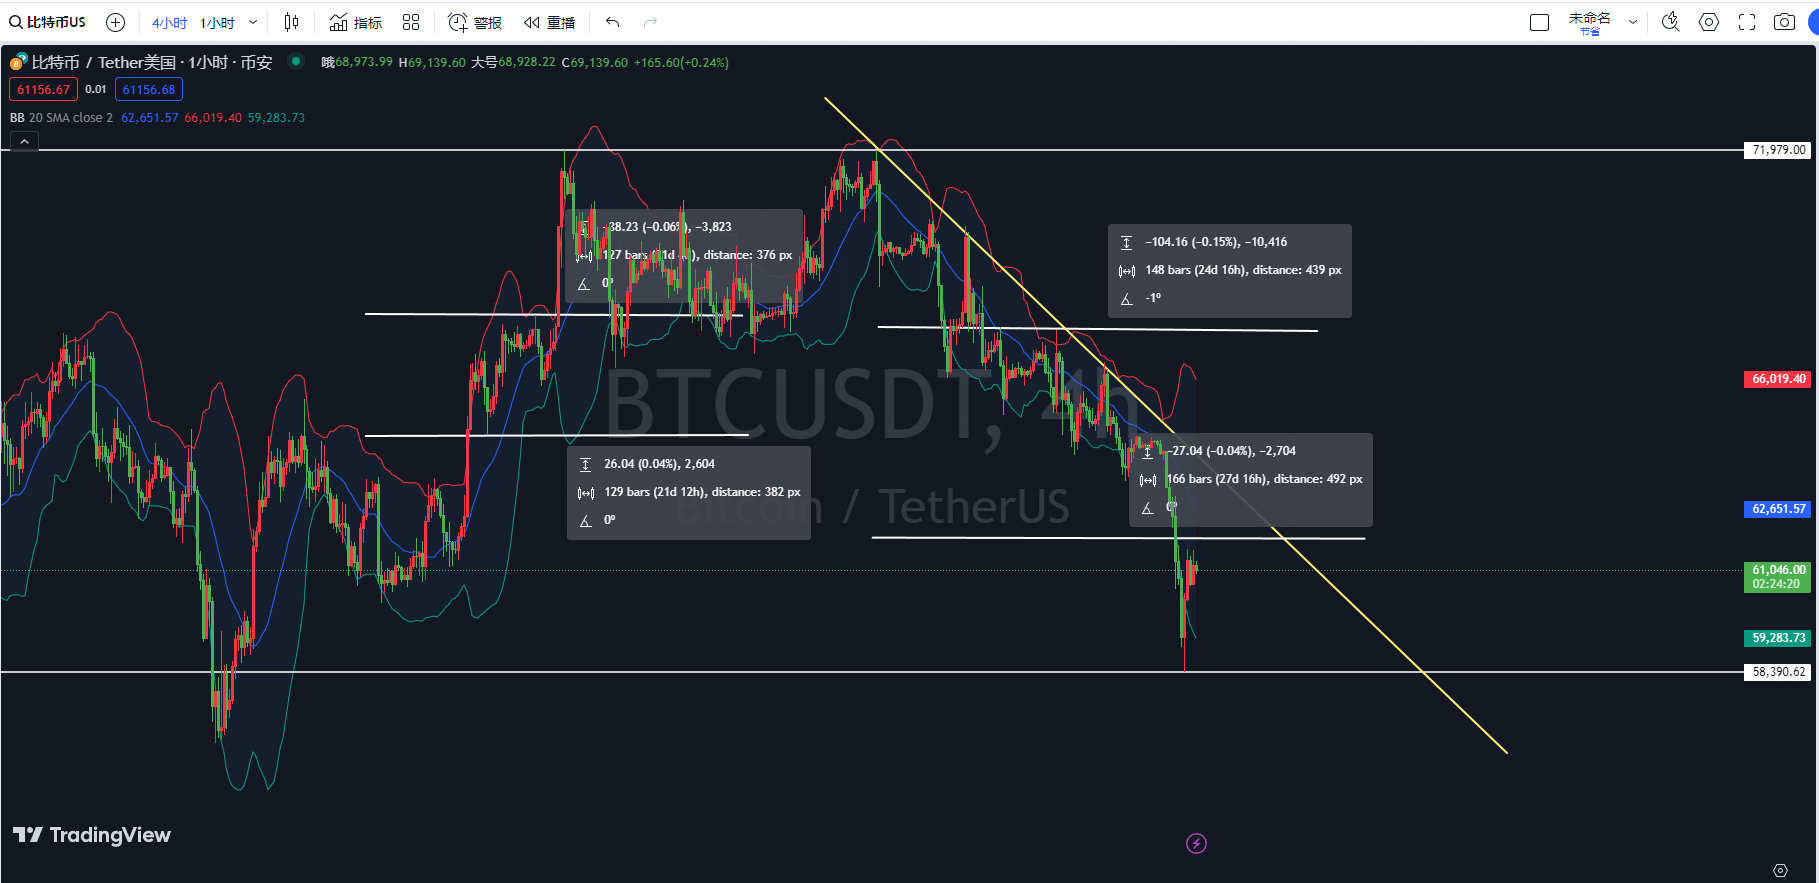
According to the Bollinger Bands indicator on the current 4-hour chart of Bitcoin, the price is running near the lower band of the Bollinger Bands, indicating an oversold condition and the possibility of a rebound. Although the middle band is still trending downward, the price bouncing up from the lower band indicates some support below. If the price can effectively break through the middle band, it would signify the start of a new uptrend.
Furthermore, based on the KDJ indicator on the 4-hour chart of Bitcoin, the K-line and D-line values have formed a golden cross at a low level, and the J-line value is starting to rise from a low level, indicating a potential short-term rebound in the price of Bitcoin.
Lastly, according to the MACD indicator on the 4-hour chart of Bitcoin, the current DIF line and DEA line are both below the zero axis, showing a strong bearish trend. However, the shortening of the green MACD histogram indicates a weakening bearish momentum. If the DIF line can continue to rise and approach the DEA line, the market will experience a strong rebound.
Bitcoin 1-hour chart
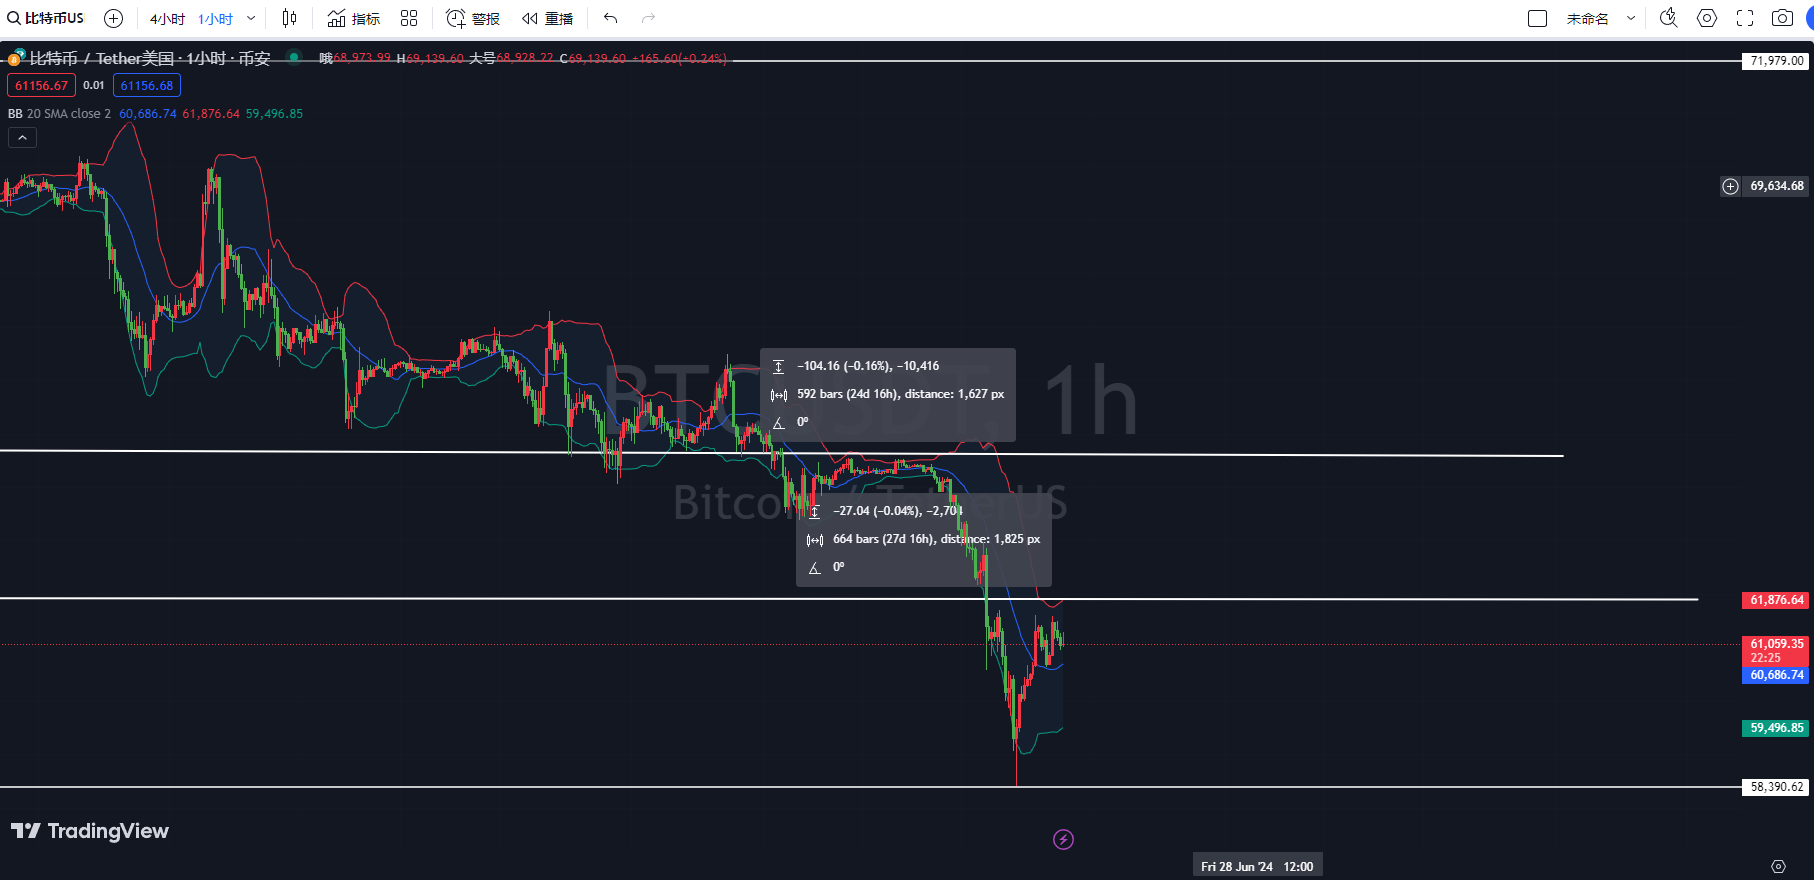
Based on the Bollinger Bands indicator on the current 1-hour chart of Bitcoin, the price of Bitcoin is fluctuating near the middle band, indicating that the market is seeking a breakthrough direction, either upward or downward. If the price can break through the upper band, it may signal a new round of uptrend. If the price falls below the middle band and approaches the lower band, it will further decline.
Additionally, based on the KDJ indicator on the current 1-hour chart of Bitcoin, the K-line and D-line values are showing a trend of crossing downward at a high level. They are still running above 50, indicating some short-term pressure for a pullback. If the K-line continues to cross below the D-line to form a death cross at a high level, the price will experience a short-term pullback.
Finally, according to the MACD indicator on the 1-hour chart of Bitcoin, the DIF line is below the zero axis and starting to approach the DEA line upward. The red MACD histogram is getting shorter, indicating a weakening bearish momentum. If the DIF line can break through the DEA line upward, it will be a strong buy signal.
In summary: The 4-hour chart of Bitcoin shows signs of a short-term rebound, but the overall trend is still bearish. The bearish momentum of the MACD indicator is weakening, the KDJ is giving a short-term buy signal with a golden cross at a low level, and the Bollinger Bands indicator shows the market is oversold. The 1-hour chart of Bitcoin shows that the market is in a short-term oscillation with some pullback pressure. The MACD indicator shows a weakening bearish momentum, but has not confirmed a buy signal; the KDJ indicator shows signs of a pullback at a high level; the Bollinger Bands indicator shows the price hovering near the middle band with an unclear direction.
In conclusion, the following suggestions are provided for reference:
Suggestion 1: Long position near $60,700, target $61,870, stop loss at $60,000.
Suggestion 2: Short position near $61,900, target $60,700, stop loss at $62,500.
Instead of giving you a 100% accurate suggestion, it's better to provide you with the correct mindset and trend, as teaching someone to fish is better than giving them a fish. The focus is on the mindset, the grasp of the trend, and the layout and planning of the market. I can only use my practical experience to help everyone make investment decisions and manage operations in the right direction.
Time of writing: (2024-06-25, 21:00)

(By - Da Xian Shuo Bi) Disclaimer: The publication on the internet has a delay, and the above suggestions are for reference only. The author is dedicated to the research and analysis of investments in Bitcoin, Ethereum, altcoins, foreign exchange, stocks, and other financial markets, with years of experience in live trading. Investment involves risks, so entry into the market should be cautious. For more real-time market analysis, please follow Da Xian Shuo Bi for discussion and exchange.
免责声明:本文章仅代表作者个人观点,不代表本平台的立场和观点。本文章仅供信息分享,不构成对任何人的任何投资建议。用户与作者之间的任何争议,与本平台无关。如网页中刊载的文章或图片涉及侵权,请提供相关的权利证明和身份证明发送邮件到support@aicoin.com,本平台相关工作人员将会进行核查。


