
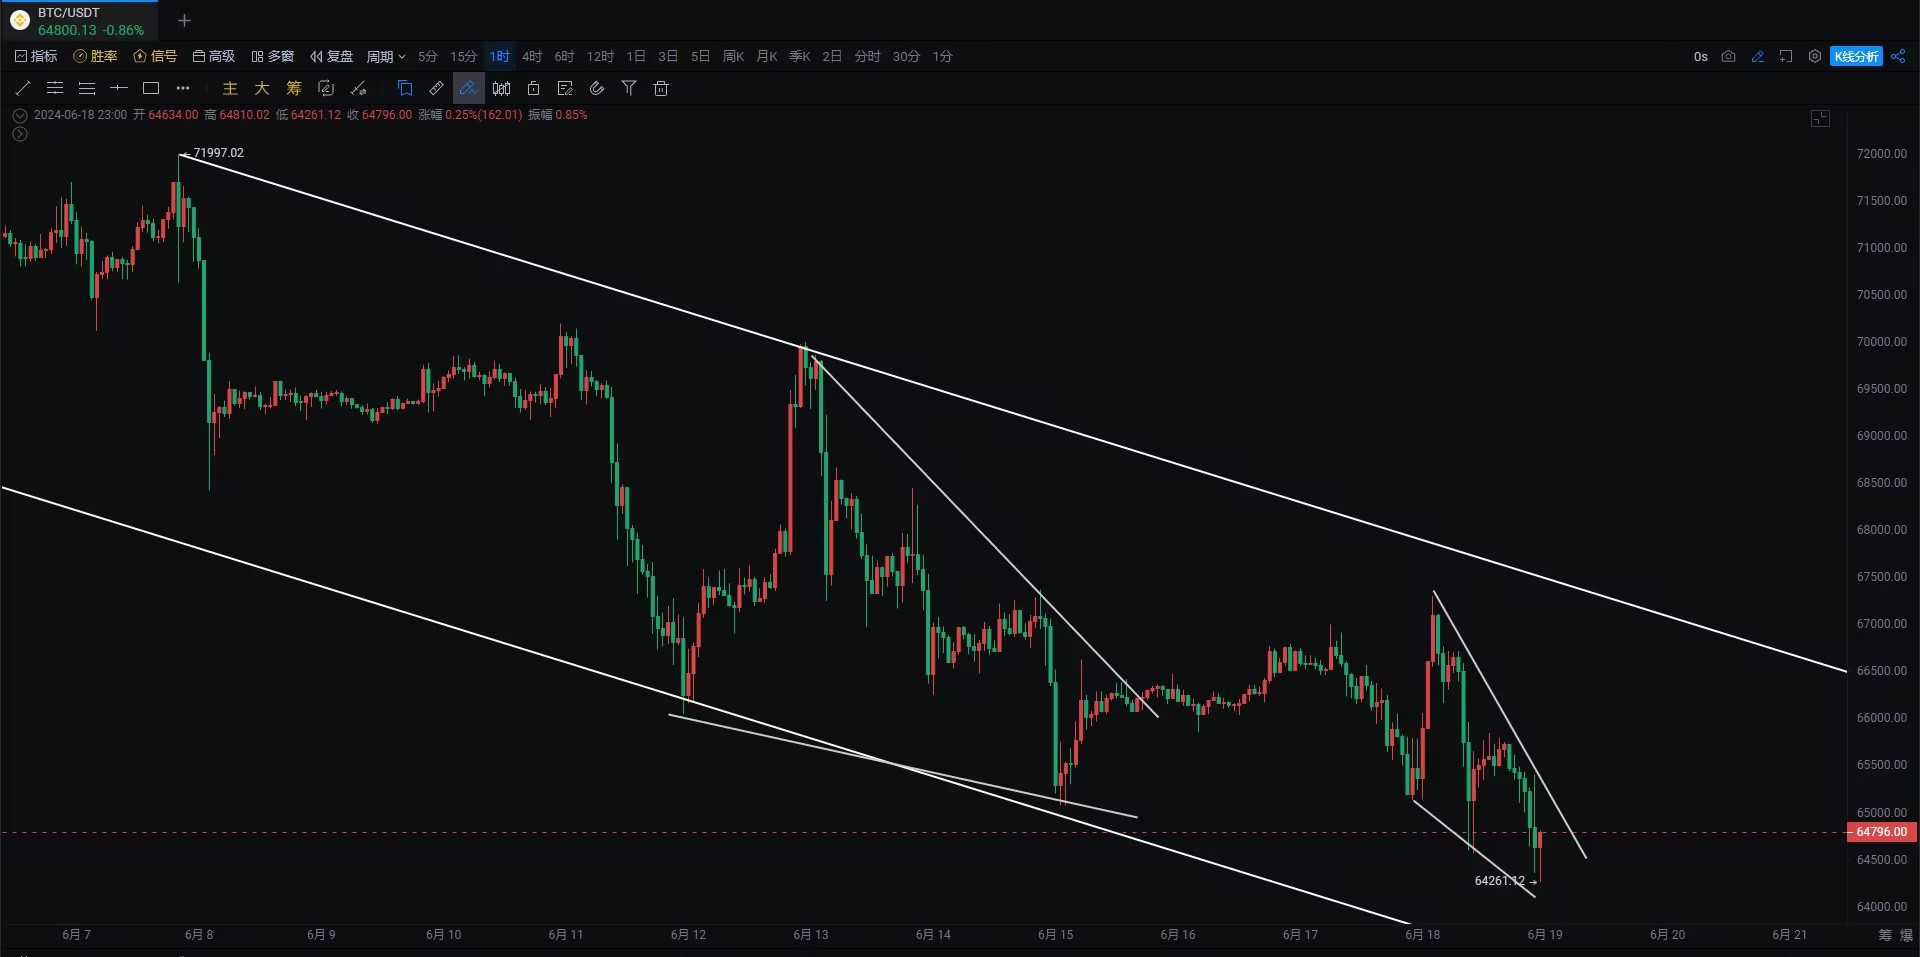
The daily line has broken through the MA60 and MA120. Although today's closing line has not yet taken shape, it is basically a hammer line. As of the time of writing, the lowest point reached was 64359, and if the rebound fails to reach 65000, the downtrend will continue.
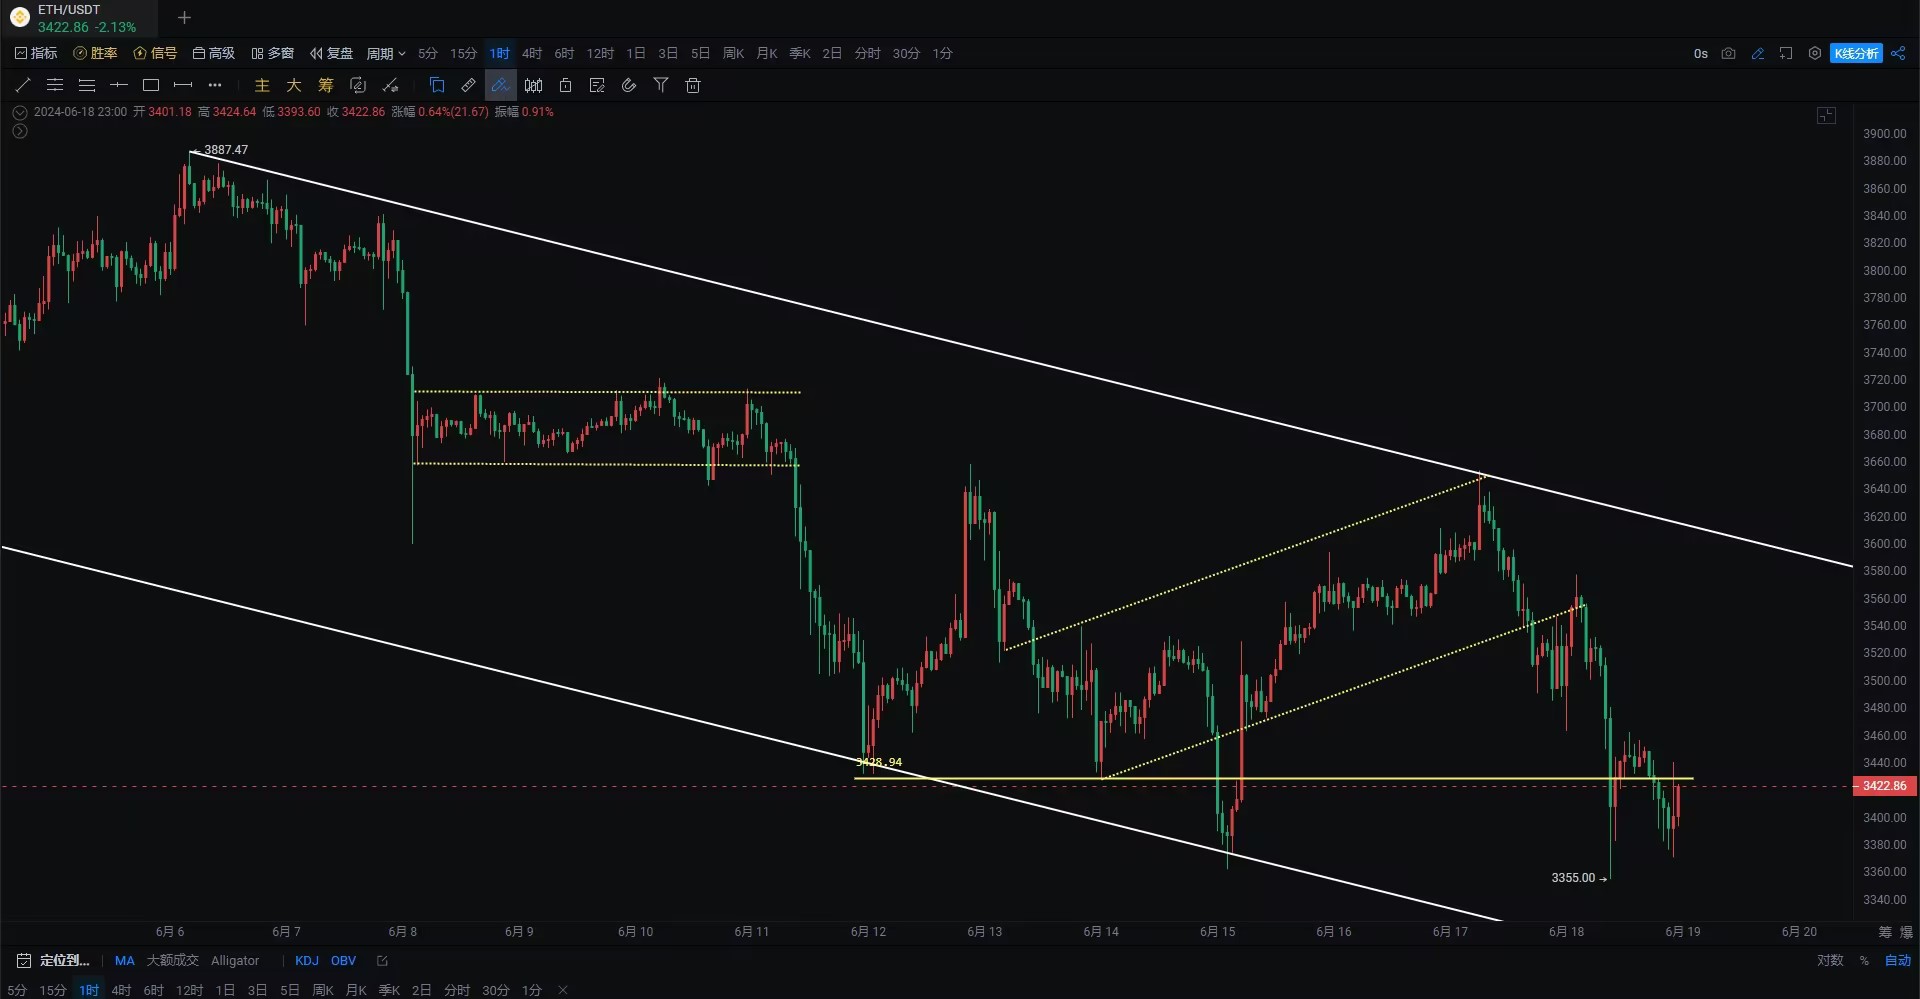
Ethereum has made a second attempt to bottom out and has pierced through the MA60 and MA120. It is still above 3362 for now, but it is still being led by Bitcoin and finding it difficult to establish an independent market trend. As for the altcoin market, it is currently not looking good, with most experiencing a drop of more than ten to twenty points.
24/06/07 The European Central Bank cut interest rates for the first time in five years. Bitcoin has been rejected multiple times at 72000, and there are things to watch out for in the short term!
24/06/11 JPMorgan shorts gold futures worth trillions of dollars, and the US dollar index continues to play tricks. How will the crypto market respond?
24/06/12 There is a potential "M" pattern at the weekly level, and it is advisable to reduce holdings on the spot market when the price is high, and be cautious of a sharp drop similar to the market situation on May 19th!
24/6/13 Bitcoin experiences a battle between long and short positions, and there is a potential risk of a sharp decline in CRV. The downtrend has not changed.
24/06/14 Rejected under strong pressure, the daily line shows two negative candles sandwiching a positive one, indicating an imminent sharp decline!
We have provided relatively timely reminders and insights into the market trends over the past few months. Every time Bitcoin touched 72000 and rebounded, we warned of an imminent sharp decline, and the market trends have unfolded as expected. In fact, the reason is very simple: if the strong pressure cannot be overcome, a pullback is inevitable. Those who understand will naturally comprehend, and there is no need for excessive technical analysis…
Bitcoin
The daily line has broken through the three moving averages and is currently in a bearish trend. The weekly "M" pattern has broken through the previous support line at 66000, which was the neckline of the head and shoulders pattern. The next important support is at 62000-63000. The daily trend is also bearish, having tested the 65000 support three times and then broken through it. The trend has not changed.
The MA moving averages on the daily line have shown a bearish signal. For a larger rebound opportunity, we need to see support around 59600-60600. If it continues to decline, it will directly test the 56552 support, and there is a potential perfect bullish "bat" pattern at 43000-50000. I will be paying attention to opportunities to buy at 60600 | 56552 | 43000.
There have been two instances of descending wedge patterns on the 4-hour chart around 65000. There is hope for a short-term rebound in the range of 63000-64000.
Support:
Resistance:
Ethereum
Ethereum has failed to reclaim the positive candlestick pattern and continues to decline. It is currently at the bottom of the positive candlestick pattern, and although it has made a second attempt to bottom out, the probability of a significant decline is still high, as it has followed a similar path to Bitcoin, dropping sharply under the influence of Bitcoin.
The bulls are struggling to support the rebound, and many altcoins have experienced a significant decline, with many of them breaking through previous platform supports. Even if there is a later ETF spot market rally for Ethereum, it is questionable whether some altcoins can quickly recover. This round of institutional bull market is very complex, with poor money-making effects. The operation of Bitcoin is becoming more and more similar to that of the US stock market. The fact that the correlation between Bitcoin and the US stock market has reached the highest level in 18 months indicates a problem. Furthermore, this round of bull market is different from the high-interest bull market in 2020-2021.
Support:
Resistance:
If you like my views, please like, comment, and share. Let's navigate the bull and bear markets together!!!
This article is time-sensitive and is for reference only. It is updated in real time.
Focusing on candlestick technical analysis, we can win global investment opportunities. Follow our public account: "Trading Master Fusu"

免责声明:本文章仅代表作者个人观点,不代表本平台的立场和观点。本文章仅供信息分享,不构成对任何人的任何投资建议。用户与作者之间的任何争议,与本平台无关。如网页中刊载的文章或图片涉及侵权,请提供相关的权利证明和身份证明发送邮件到support@aicoin.com,本平台相关工作人员将会进行核查。


