This article is only a personal opinion on the market and does not constitute investment advice. If you act based on this, you are responsible for your gains and losses.
It's been a while since I shared my views on the market with my friends. Today, I will share my views on the market from the perspective of Elliott Wave Theory.
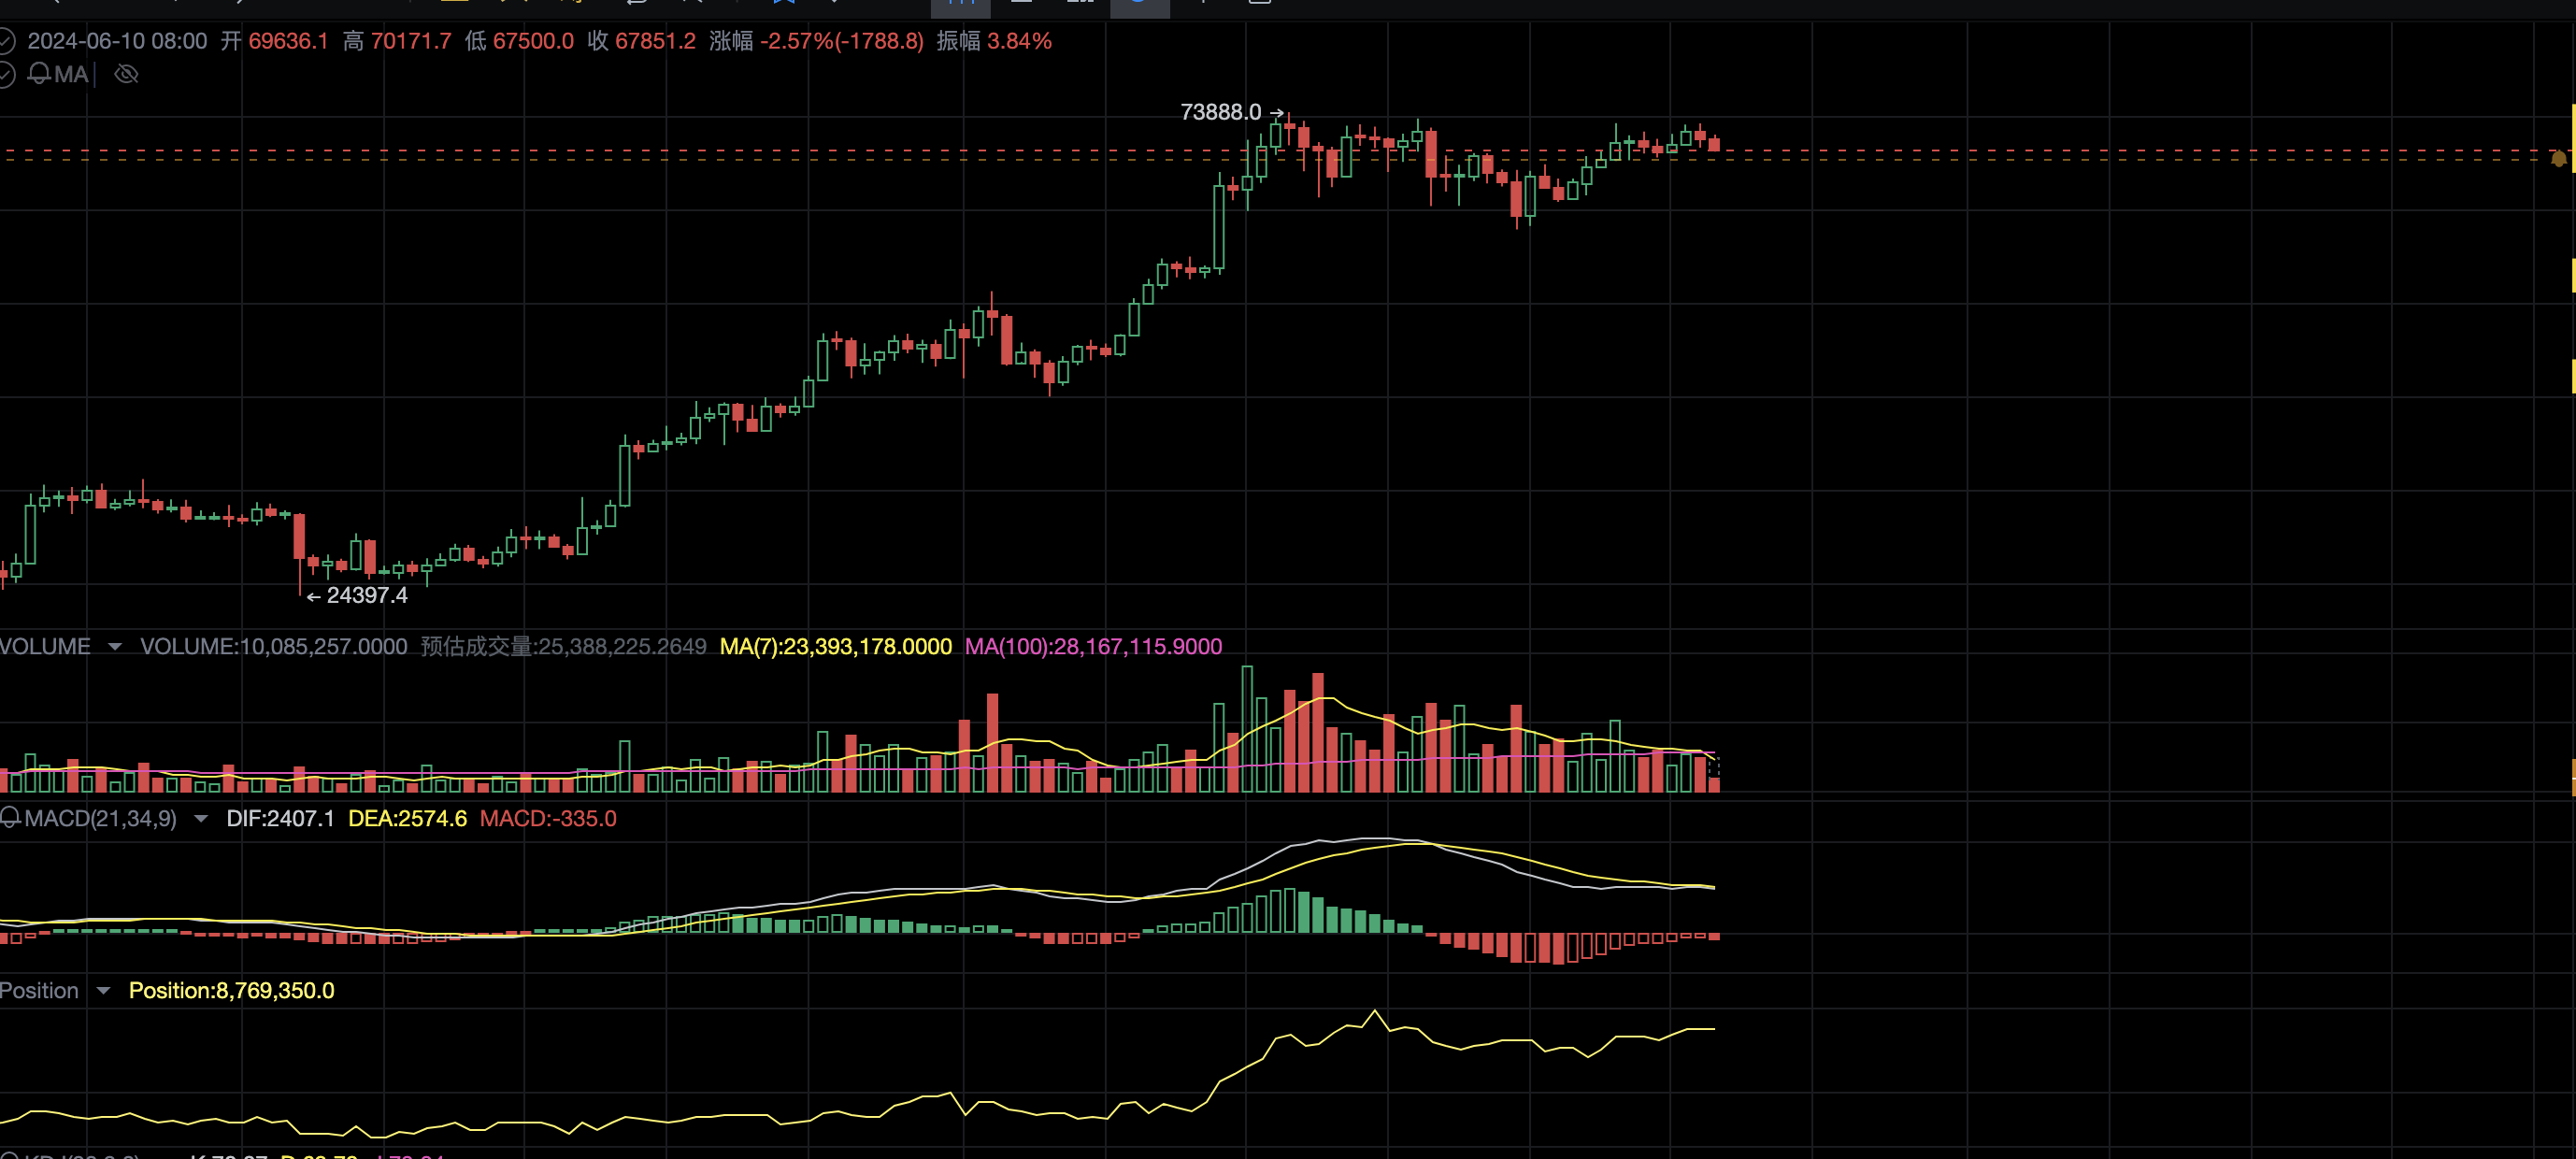
To see more clearly, I used the K-line of BTC's spot ETF—IBIT. The chart below is a 3-day line chart. From the chart, it is clear that a clear 5-wave structure has emerged from the rebound since the end of April. If the recent pullback is below the low of May 31st (corresponding to BTC price near 66,000), then the 5-wave trend is clearly over. A new round of pullback will unfold. The next entry opportunity will be at the end of the pullback or a breakthrough of the high point of this rebound at 72,000.

Since the rebound from May 1st is a 5-wave structure and has not exceeded the high point in March, this 5-wave trend is most likely the 1st wave in a larger uptrend. Therefore, the subsequent low of the pullback will not be lower than the low point at the end of April—around 56,500.
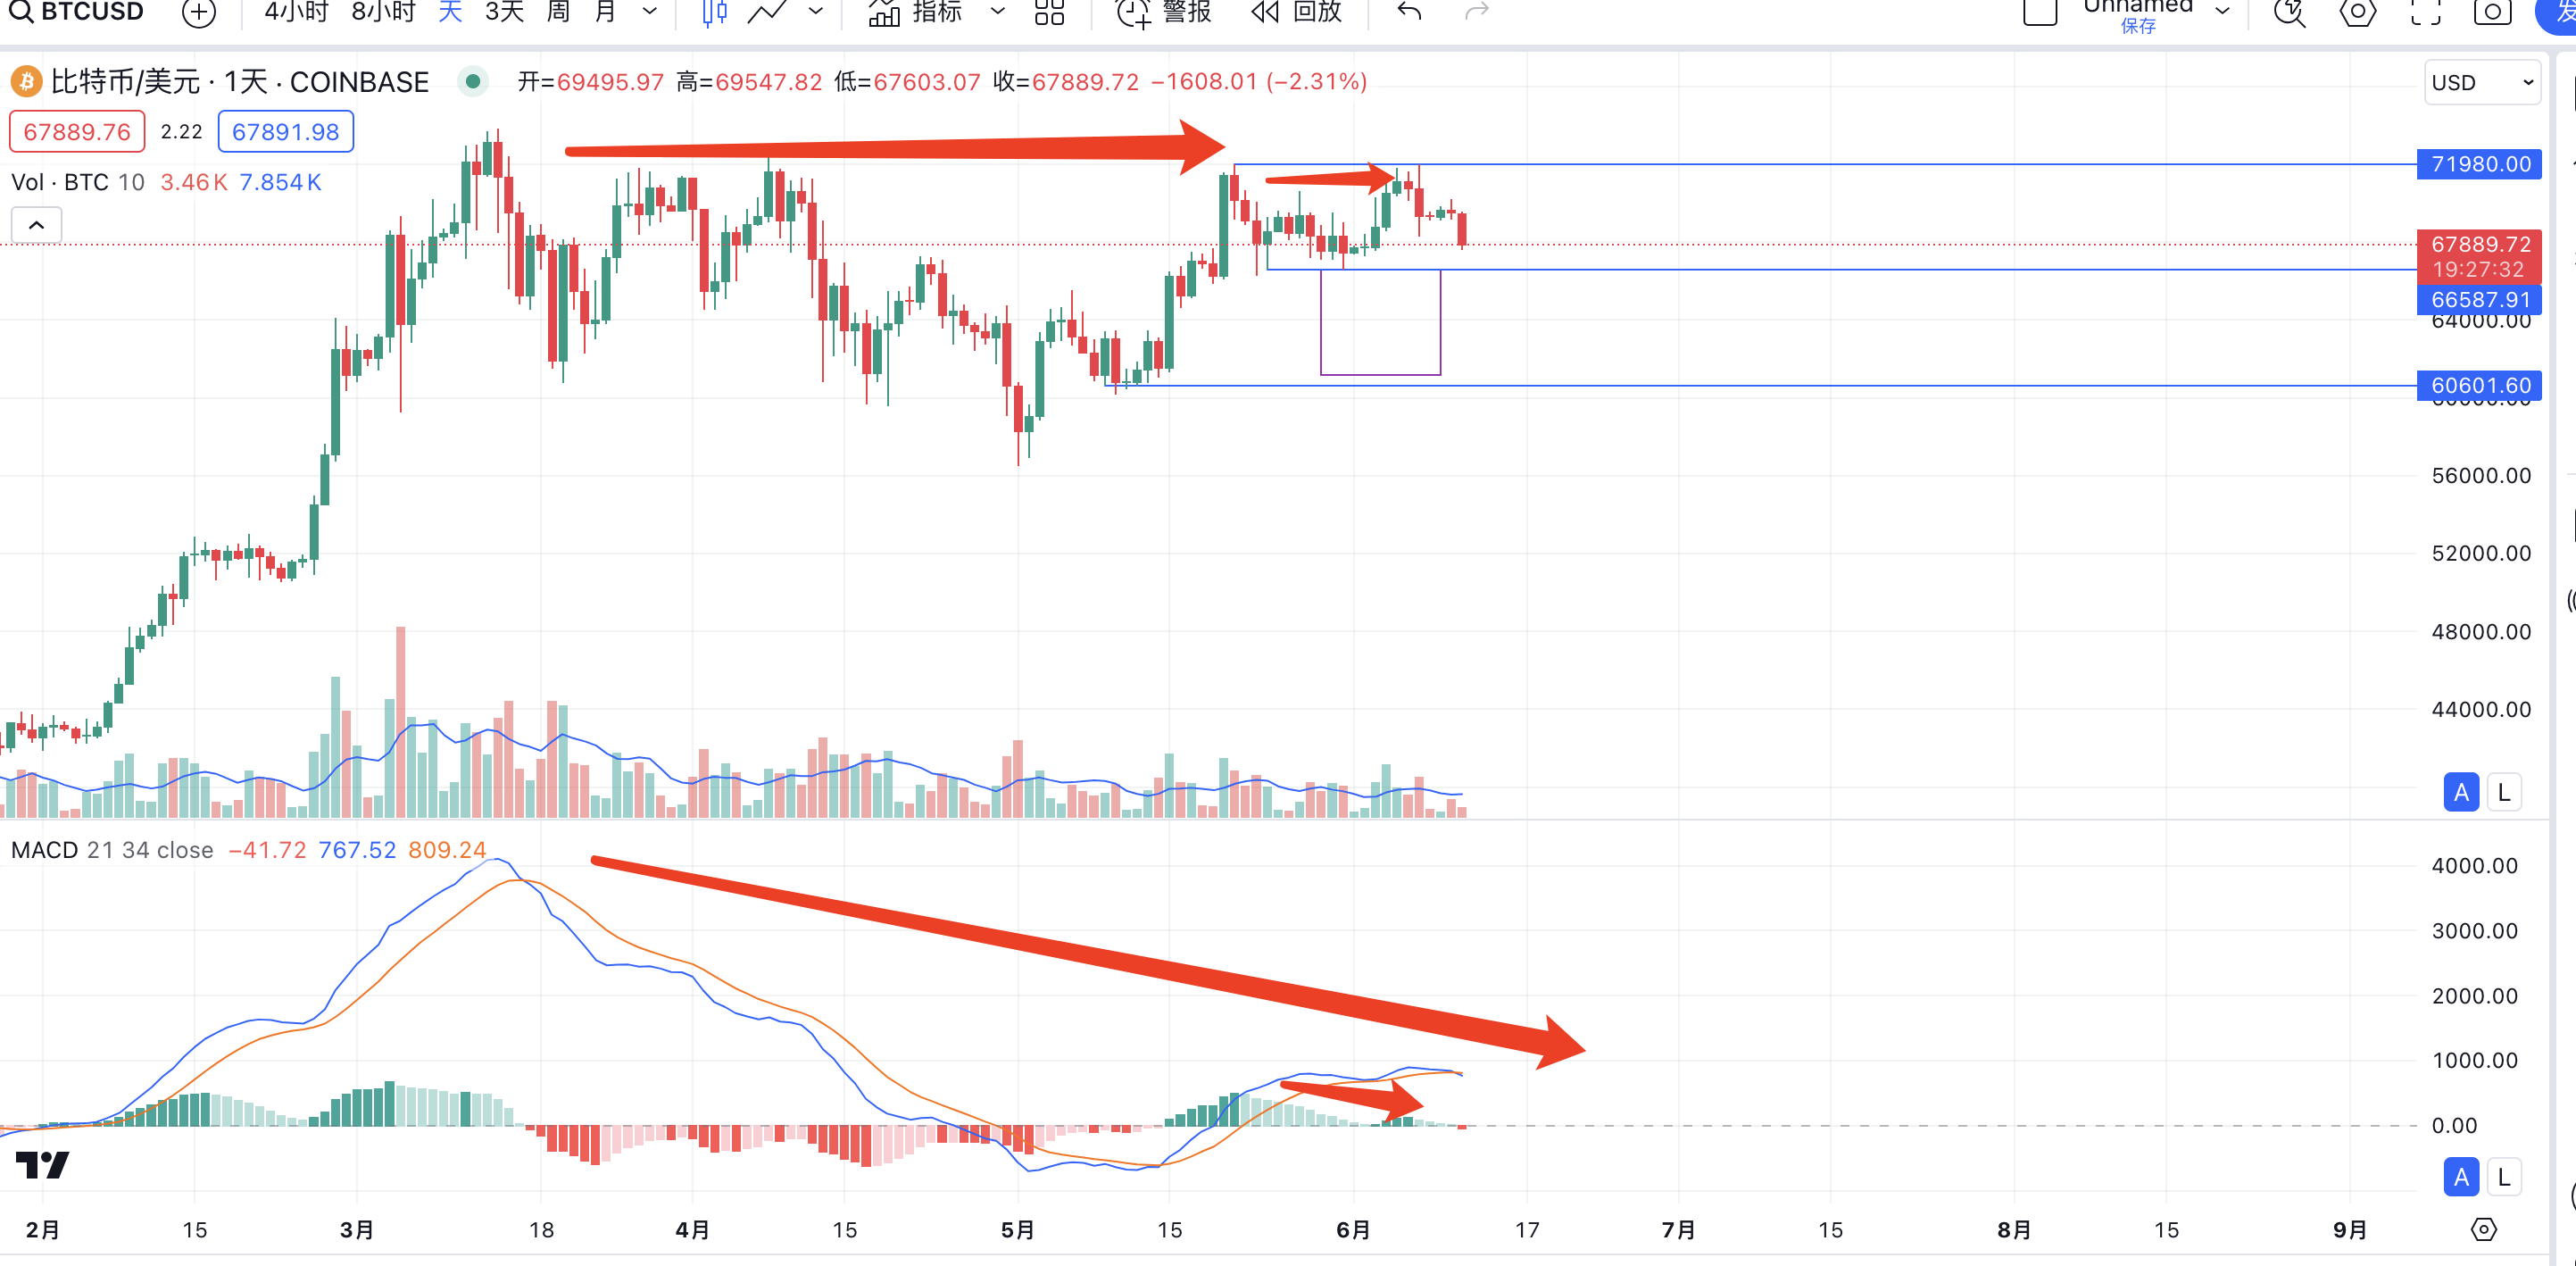
Looking at the chart of BTC itself, if it falls below 66,000, it will form a double top/rectangle pattern. Combined with the daily MACD divergence and death cross, it indicates a bearish outlook. Therefore, once it falls below 66,000, it will most likely return to around 61,000.

There are several macroeconomic data releases this week, especially the CPI+interest rate decision+monetary policy release tomorrow night. If the data is favorable and supports a rebound, there may still be short-term opportunities, but the premise is that a new high must be reached. If the rebound does not reach a new high, it will continue to fall.
Overall, it is not advisable to hold leveraged long positions at the moment. If the price falls below 66,000, it will most likely continue to pull back. Looking at BTC's 3-day MACD, it also shows divergence. If the 3-day MACD is to be restored to near the zero axis, it will probably take another month. Therefore, once it falls below 66,000, I personally believe that there will not be any significant market movements in the next 1-2 months.

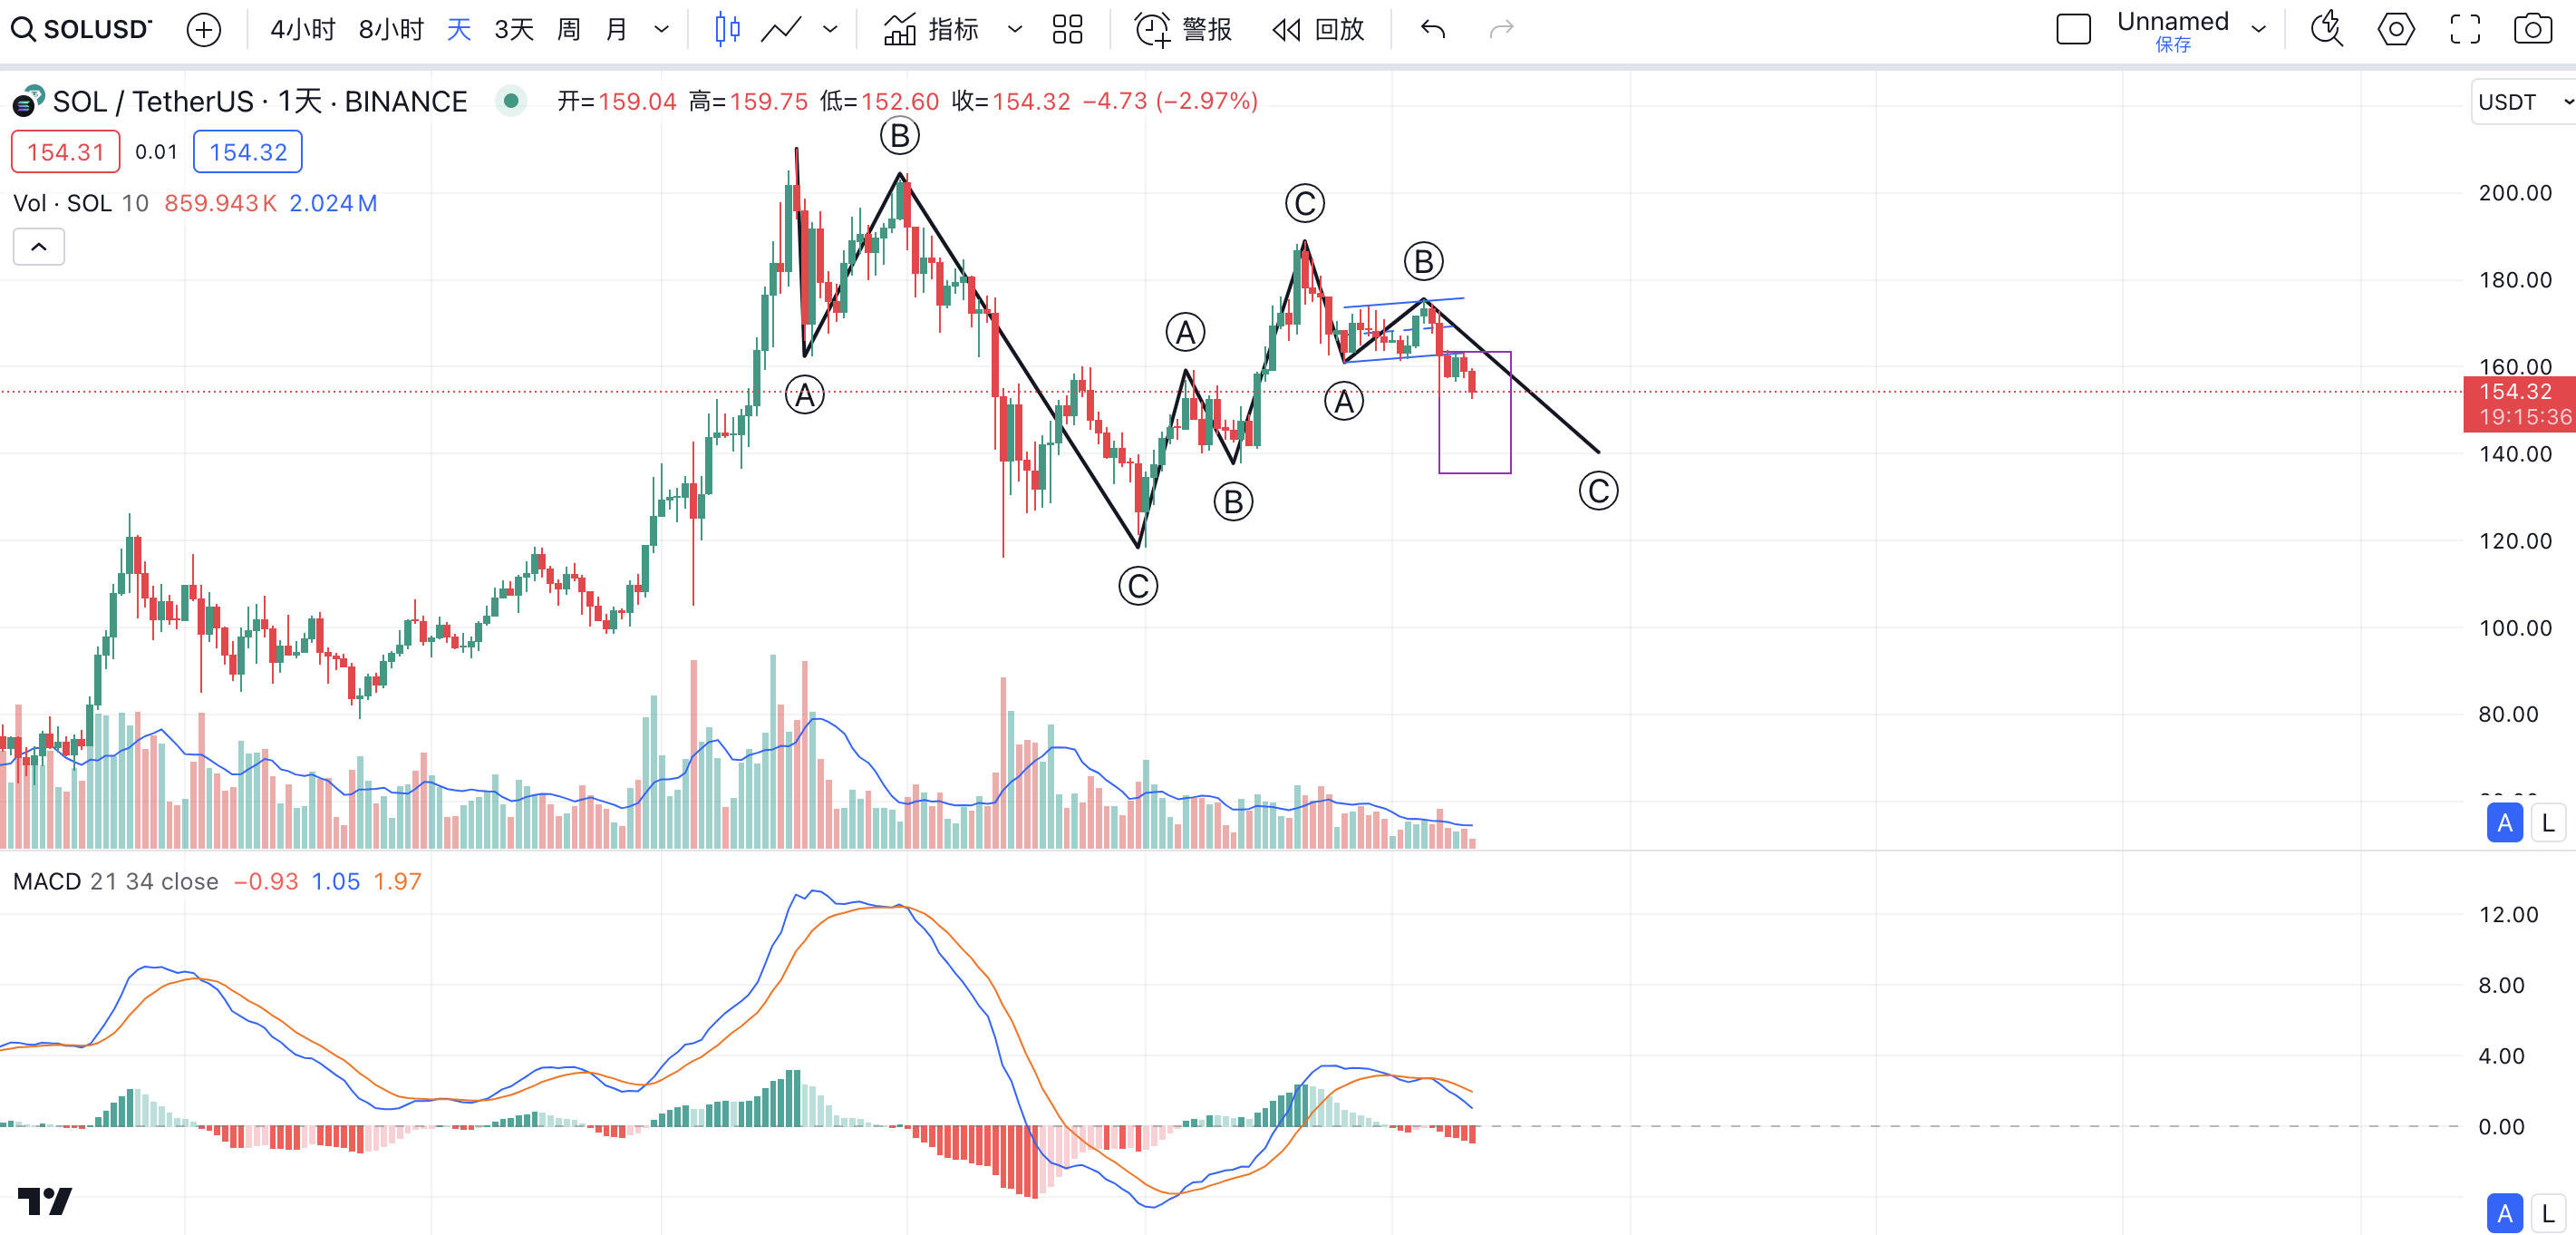
Sol's trend is also not ideal. Currently, it seems to be in a new downtrend and has already formed a descending flag pattern. Indicators are bearish, and trading volume is shrinking. Currently seen at 137.

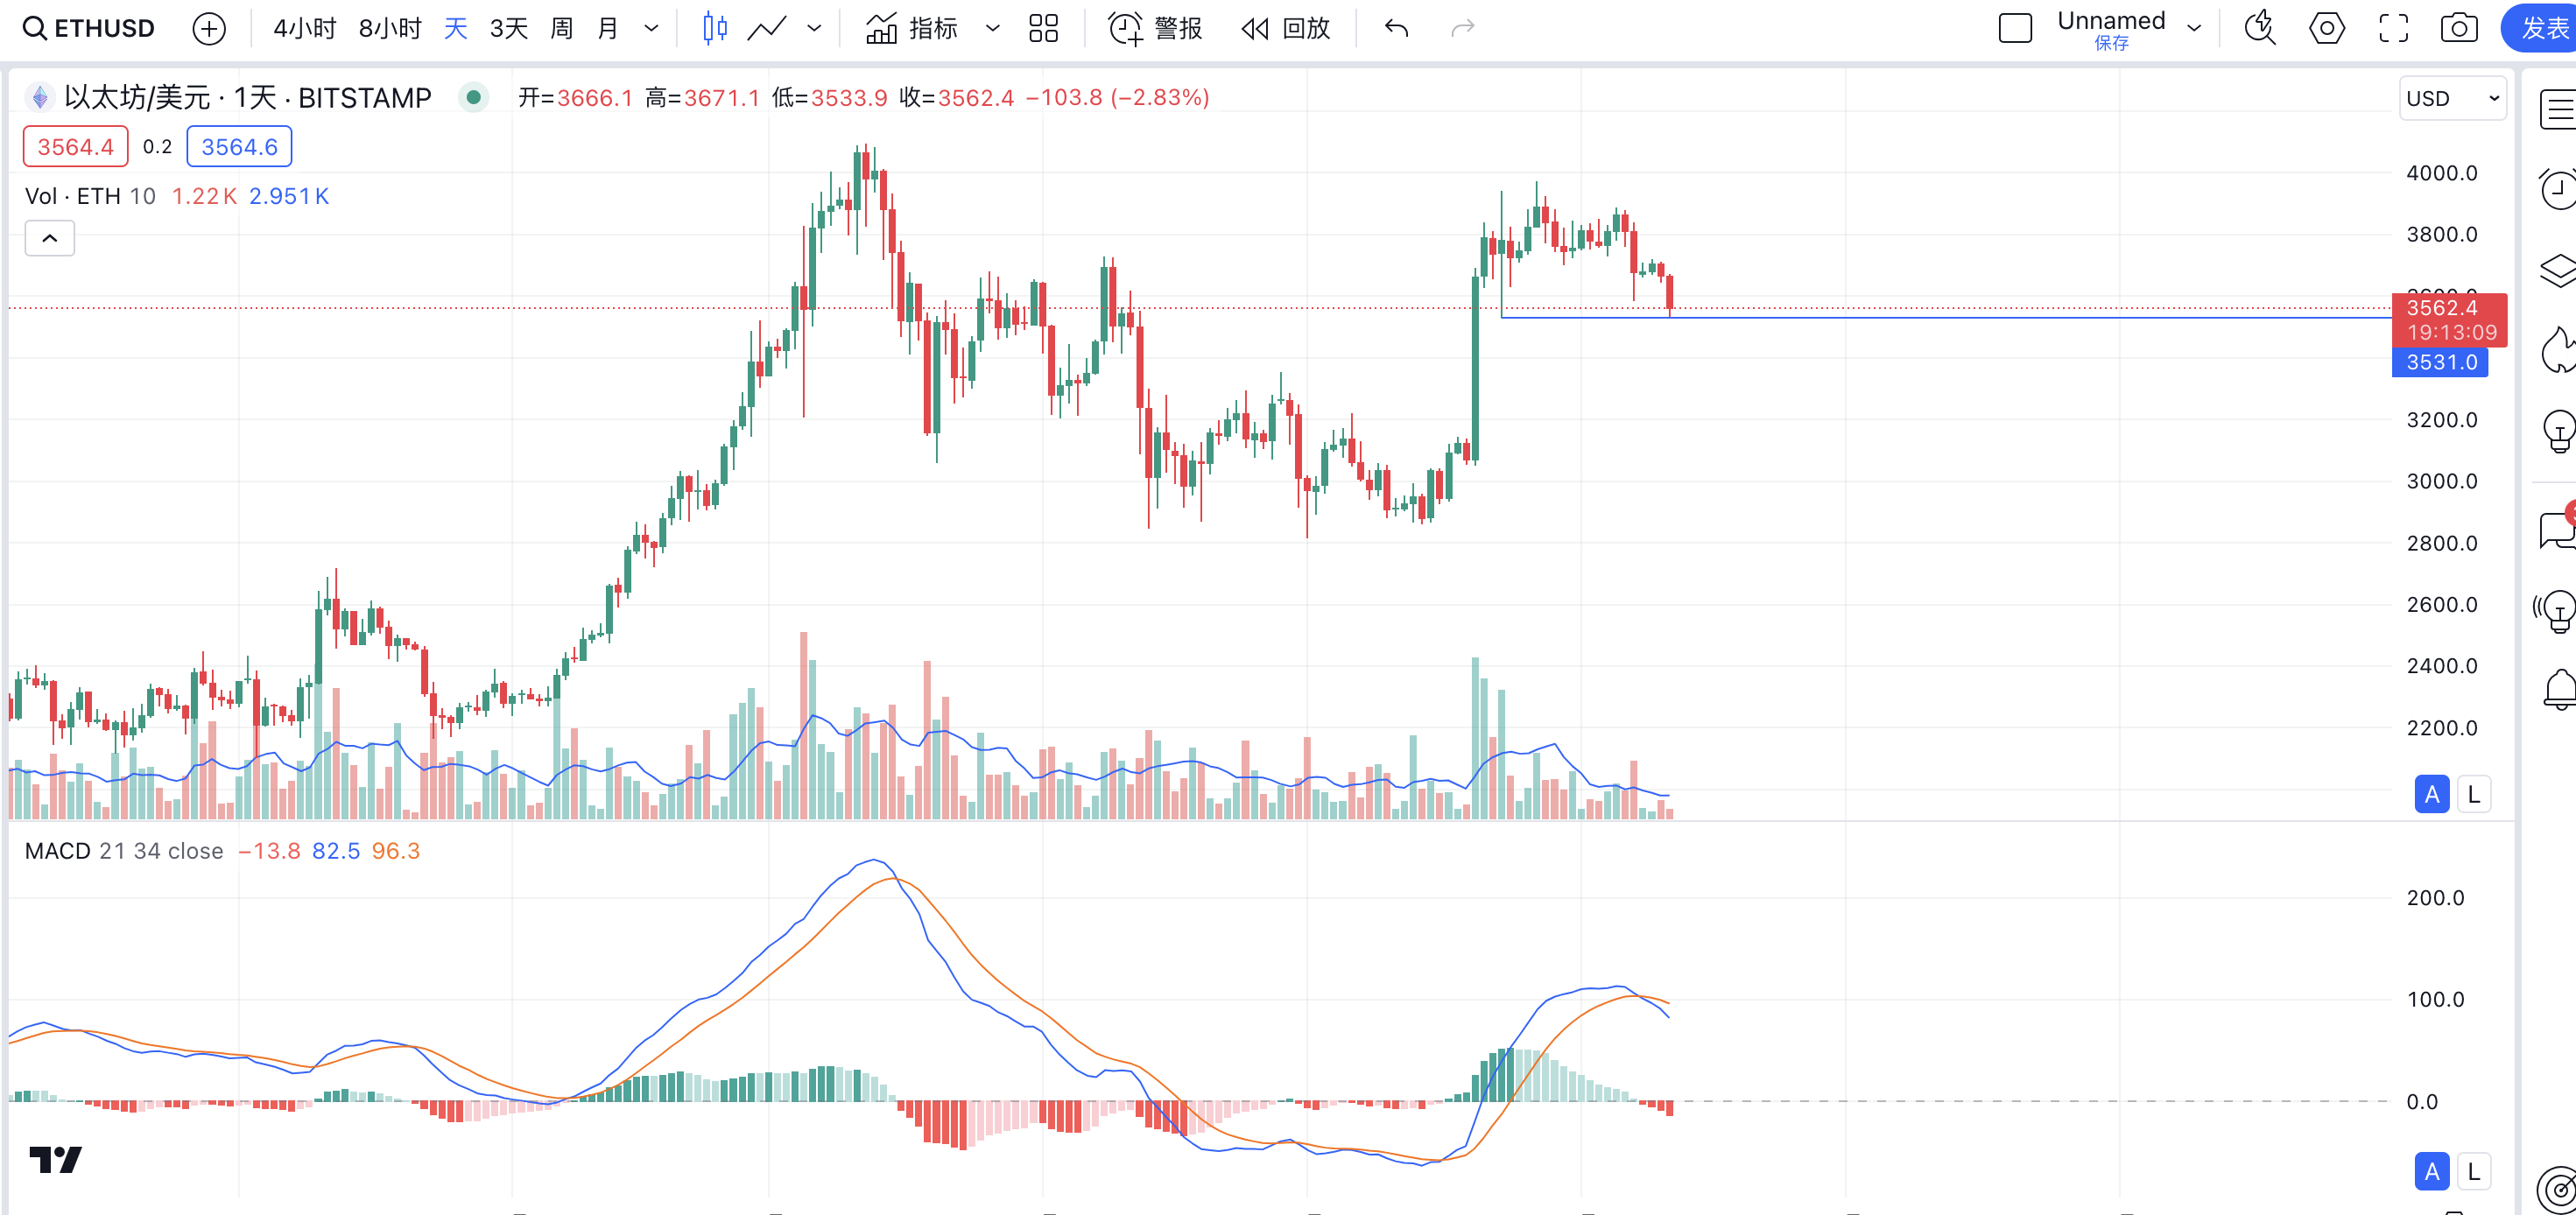
ETH has currently formed an arc top. If it falls below 3530, it will likely head towards 3100.

Currently, from the indicators and charts, the trends do not look very optimistic. But the conclusion is still unclear, and the bulls have not failed yet. Whether it goes up or down, it will probably be clear tomorrow. If it goes up, there is still a lot of room for growth. From the Elliott Wave perspective, BTC can at least reach over 80,000. 66,000 and 72,000, it depends on which direction these two positions will go.
Follow me to maximize trend profits with minimal operations.

免责声明:本文章仅代表作者个人观点,不代表本平台的立场和观点。本文章仅供信息分享,不构成对任何人的任何投资建议。用户与作者之间的任何争议,与本平台无关。如网页中刊载的文章或图片涉及侵权,请提供相关的权利证明和身份证明发送邮件到support@aicoin.com,本平台相关工作人员将会进行核查。


