During the Dragon Boat Festival, the price trend of Bitcoin is worth paying attention to. Over the past 10 years, the price of Bitcoin during the Dragon Boat Festival is as follows:
2014: $637
2015: $232
2016: $582
2017: $2,620
2018: $6,641
2019: $8,739
2020: $9,468
2021: $34,763
2022: $30,023
2023: $26,483
2024: $69,667
Looking forward to the bull market in 2025!
In the past week, the U.S. Bureau of Labor Statistics released the Non-Farm Payrolls (NFP) data, showing that the U.S. added 339,000 non-farm jobs in May, significantly exceeding the market's expectation of 195,000. This strong job growth reflects the continued health of the U.S. labor market, although the unemployment rate has slightly increased to 3.7%.
These data have had a significant impact on the market. Due to the job data far exceeding expectations, the Federal Reserve may reconsider its monetary policy, especially in terms of interest rates. This has increased the market's expectation of potential future rate hikes, leading to price fluctuations in risk assets such as Bitcoin.
Bitcoin recently reached near its previous high of $73,881 and then sharply declined, partly due to the market sentiment following the release of the aforementioned non-farm data. Investors tend to seek safe havens after the data release, selling off high-risk assets and buying safe-haven assets such as the U.S. dollar, putting pressure on the price of Bitcoin.
Key resistance level touched When Bitcoin approached the previous high position of $73,881, selling pressure significantly increased. This price level, as a historical high, attracted a large amount of profit-taking, leading to a sudden increase in pressure when Bitcoin approached this level, resulting in a noticeable pullback.
Market sentiment change The Bitcoin market's sentiment fluctuates significantly, and investors are highly sensitive to macroeconomic data and Federal Reserve policy. In such a market environment, Bitcoin may continue to face significant volatility in the short term.
From the weekly candlestick chart, the consolidation period is not enough, and there is an expectation of a sharp decline in the next three weeks.
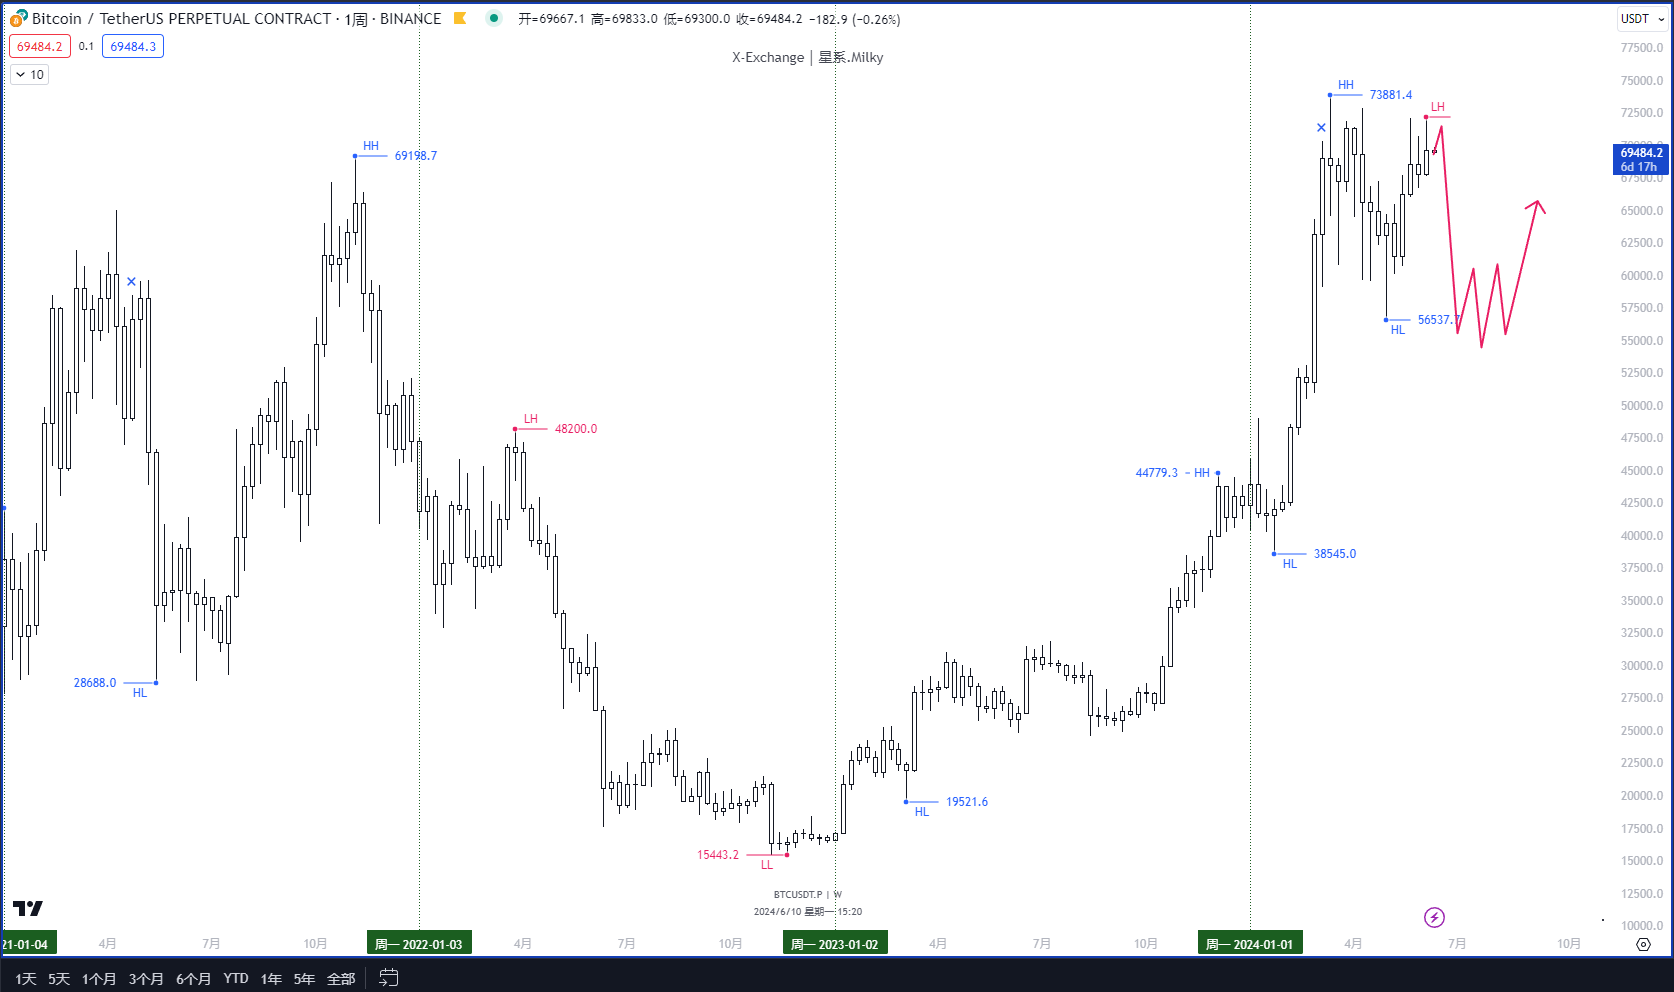
The weekly low point on April 29 was 56.5K, after 6 weeks of rebound, the price reached the previous high point of 73.8K, encountering resistance and continuously closing with long upper shadows for three weeks. If the weekly candlestick closes below 67K, there may continue to be a test of 56.5K in the next four weeks. In terms of space, the momentum to reach 80K is still insufficient.
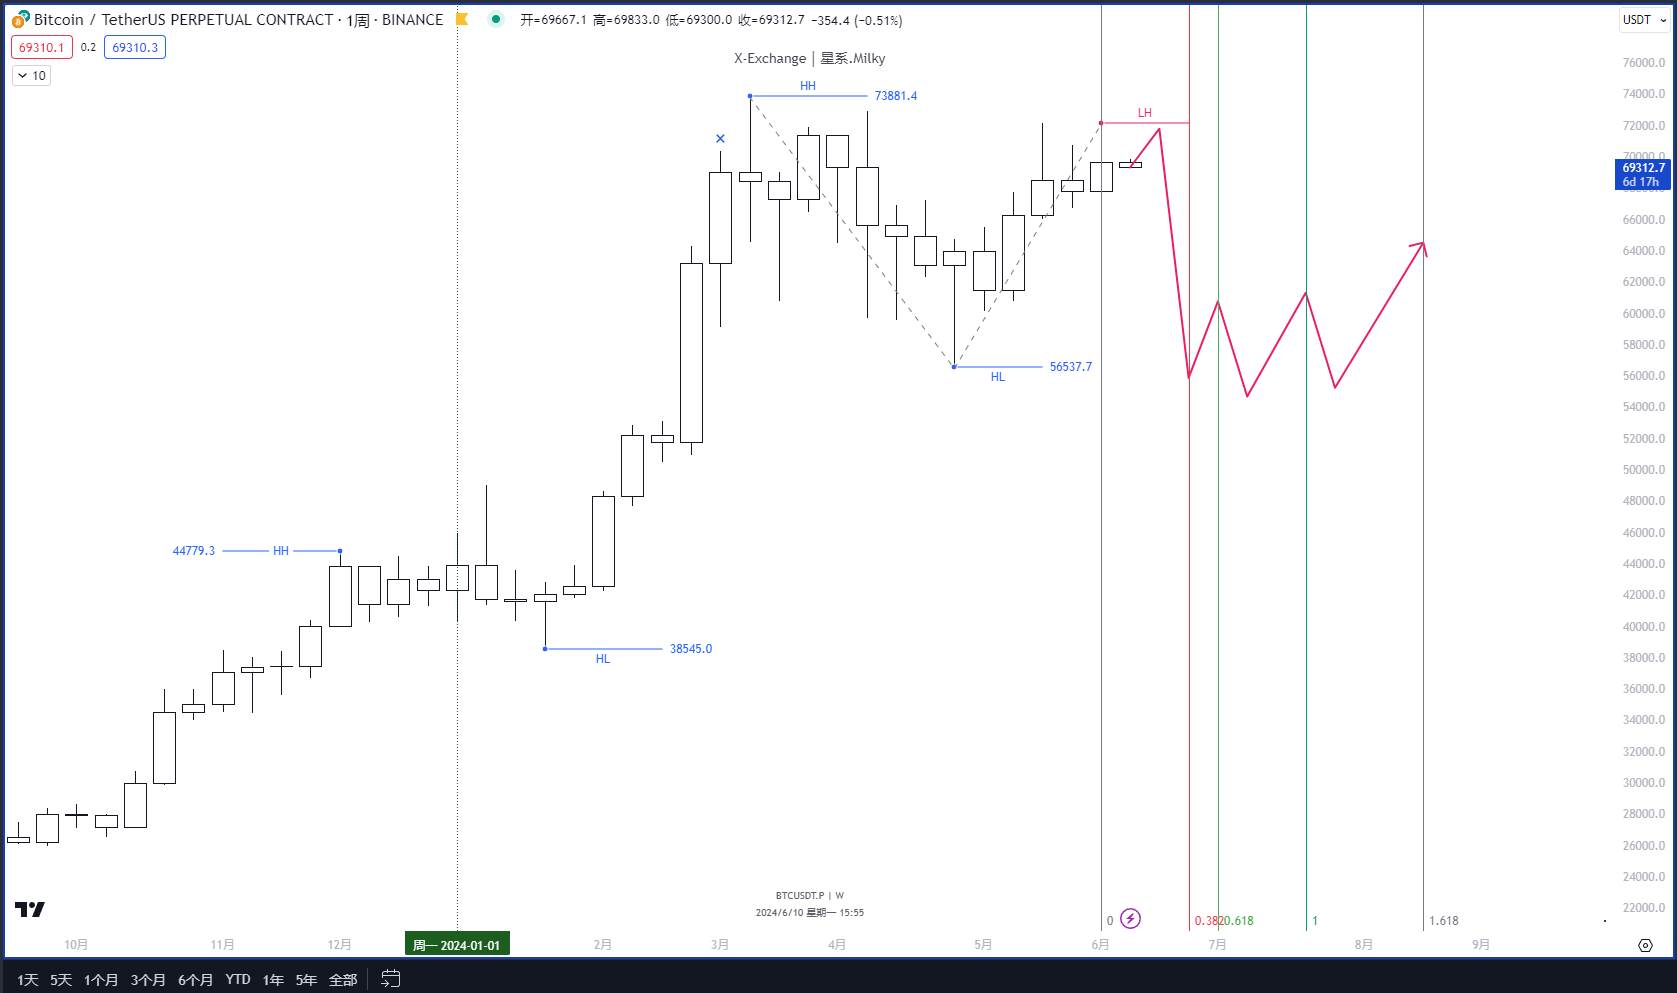
Through Fibonacci trend time testing, this downward cycle will continue until the second half of July. Let's patiently hold onto the chips in our hands.
I know it's really difficult to stay calm in such a turbulent market, but I believe the bull market still exists! Just don't lose patience and hold onto our long-term targets. I believe that in the next 5 months, many assets in the crypto market will have a 5-10X performance, so please stay calm. Time is the best friend for realizing value!
Recording my daily trading, sharing the most immediate thoughts and trading details, updated every trading day.
免责声明:本文章仅代表作者个人观点,不代表本平台的立场和观点。本文章仅供信息分享,不构成对任何人的任何投资建议。用户与作者之间的任何争议,与本平台无关。如网页中刊载的文章或图片涉及侵权,请提供相关的权利证明和身份证明发送邮件到support@aicoin.com,本平台相关工作人员将会进行核查。


