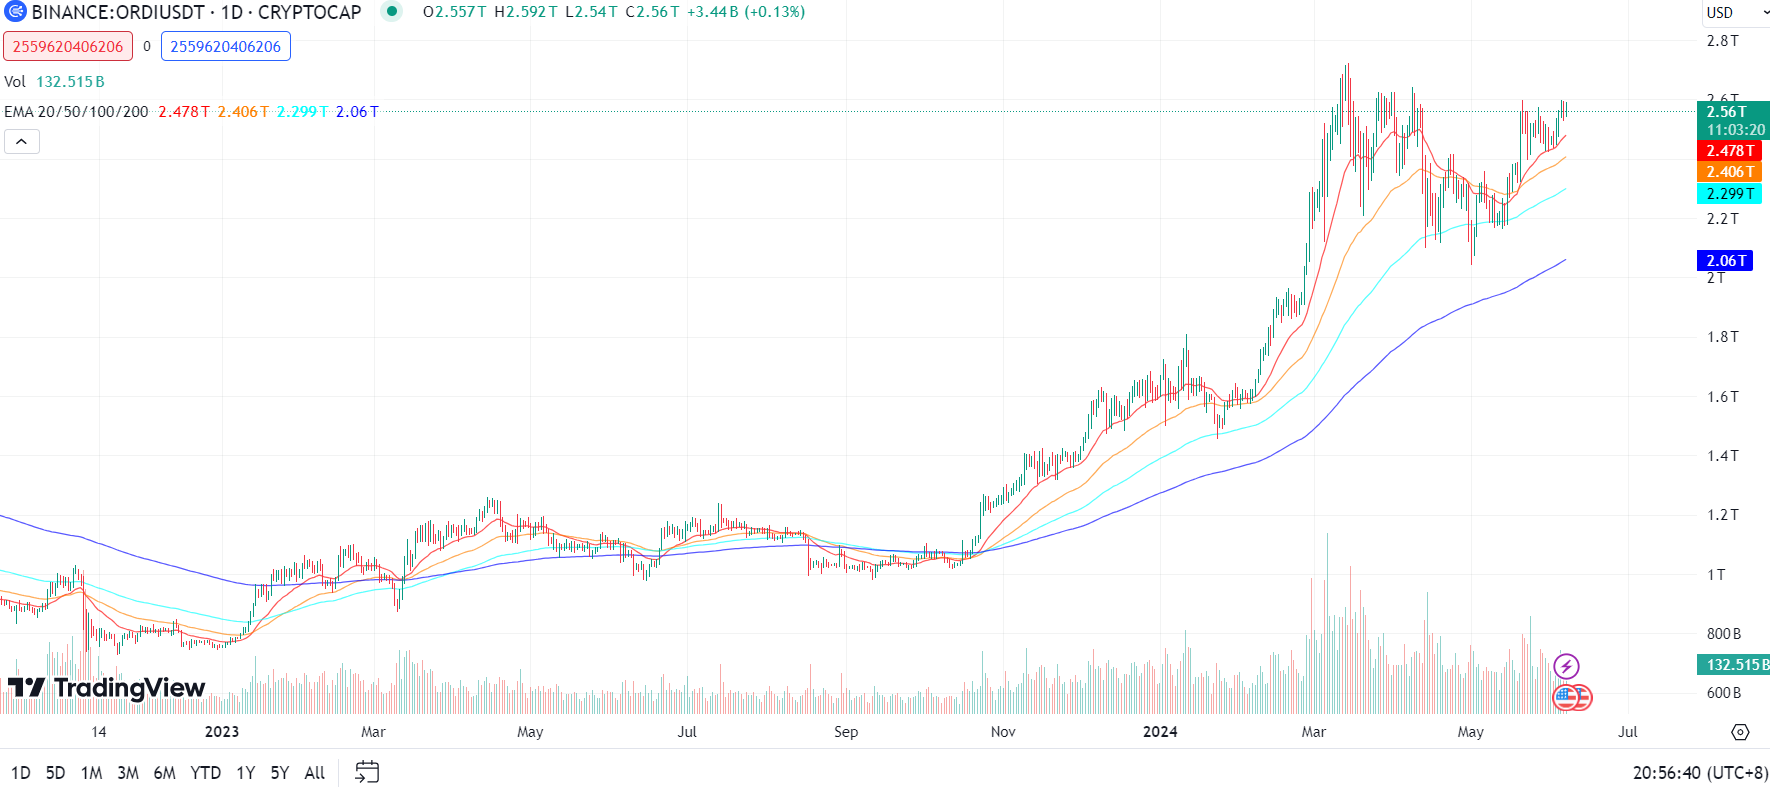
The total market value of the cryptocurrency market has recently stabilized below a key resistance level, waiting for an opportunity to break through. The price of Bitcoin (BTC) has also stabilized above $70,000, approaching a breakthrough of a key barrier.
Of course, benefiting from the overall upward trend, BNB has reached new heights, shining exceptionally. Let's take a look at the core indicators of BNB👇
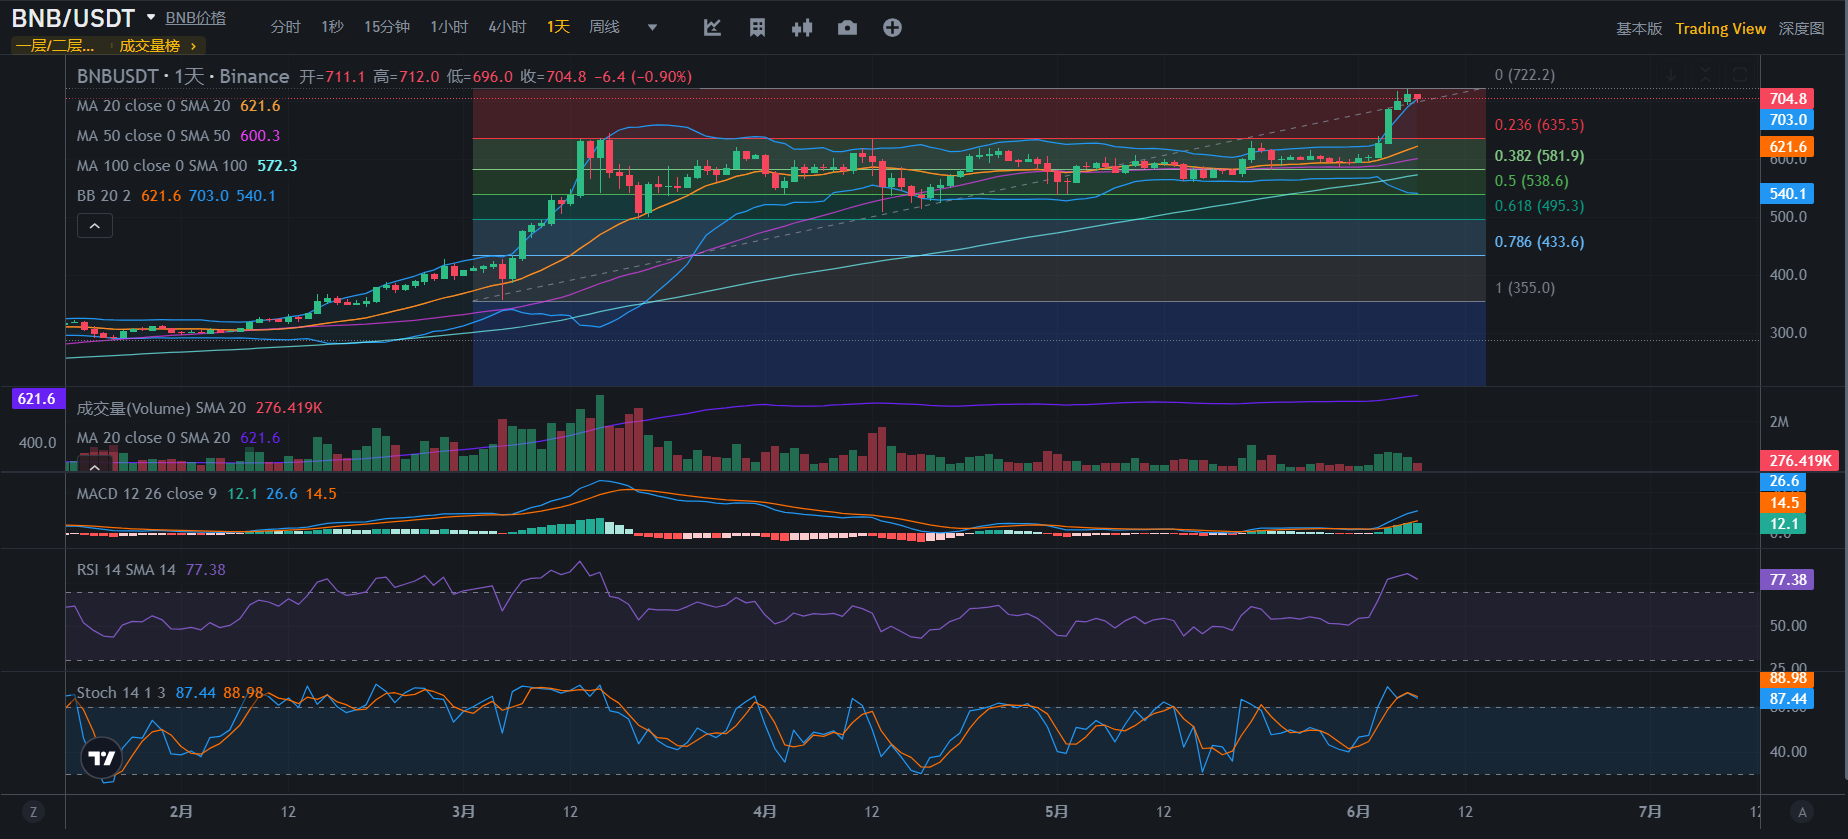
From the K-line chart of BNB/USDT, we can see the following key information:
- Price and Moving Averages:
- The current price is around 704.8 USDT, slightly lower than yesterday's closing price.
- The 20-day moving average (MA 20) is 621.6 USDT, the 50-day moving average (MA 50) is 600.3 USDT, and the 100-day moving average (MA 100) is 572.3 USDT. The current price is higher than these three moving averages, indicating a relatively strong upward trend in the near term.
- Bollinger Bands:
- The price is close to the upper Bollinger Band, indicating potential short-term pullback pressure.
- Volume:
- The trading volume has slightly increased, but not significantly. An increase in trading volume usually accompanies a rise in price, but the current level of trading volume indicates that the market may be digesting the previous gains.
- MACD:
- The MACD line (blue) is above the signal line (orange), indicating a buy signal. The MACD histogram is positive, showing the market's upward momentum.
- RSI:
- The RSI is 77.38, in the overbought zone, indicating the risk of a price pullback in the short term, further increasing the likelihood of a short-term pullback.
- Fibonacci Retracement Levels:
- The price fluctuates between the 0.236 Fibonacci retracement level (635.5 USDT) and the 0 level (722.2 USDT). The current resistance level is at 722.2 USDT, and the support level is at 635.5 USDT.
In summary, the current price of BNB is close to a short-term high, showing signs of overbought conditions, and a pullback may occur. It is recommended to closely monitor changes in trading volume and key support and resistance levels. If the price can effectively break through the resistance level of 722.2 USDT, it may further rise; otherwise, it may pull back to around 635.5 USDT in the short term.
Thank you for reading. Investment requires caution and rationality, and the information provided is for reference only!
There may be delays in the article, and the Wanxiang Communication Group has more detailed and timely strategy sharing. You are welcome to join our circle and participate. Long press to scan the WeChat QR code below. (If you lose WeChat, you can leave a private message on the public account)

免责声明:本文章仅代表作者个人观点,不代表本平台的立场和观点。本文章仅供信息分享,不构成对任何人的任何投资建议。用户与作者之间的任何争议,与本平台无关。如网页中刊载的文章或图片涉及侵权,请提供相关的权利证明和身份证明发送邮件到support@aicoin.com,本平台相关工作人员将会进行核查。


