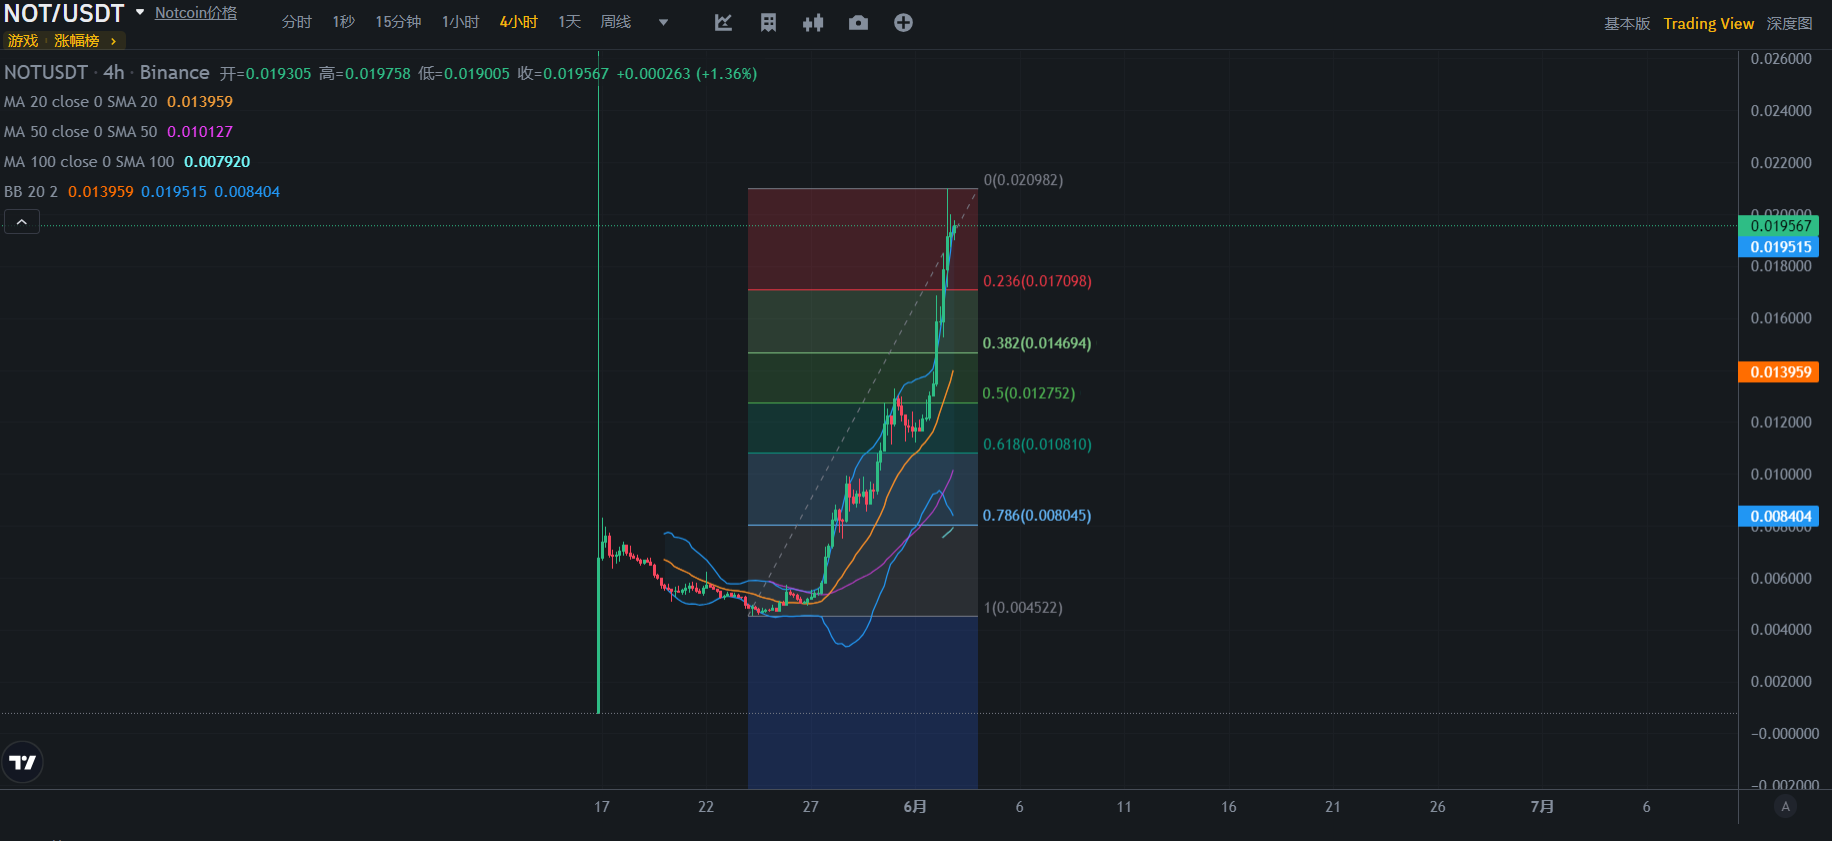
Price and Moving Average (MA)
The current price is $0.019567.
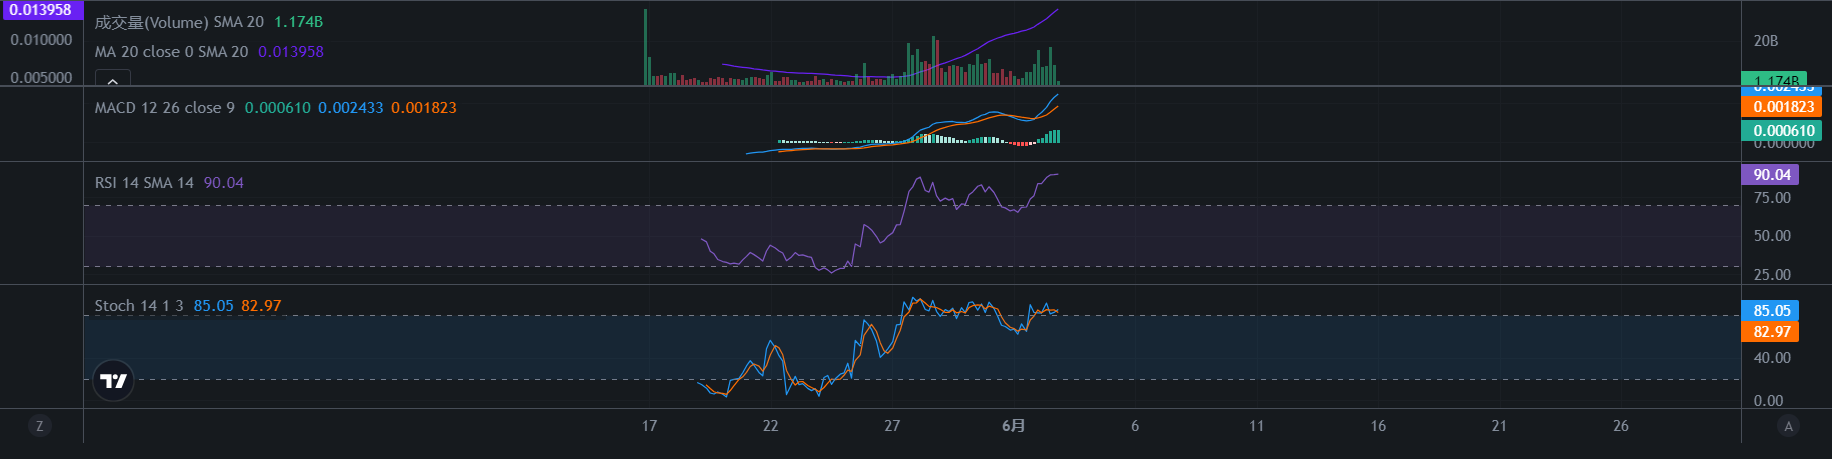
The trading volume has increased recently, with a 20-day average trading volume of 1.174 billion.
MACD:
- The MACD indicator shows some buying signals, with both the MACD line and the signal line above the zero axis, and the MACD line above, indicating some upward momentum.
RSI:
- The RSI indicator is at 90.04, significantly in the overbought zone, indicating potential pressure for a price pullback.
Stochastic Indicator:
- The stochastic indicator is at 85.05 and 82.97, in the overbought zone, also showing potential risk of a pullback.
Fibonacci Retracement
- The Fibonacci retracement shows that the price has broken through the 0.236 level ($0.017098) and is approaching the historical high of $0.02082.
Moving Average
The 20-day moving average is $0.013959, the 50-day moving average is $0.010127, and the 100-day moving average is $0.007920. The price is significantly higher than these moving averages, indicating a strong upward trend.
Bollinger Bands
The price is near the upper band of the Bollinger Bands, indicating strong upward momentum.
Overall View
Possible Short-term Pressure for Pullback: Based on the RSI and KDJ indicators, NOT coin is currently in an overbought state, and a price pullback may occur in the short term.
Strong Upward Trend Continues: The MACD indicator shows upward momentum, and the price is significantly higher than the main moving averages, indicating that the upward trend still exists.
Key Support and Resistance:
Support: $0.017098 (Fibonacci 0.236 retracement level) and the 20-day moving average of $0.013959.
Resistance: Current high of $0.02082.
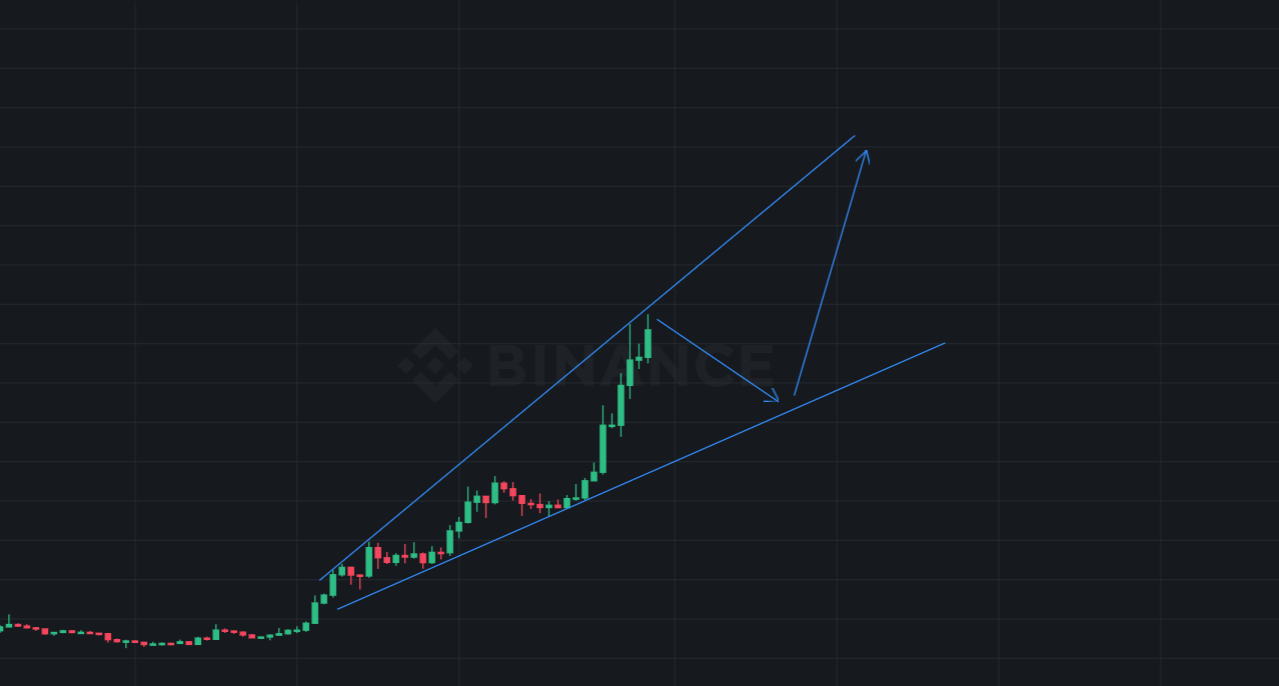
Currently, NOT is in a strong upward trend and is parabolic, with potential short-term pullback risk in the current price, but the overall upward trend remains strong. If you already hold it, you may consider increasing your position when it pulls back to the key support level. Although the uptrend is strong, the associated risk is also high. If you do not hold it yet, it is recommended to wait for the price to pull back before entering to reduce risk.
If you are unsure what to do, join our high-quality community, where we learn and discuss together, analyze positions, direction, portfolio distribution, and select potential coins; international situation, financial trends, daily market analysis; and daily sharing of welfare strategies. Scan the QR code below to enter. 👇

免责声明:本文章仅代表作者个人观点,不代表本平台的立场和观点。本文章仅供信息分享,不构成对任何人的任何投资建议。用户与作者之间的任何争议,与本平台无关。如网页中刊载的文章或图片涉及侵权,请提供相关的权利证明和身份证明发送邮件到support@aicoin.com,本平台相关工作人员将会进行核查。


