BTC/USDT 4-Hour Chart Key Indicator Analysis:
Fibonacci Retracement Levels:
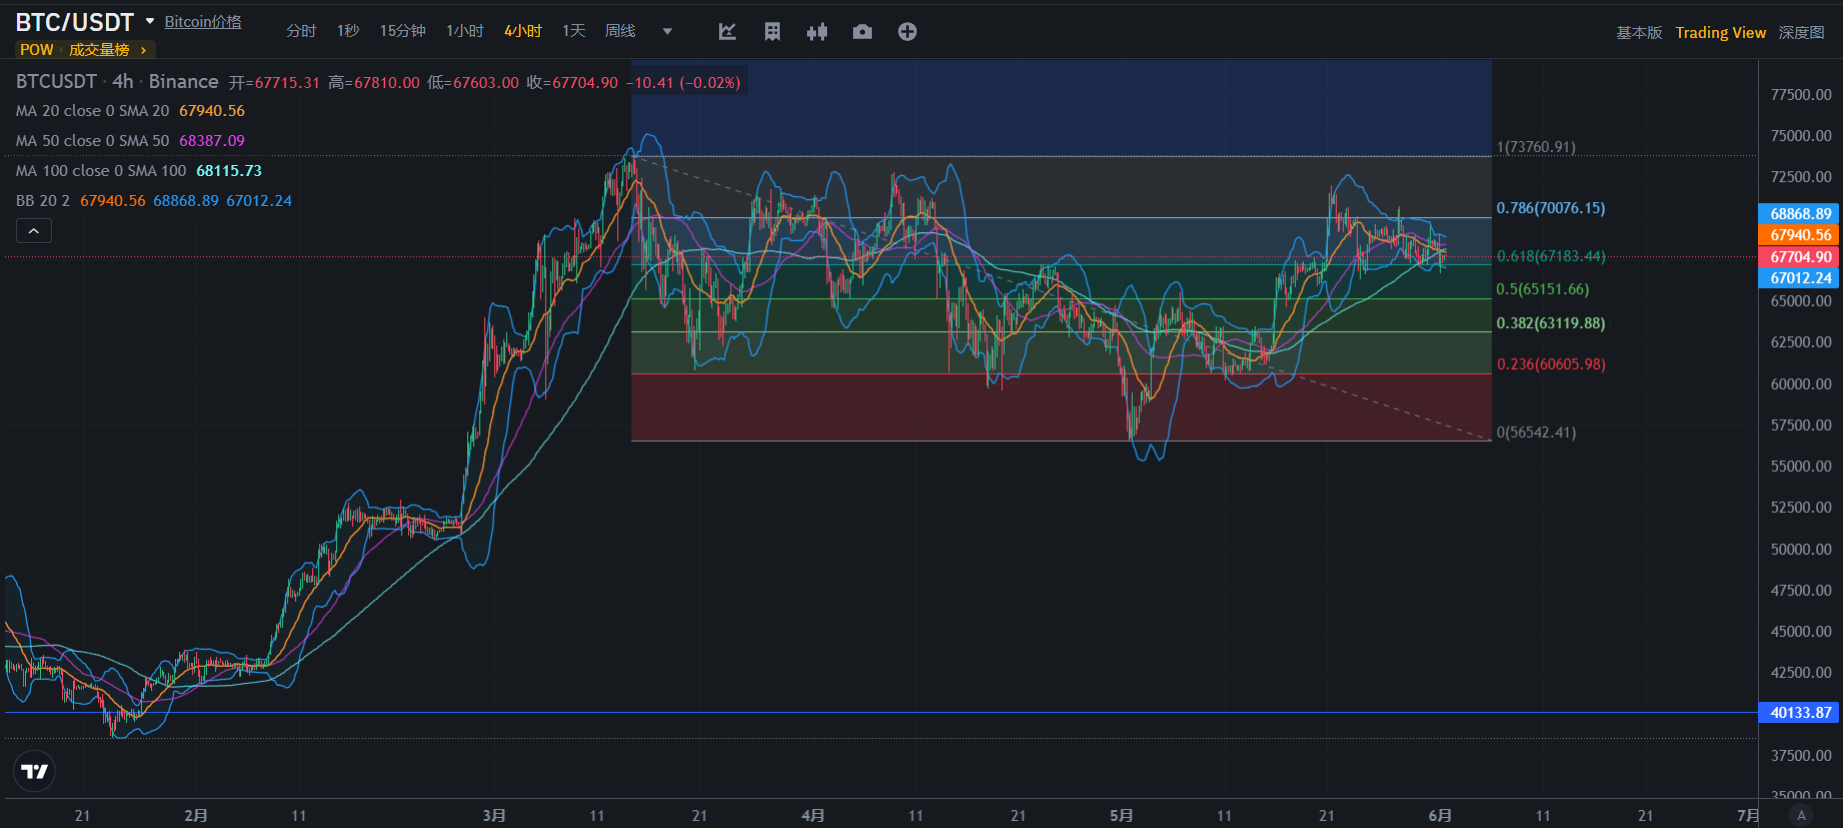
The current price is around 67704.90, near the 61.8% Fibonacci retracement level (67483.44).
Key resistance levels above: 0.786 retracement level (70076.15) and the highest point (73760.91).
Key support levels below: 0.5 retracement level (65151.66), 0.382 retracement level (63119.88), and 0.236 retracement level (60605.98 USDT).
MA:
MA 20 (67940.56): The current price is fluctuating near MA 20, which provides some support to the price.
MA 50 (68387.09): Mid-term trend line, with the price slightly below MA 50, indicating potential resistance in the short term.
MA 100 (68115.73): Medium to long-term trend line, close to the current price.
Bollinger Bands:
The price is fluctuating near the middle Bollinger Band, indicating relatively stable market conditions in the short term without a clear directional breakthrough.
The upper and lower Bollinger Bands are 68868.89 and 67012.24, respectively, suggesting that the price may fluctuate within this range in the short term.
Volume:
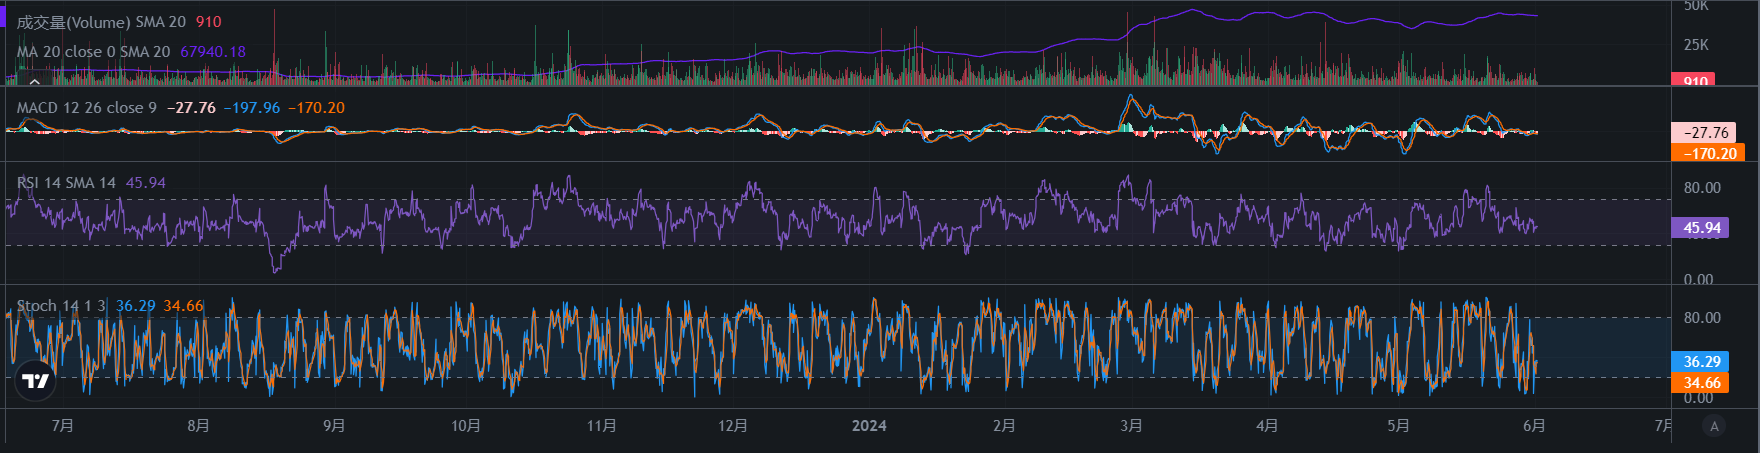
- The 20-period Simple Moving Average (SMA) of the volume is 910, indicating relatively stable recent volume without a clear trend of increasing or decreasing volume.
MACD:
Both the MACD line and the signal line are below the zero axis, indicating that the market is still in a weak position.
The MACD line (-27.76) is slightly higher than the signal line (-170.20), potentially indicating a short-term rebound signal.
RSI:
The current RSI is 45.94, in the neutral zone, without overbought or oversold signals.
The RSI trend is relatively stable, indicating neutral market sentiment.
KDJ:
- The K value is 36.29, the D value is 34.66, both below the oversold zone, suggesting the possibility of a rebound.
Short-term Trend:
The current price is finding support near the 61.8% Fibonacci retracement level (67483.44), indicating potential oscillation near this level in the short term.
If the price can break through MA 20 and MA 50 (67940.56 and 68387.09), it may continue to test the 0.786 retracement level (70076.15).
Mid-term Trend:
- If the price fails to break through MA 50, it may continue to decline to test the 0.5 retracement level (65151.66) and the 0.382 retracement level (63119.88).
Long-term Trend:
- Both MACD and RSI indicate relatively neutral market sentiment, without clear signals of upward or downward movement. Changes in volume, whether increasing or decreasing, may indicate the future direction of prices.
Key Price Levels
Support Levels:
67483.44 (61.8% Fibonacci retracement level)
65151.66 (Fibonacci 0.5 retracement level)
63119.88 (Fibonacci 0.382 retracement level)
Resistance Levels:
67940.56 (MA 20)
68387.09 (MA 50)
70076.15 (Fibonacci 0.786 retracement level)
Bullish Strategy:
If the price can break through and hold above MA 50 and MA 100, consider entering above MA 50, with target prices at 70076.15 and 73760.91.
Set the stop-loss below the Fibonacci 50% retracement level (65151.66).
Bearish Strategy:
If the price fails to break through MA 50 and begins to decline, consider entering below MA 50, with target prices at 65151.66 and 63119.88.
Set the stop-loss above MA 50.
On-chain data shows a large outflow of stablecoins from exchanges and a large inflow of BTC into exchanges, indicating low trading sentiment, as if everyone is waiting for an opportunity.
The main concerns are the MtGox incident and war conflicts; the release of "Mentougou" could bring a serious crisis to BTC, with strong odors of "Big Mao" and "North Y" gunpowder, and the situation in the South China Sea is also shrouded in mist.
If there are no black swan events over the weekend, there may be a small rebound. There is no need to panic too much; just operate within the Fibonacci oscillation range around 618.
In summary, the current market trading sentiment is relatively neutral, with major funds taking a wait-and-see attitude. It is necessary to closely monitor the key support and resistance levels, as well as changes in volume, to determine the future price trend.
At the same time, I wish everyone a happy Children's Day!
Having been in the cryptocurrency circle for many years, I am sharing my experience and strategies.
If you are unsure about what to do, join the community to learn and discuss together, covering price levels, market directions, position distribution, and selecting potential coins to broaden your perspective!
🔍Public Z: "The Elephant on the Sloping Neck"
免责声明:本文章仅代表作者个人观点,不代表本平台的立场和观点。本文章仅供信息分享,不构成对任何人的任何投资建议。用户与作者之间的任何争议,与本平台无关。如网页中刊载的文章或图片涉及侵权,请提供相关的权利证明和身份证明发送邮件到support@aicoin.com,本平台相关工作人员将会进行核查。


