In terms of the market, as mentioned in the article on Monday, both BTC and ETH are currently oscillating within a 30-minute level range.
What does "中枢震荡" mean? In simple terms, it means that both long and short sides have divergent opinions on the current price, causing fluctuations within a certain price range. The fluctuation process is essentially the continuous consumption of short positions by long positions or the continuous consumption of long positions by short positions. When one side's strength is exhausted by the other side after a certain period of oscillation, the victorious side will leave this range. The longer the oscillation, the greater the strength, which is known as "the longer the horizontal, the higher the firmness."
"中枢震荡" is actually similar to the concept of building a platform in Western technical analysis, but there are essential differences. The "中枢震荡" strategy in the "缠论" technique can be very efficient in conducting corresponding buying and selling operations through the internal structure of the central axis and trend types, using the central axis as the trading coordinate to make short-term profits and continuously absorb the blood of the market manipulators.
There are two important principles to remember in the "中枢震荡" strategy:
- Sell on the divergence above the central axis at the secondary level.
- Buy on the divergence below the central axis at the secondary level.
It is also crucial to adhere to the most important trading rule:
Do not go long above the central axis without the third buy signal, and do not go short below the central axis without the third sell signal!
This rule can maximize the avoidance of the common behavior of novices chasing highs and killing lows.
If you are interested in a detailed understanding of the application of the central axis and the "中枢震荡" strategy, you can refer to the article "Practical Application of the Dragon Slaying Knife in the "缠论" - Central Axis Oscillation Strategy" published on January 15, 2022, on this account.
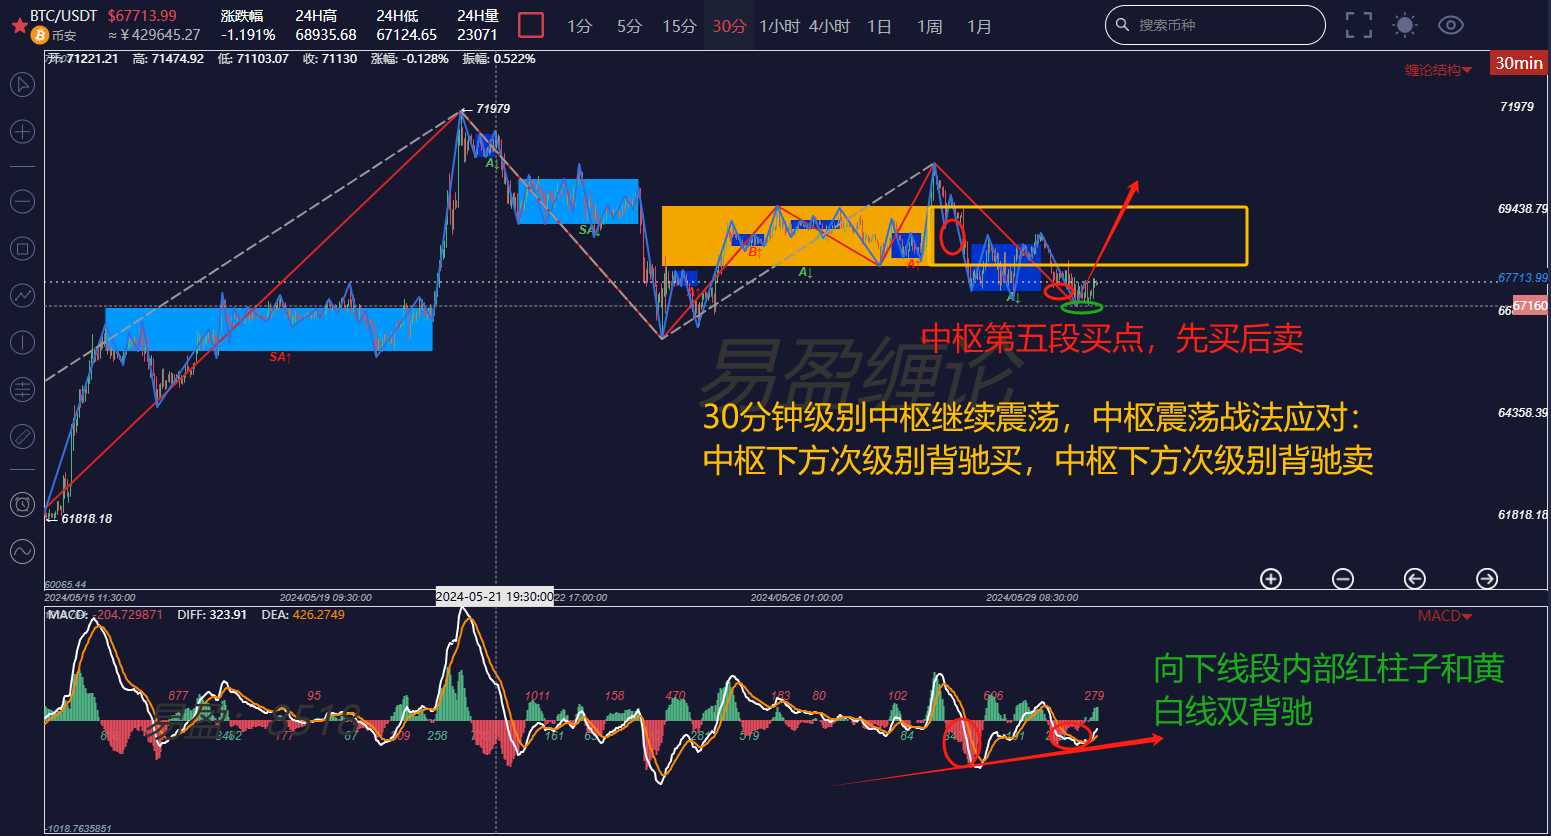
Looking at the 30-minute chart of Bitcoin, the yellow box in the image represents the central axis range. The current price is below the central axis, and there is a secondary level divergence within the downward line segment, with both red columns and the yellow-white line showing divergence. This meets the requirements of the "中枢震荡" strategy. You can use the secondary level buy signals of the 5-minute level to gradually enter the market, with the expectation of an upward movement in the 30-minute level. When this upward movement reaches the upper range of the central axis and there is another secondary level divergence internally, you can reduce your position.
In this way, we will increase our chips and lower our average buying price. Continuously conduct short-term profit-taking procedures in a major upward trend until a selling point appears at the daily level, and then gradually hand over our chips to the buyers, letting all the hot air go to hell!
If you are interested in "缠论" and want to obtain learning materials for free, watch public live broadcasts, participate in offline "缠论" training camps, improve your trading skills, build your own trading system to achieve stable profitability, and use "缠论" techniques to timely escape the market peaks and buy the dips, you can scan the QR code to follow the public account, privately message to obtain and add the WeChat account of this account to join the study group!

免责声明:本文章仅代表作者个人观点,不代表本平台的立场和观点。本文章仅供信息分享,不构成对任何人的任何投资建议。用户与作者之间的任何争议,与本平台无关。如网页中刊载的文章或图片涉及侵权,请提供相关的权利证明和身份证明发送邮件到support@aicoin.com,本平台相关工作人员将会进行核查。


