On the evening of May 21st, AICoin researcher conducted a live graphic and text sharing on the "EMA Bullish Arrangement Strategy (with Membership)" in the AICoin PC-end Group Chat Live. Below is a summary of the live content.
I. EMA Strategy Sharing
1. Principle Analysis
This principle uses six lines: EMA10, 20, 40, 60, 120, 250, representing different views of funds for different trading periods. 10 and 20 are for short-term operations; 40 and 60 are for medium-term operations; 120 and 250 are for long-term operations. In other words, when the trend framework and short-term operations are consistent, enter the market. When the short-term operations and trend framework are inconsistent, exit the market.
In summary, when the market view is consistent and there is a consensus for an uptrend, enter the market. When there is a discrepancy between the long-term and short-term market views, exit the market and wait for the next consensus to form.
2. Indicator Illustration
Taking the indicator of BTC as an example, a consensus was first formed on May 14th.
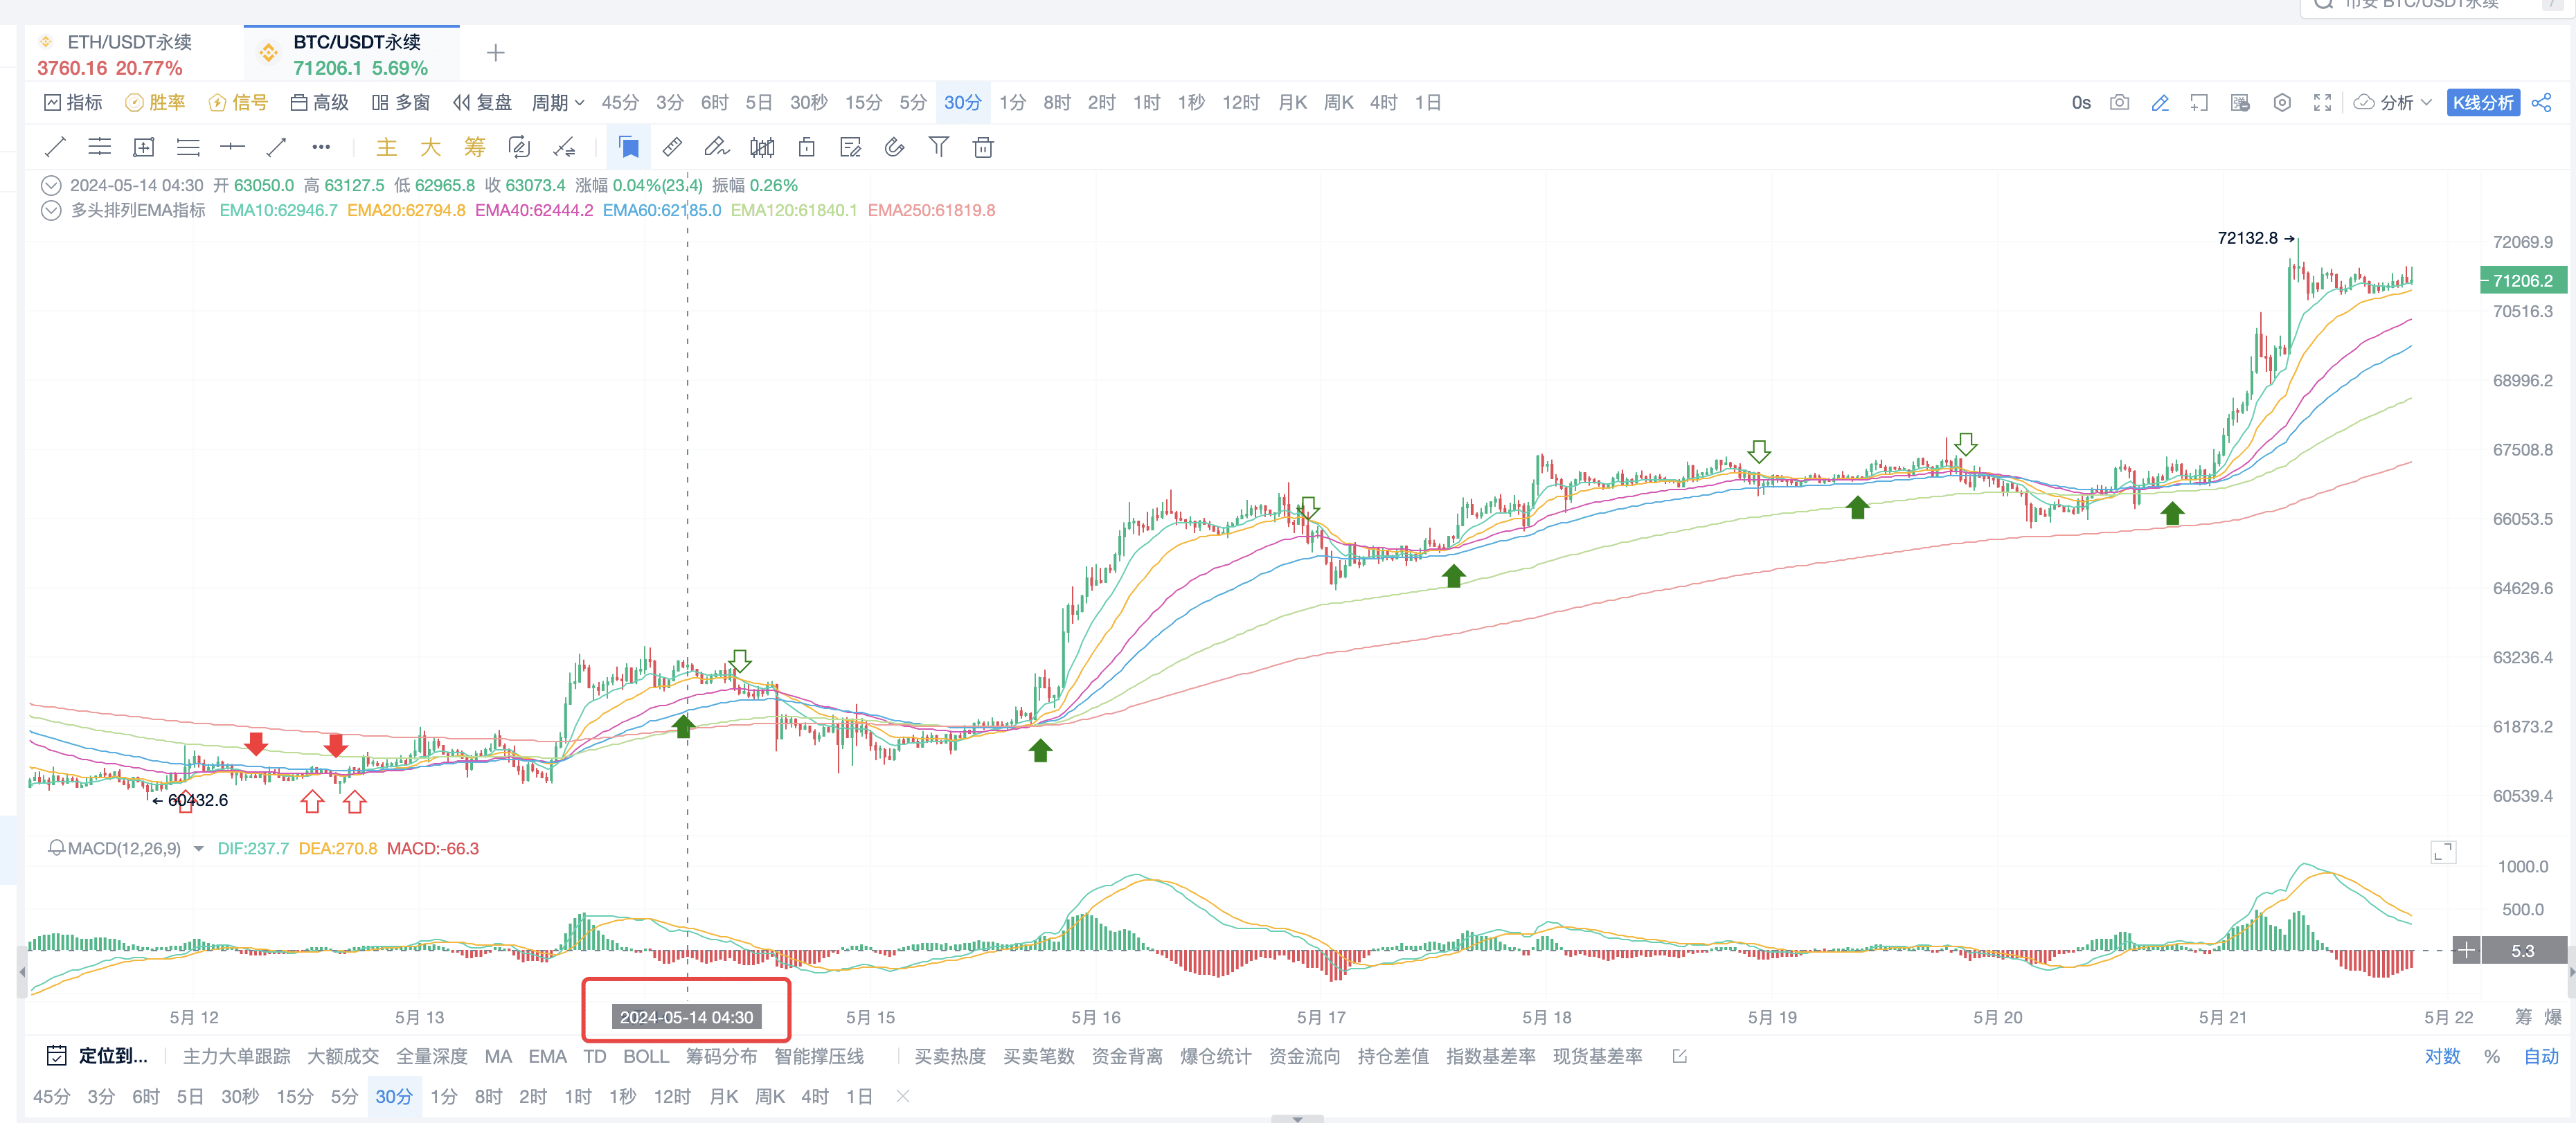
At this point, a long entry signal appeared, but after a brief upward movement, the short-term indicator turned around, creating a discrepancy.
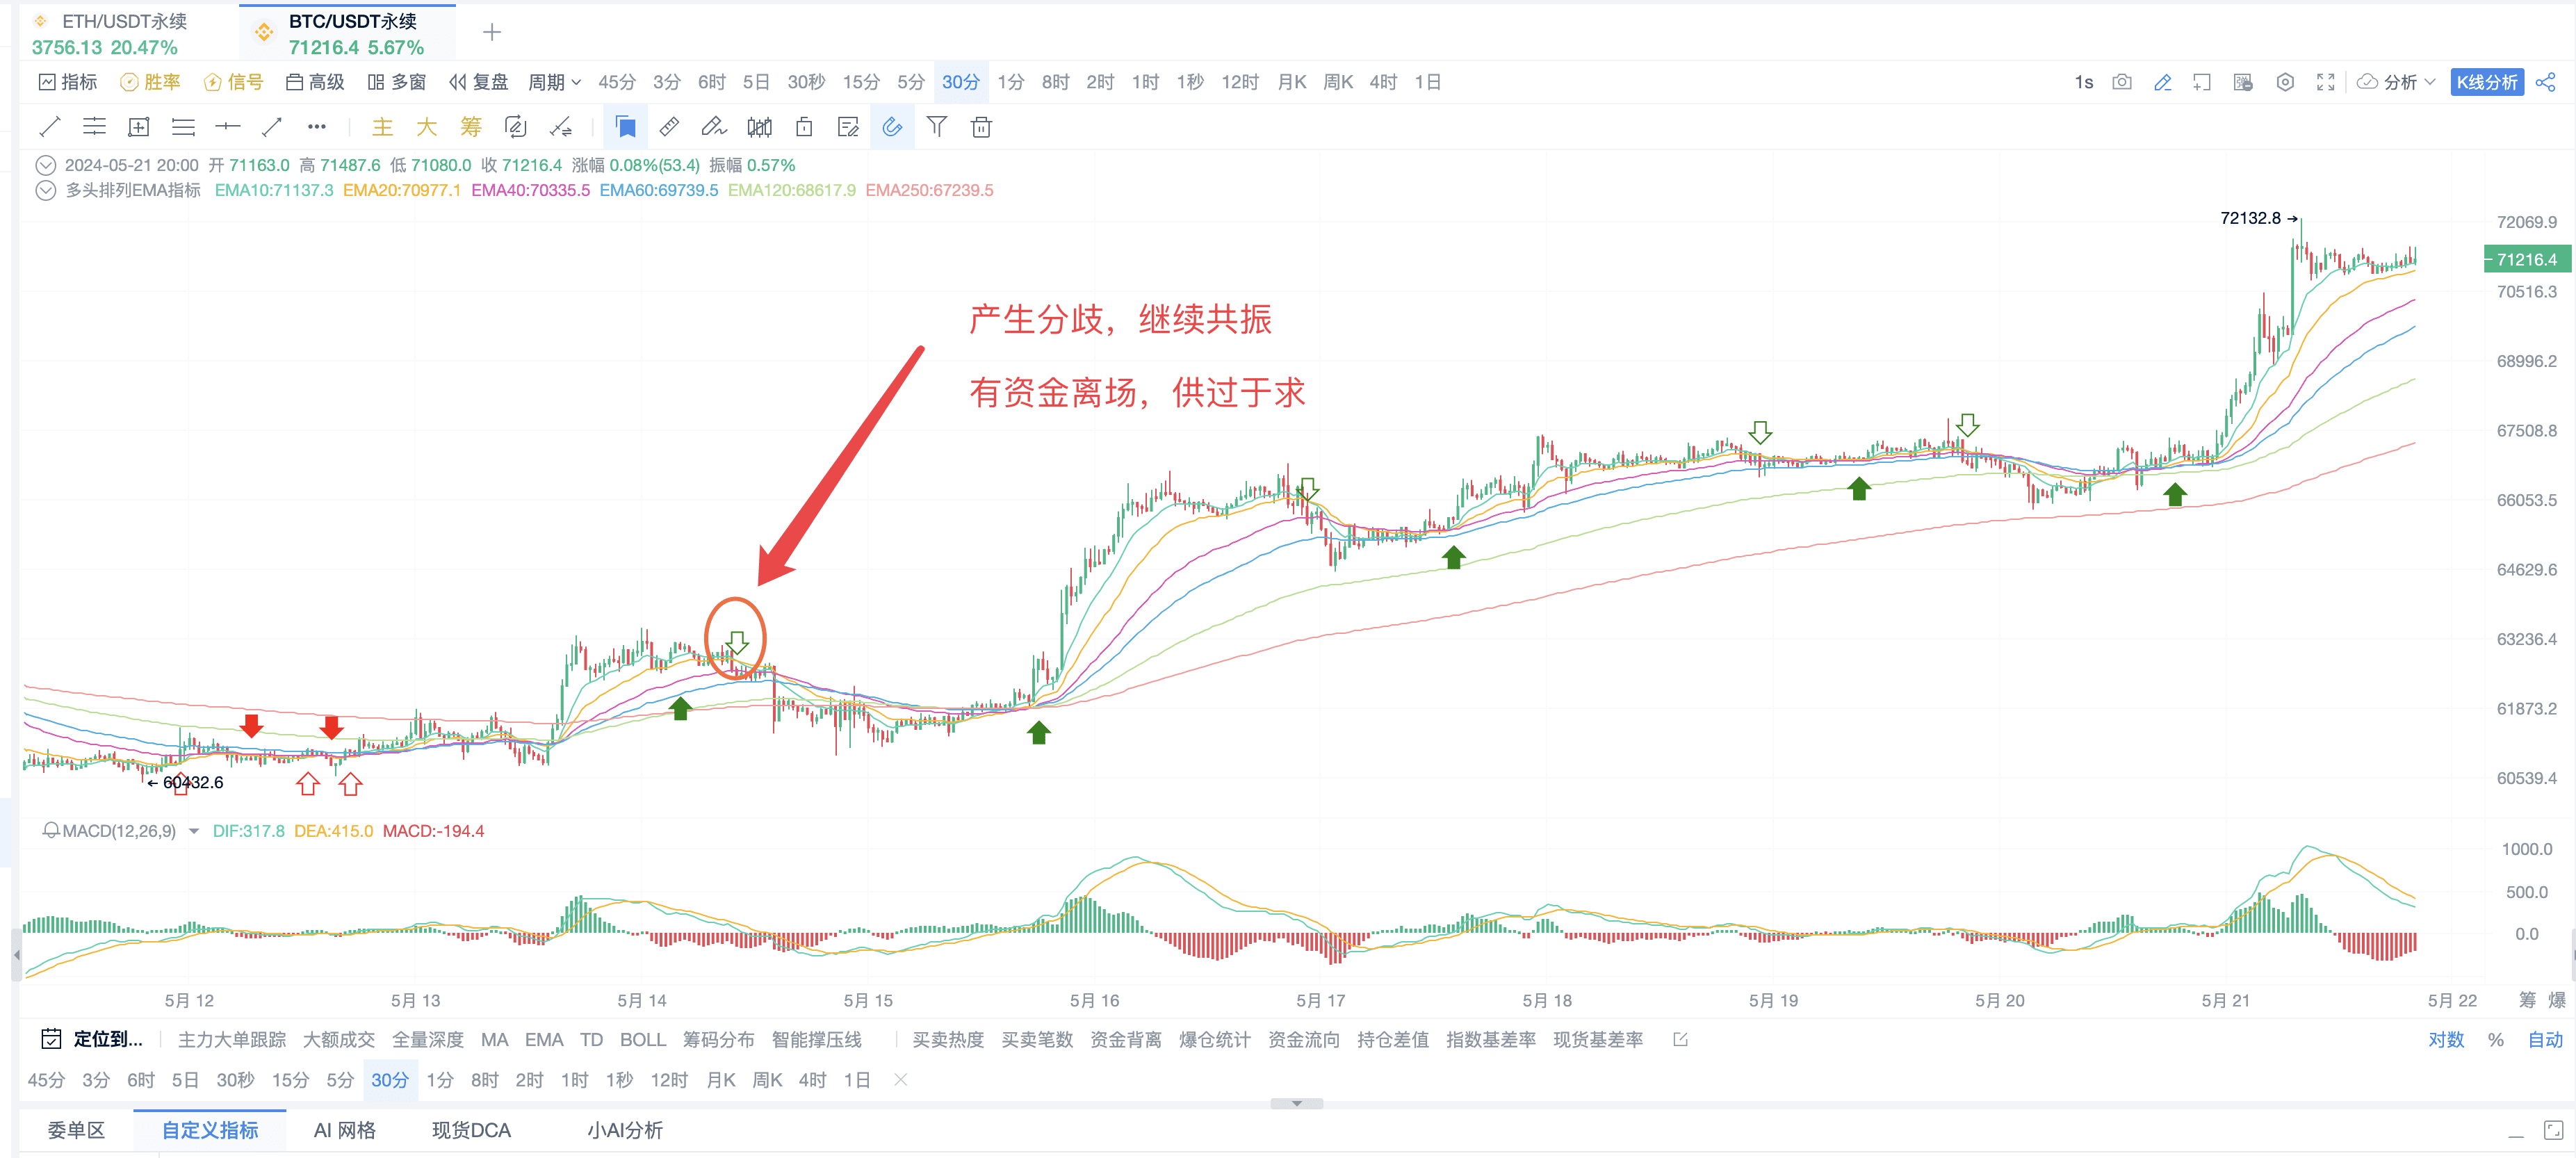
This is the point of discrepancy, where funds start to exit, leading to an oversupply situation and a price pullback, signaling an exit. No profit was made here because this trend was quickly extinguished.
The next consensus occurred at this time.
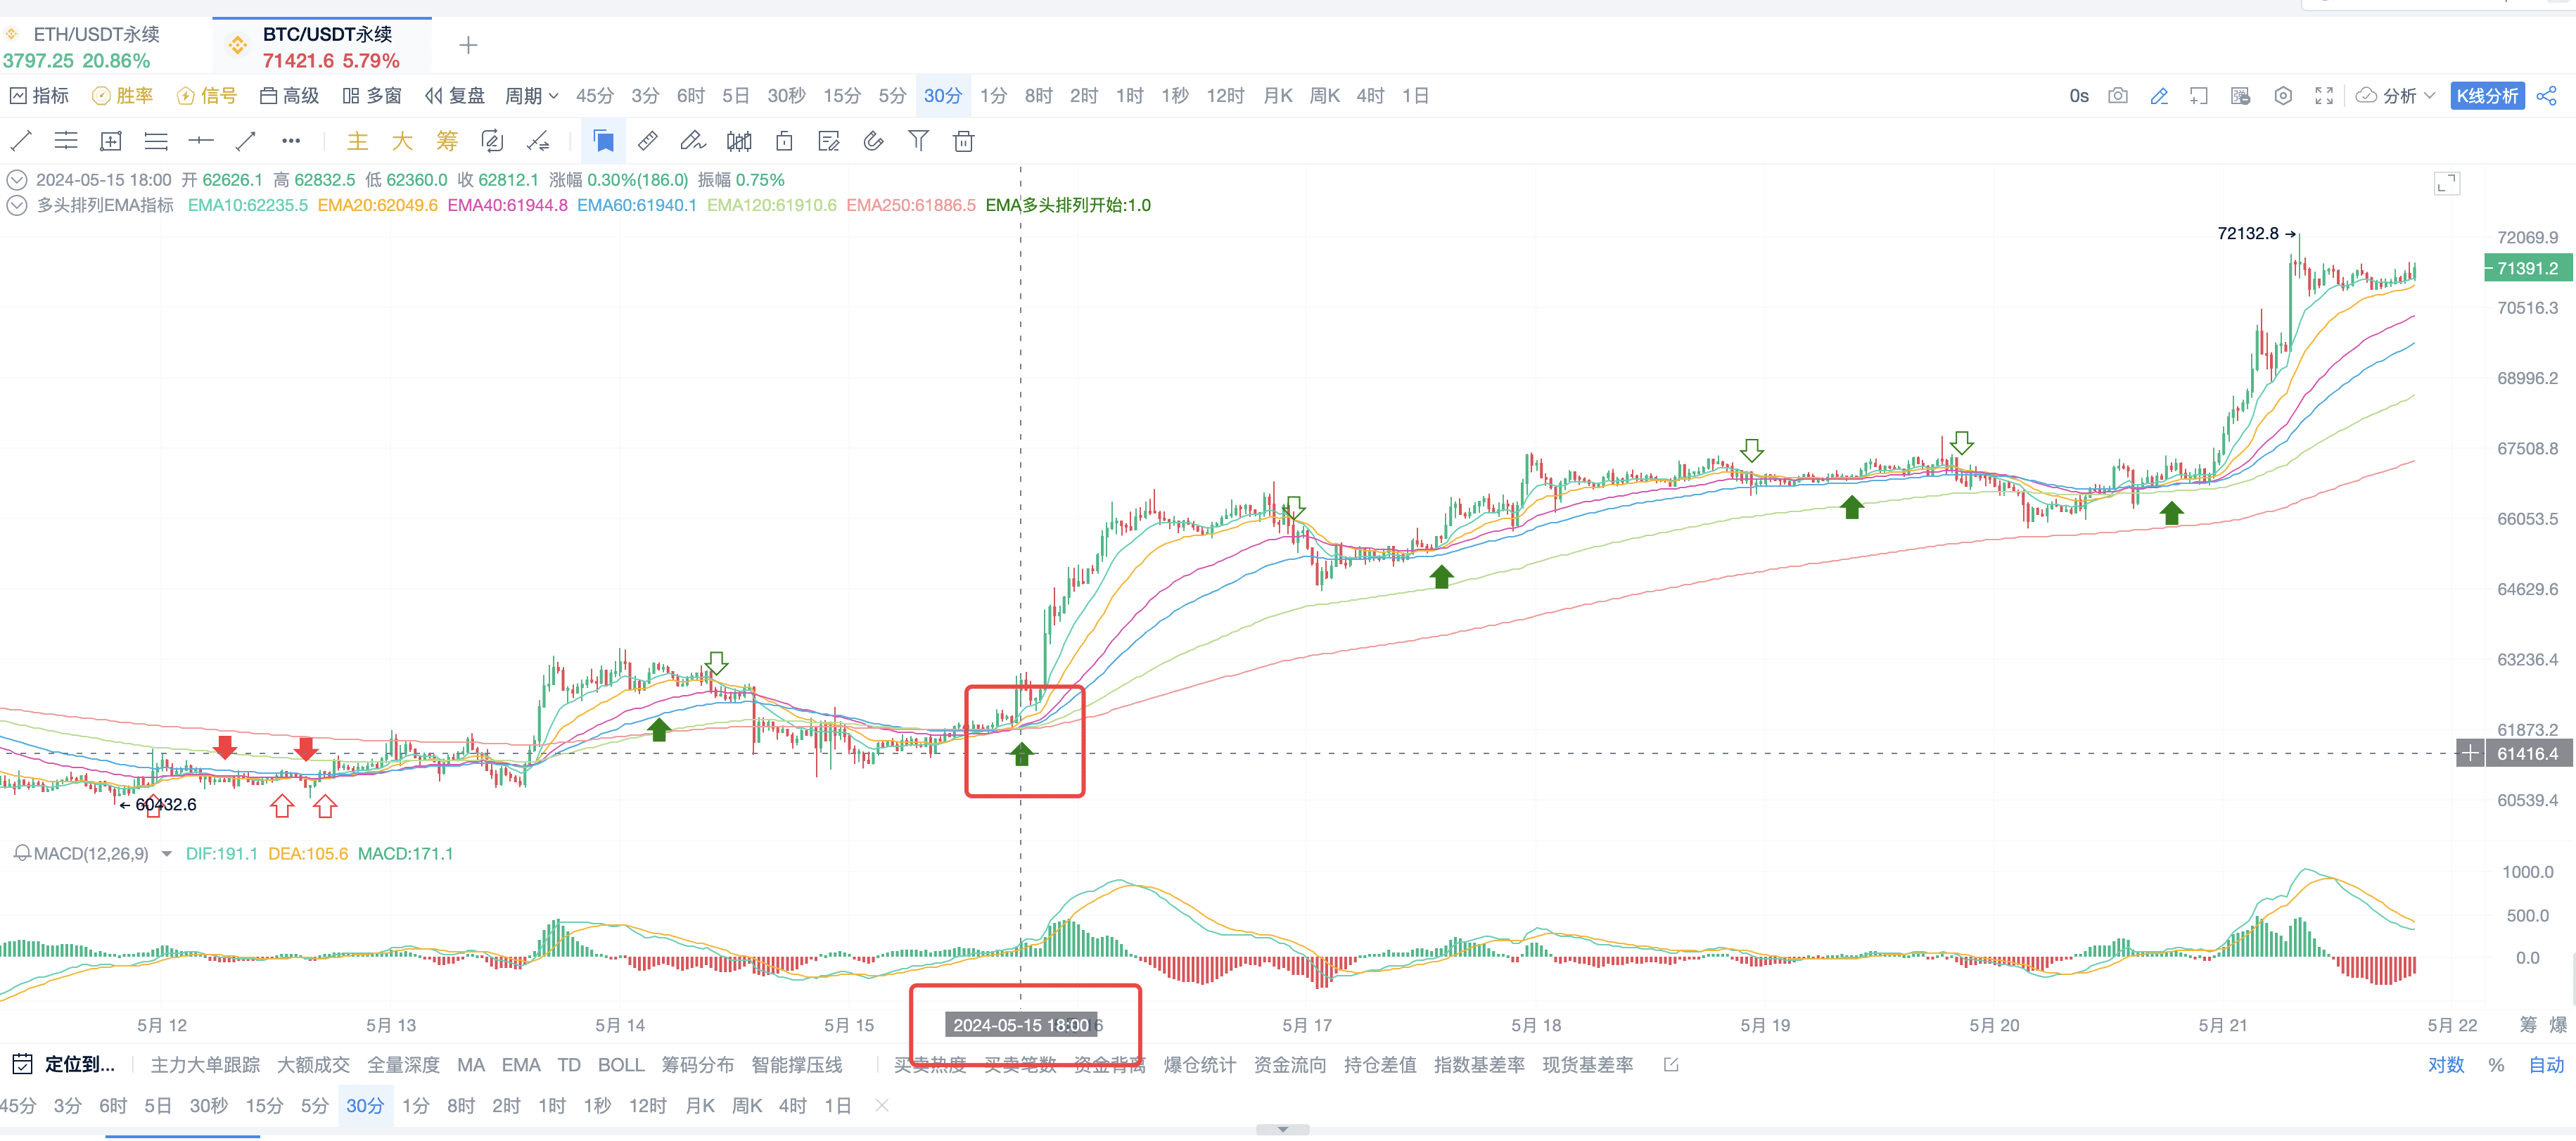
Both short-term and long-term funds turned bullish after a pullback, resulting in a short-term uptrend!
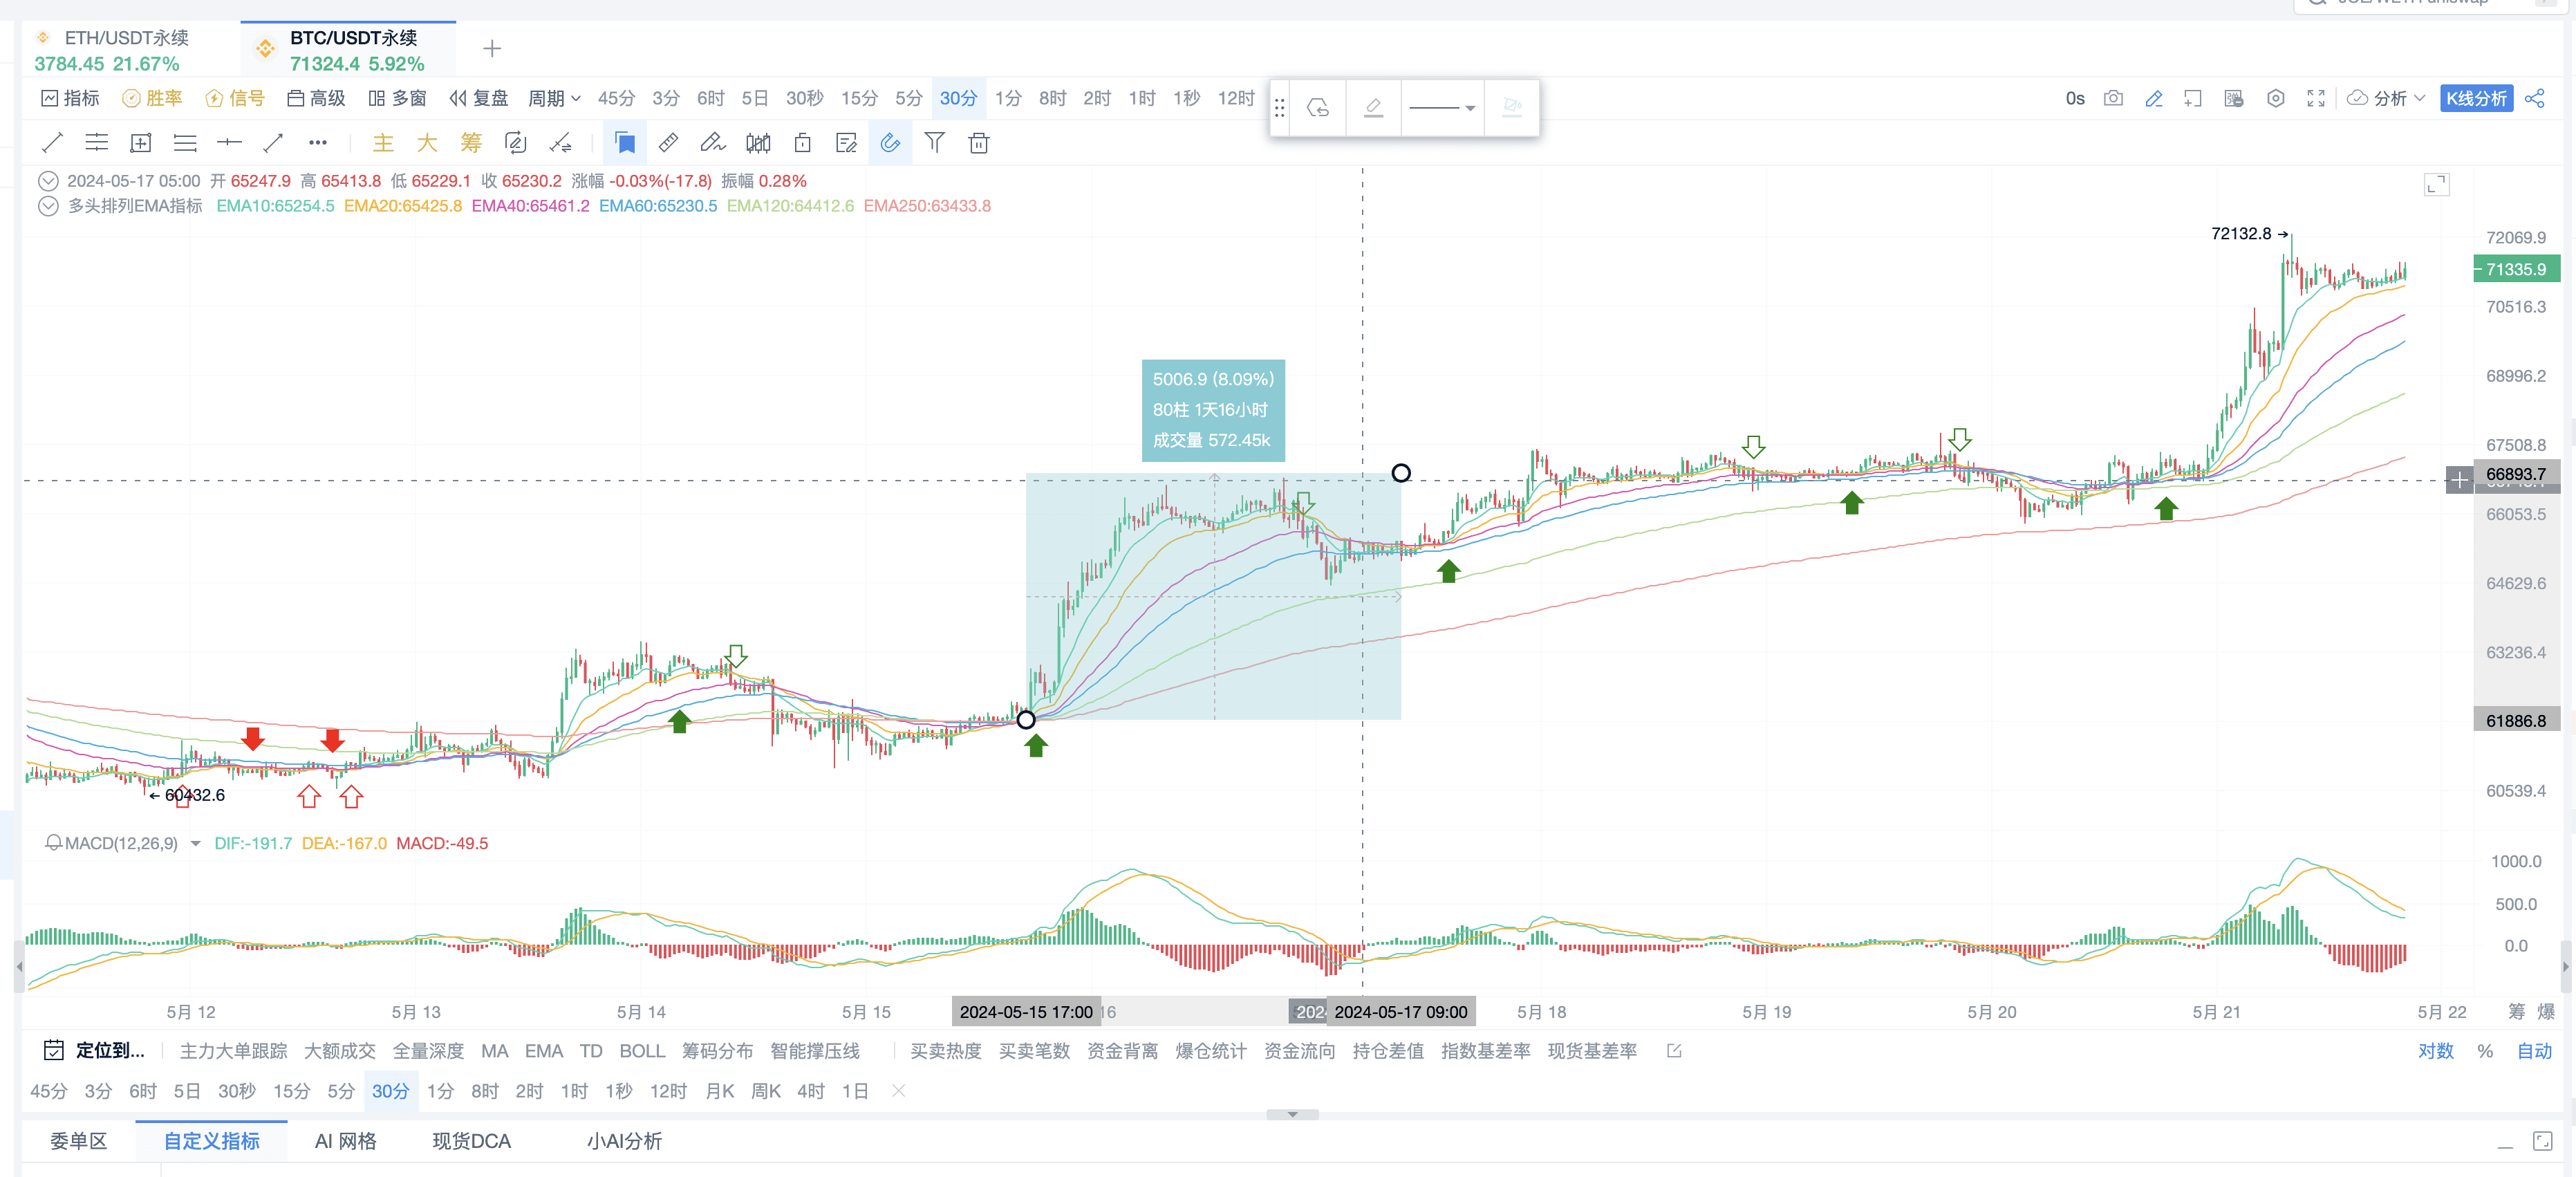
The situation of undersupply continued until a day later, when a discrepancy occurred. According to our criteria, when a discrepancy occurs, we anticipate fund outflows, so we also need to exit.
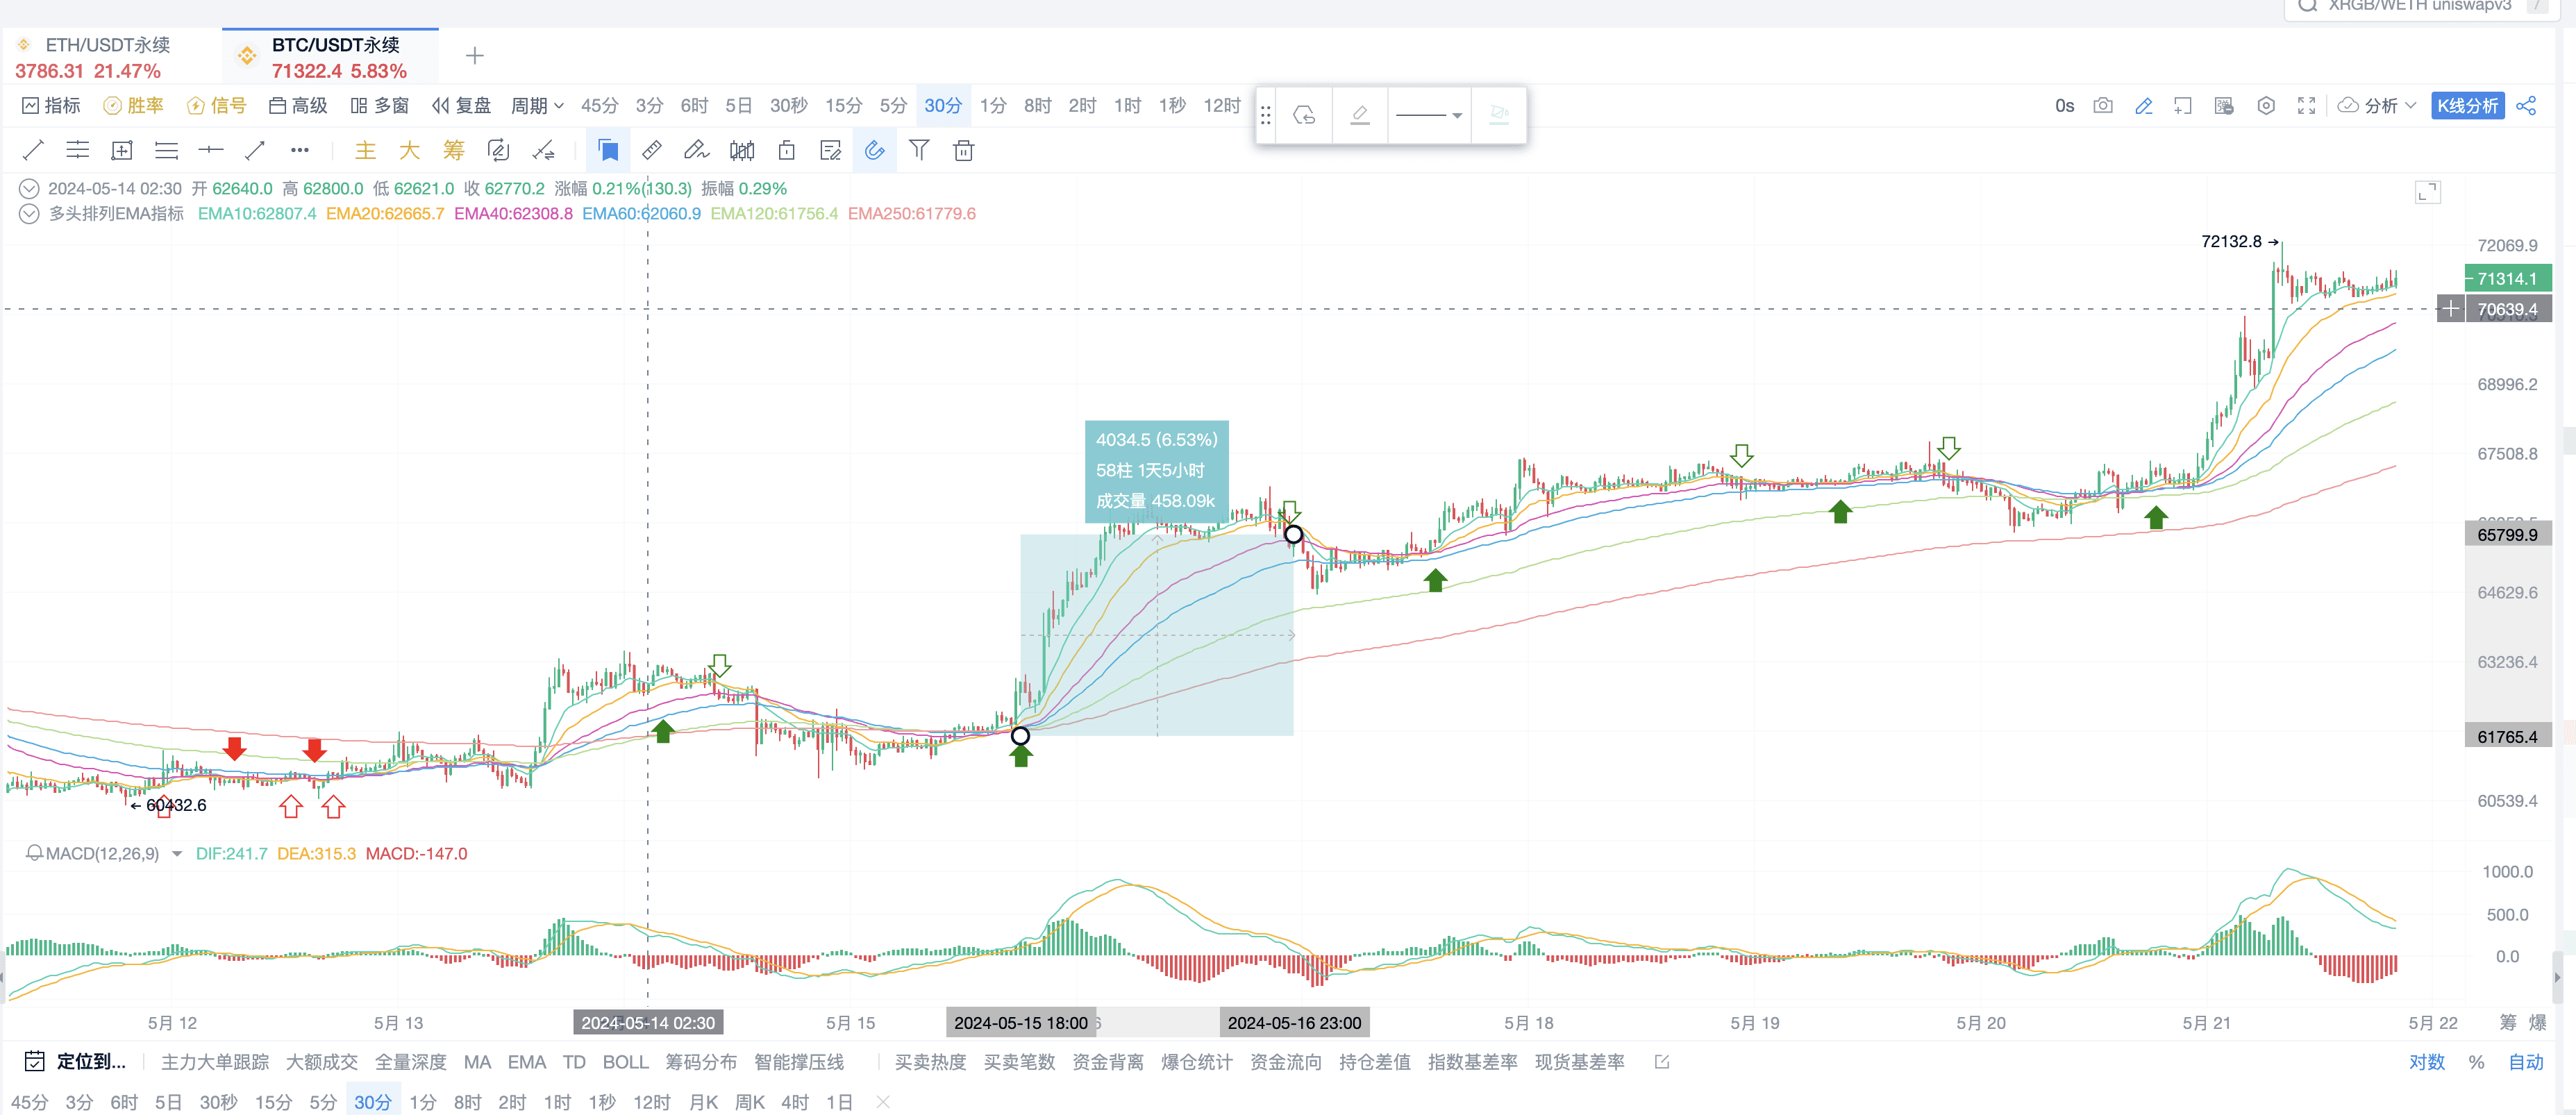
Based on this indicator, if trading spot, there would be a profit of 6 points at this point, and if trading futures, the multiple returns can be calculated.
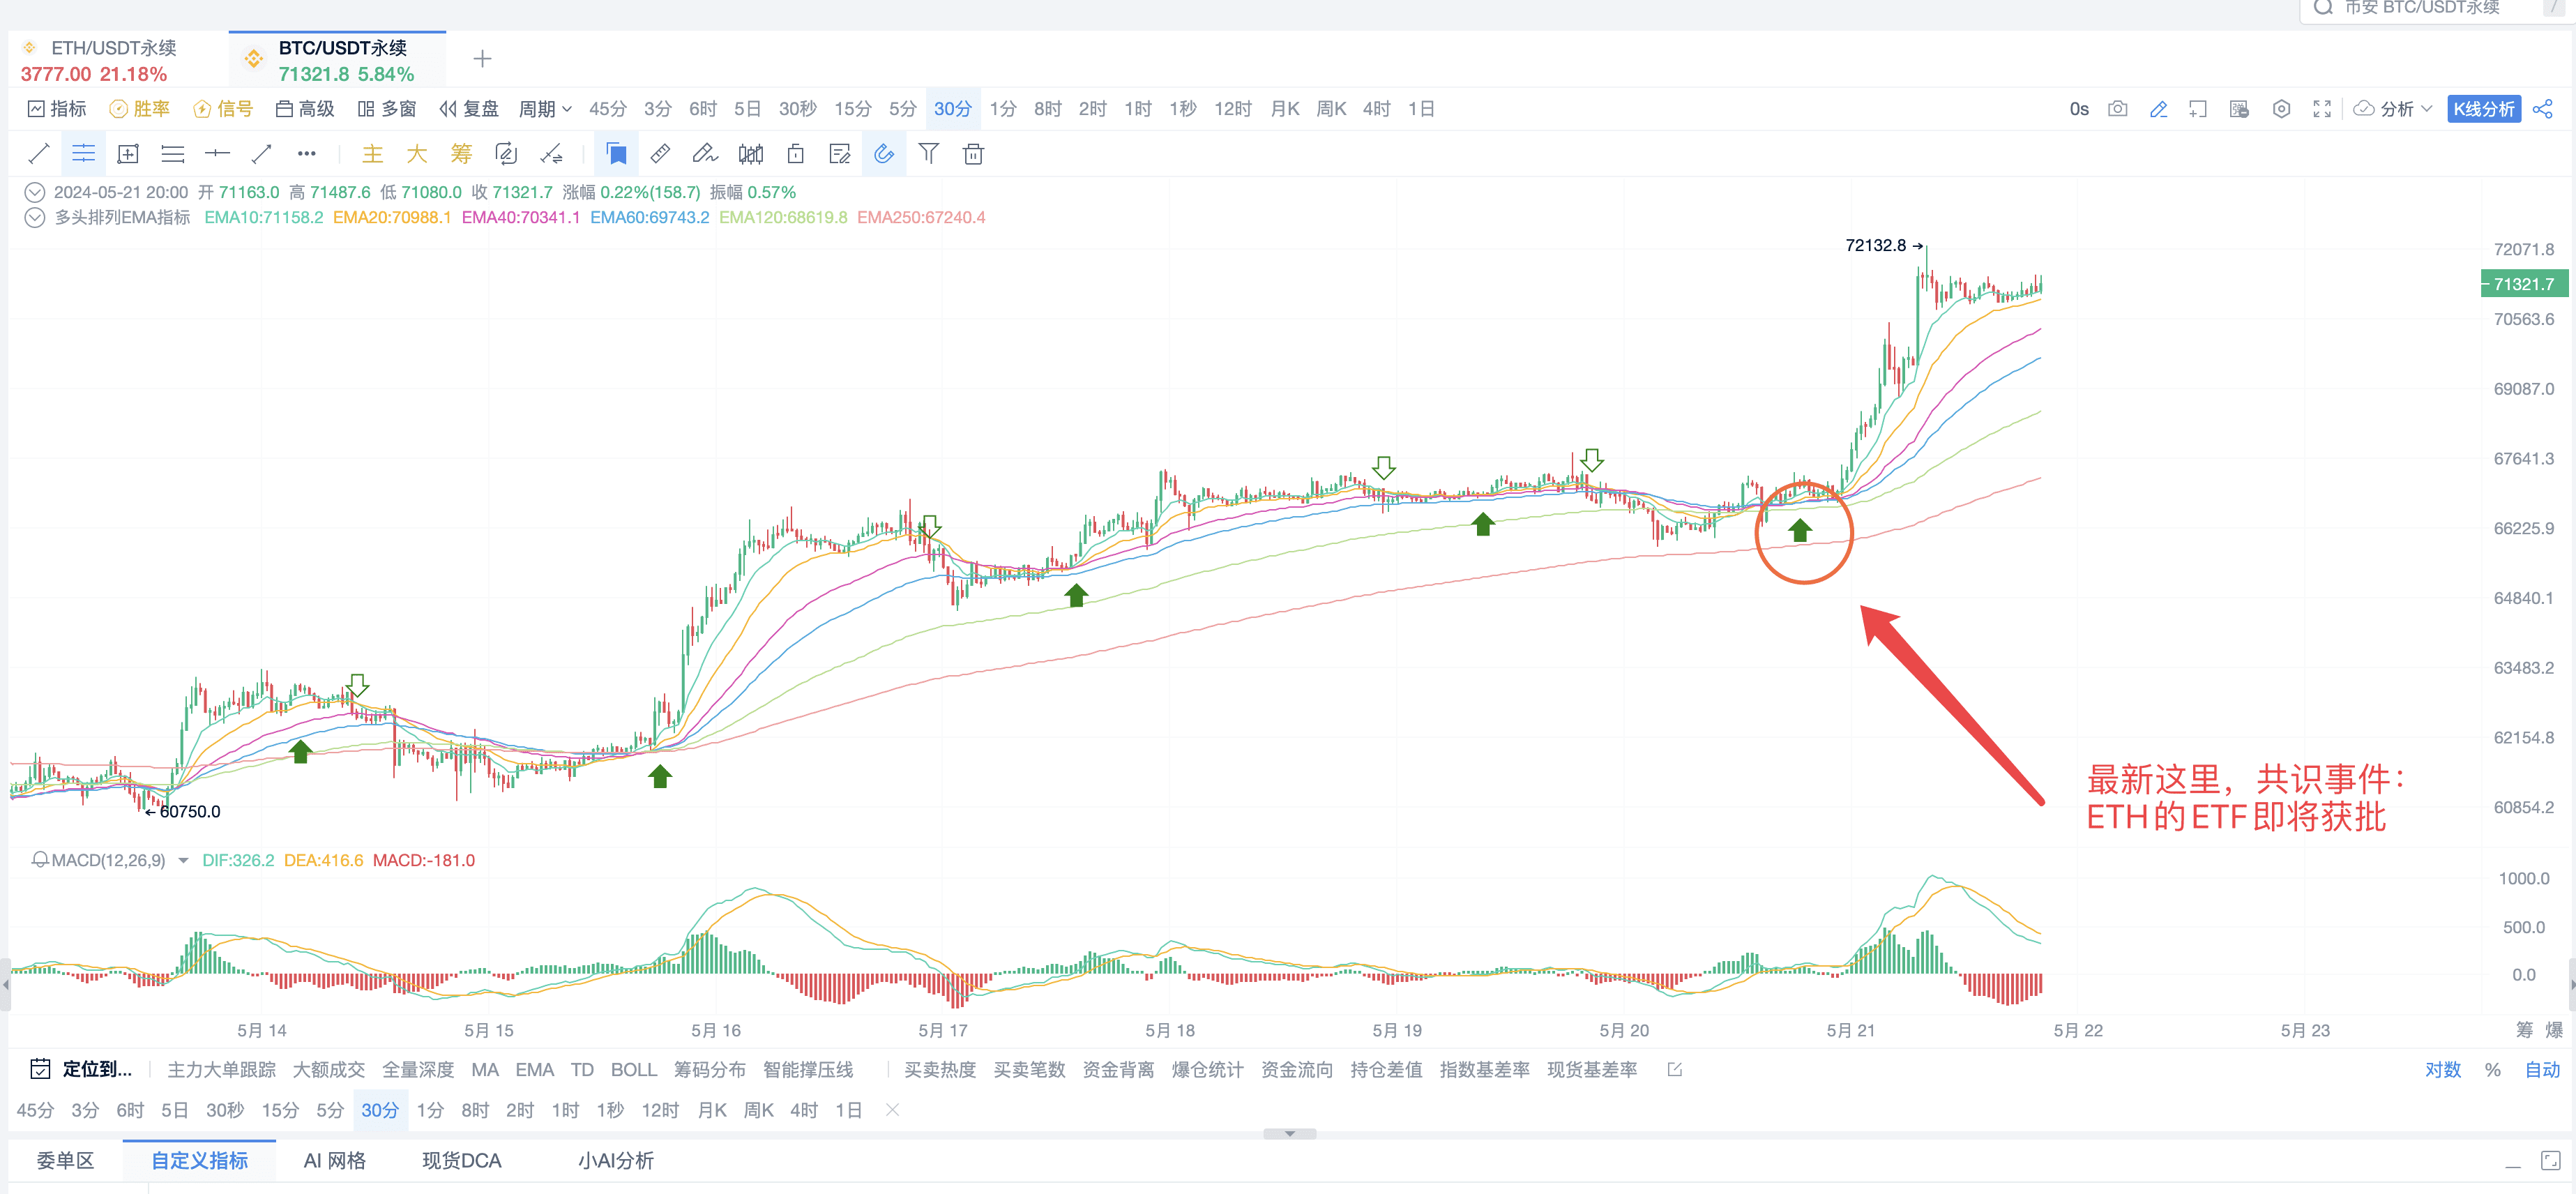
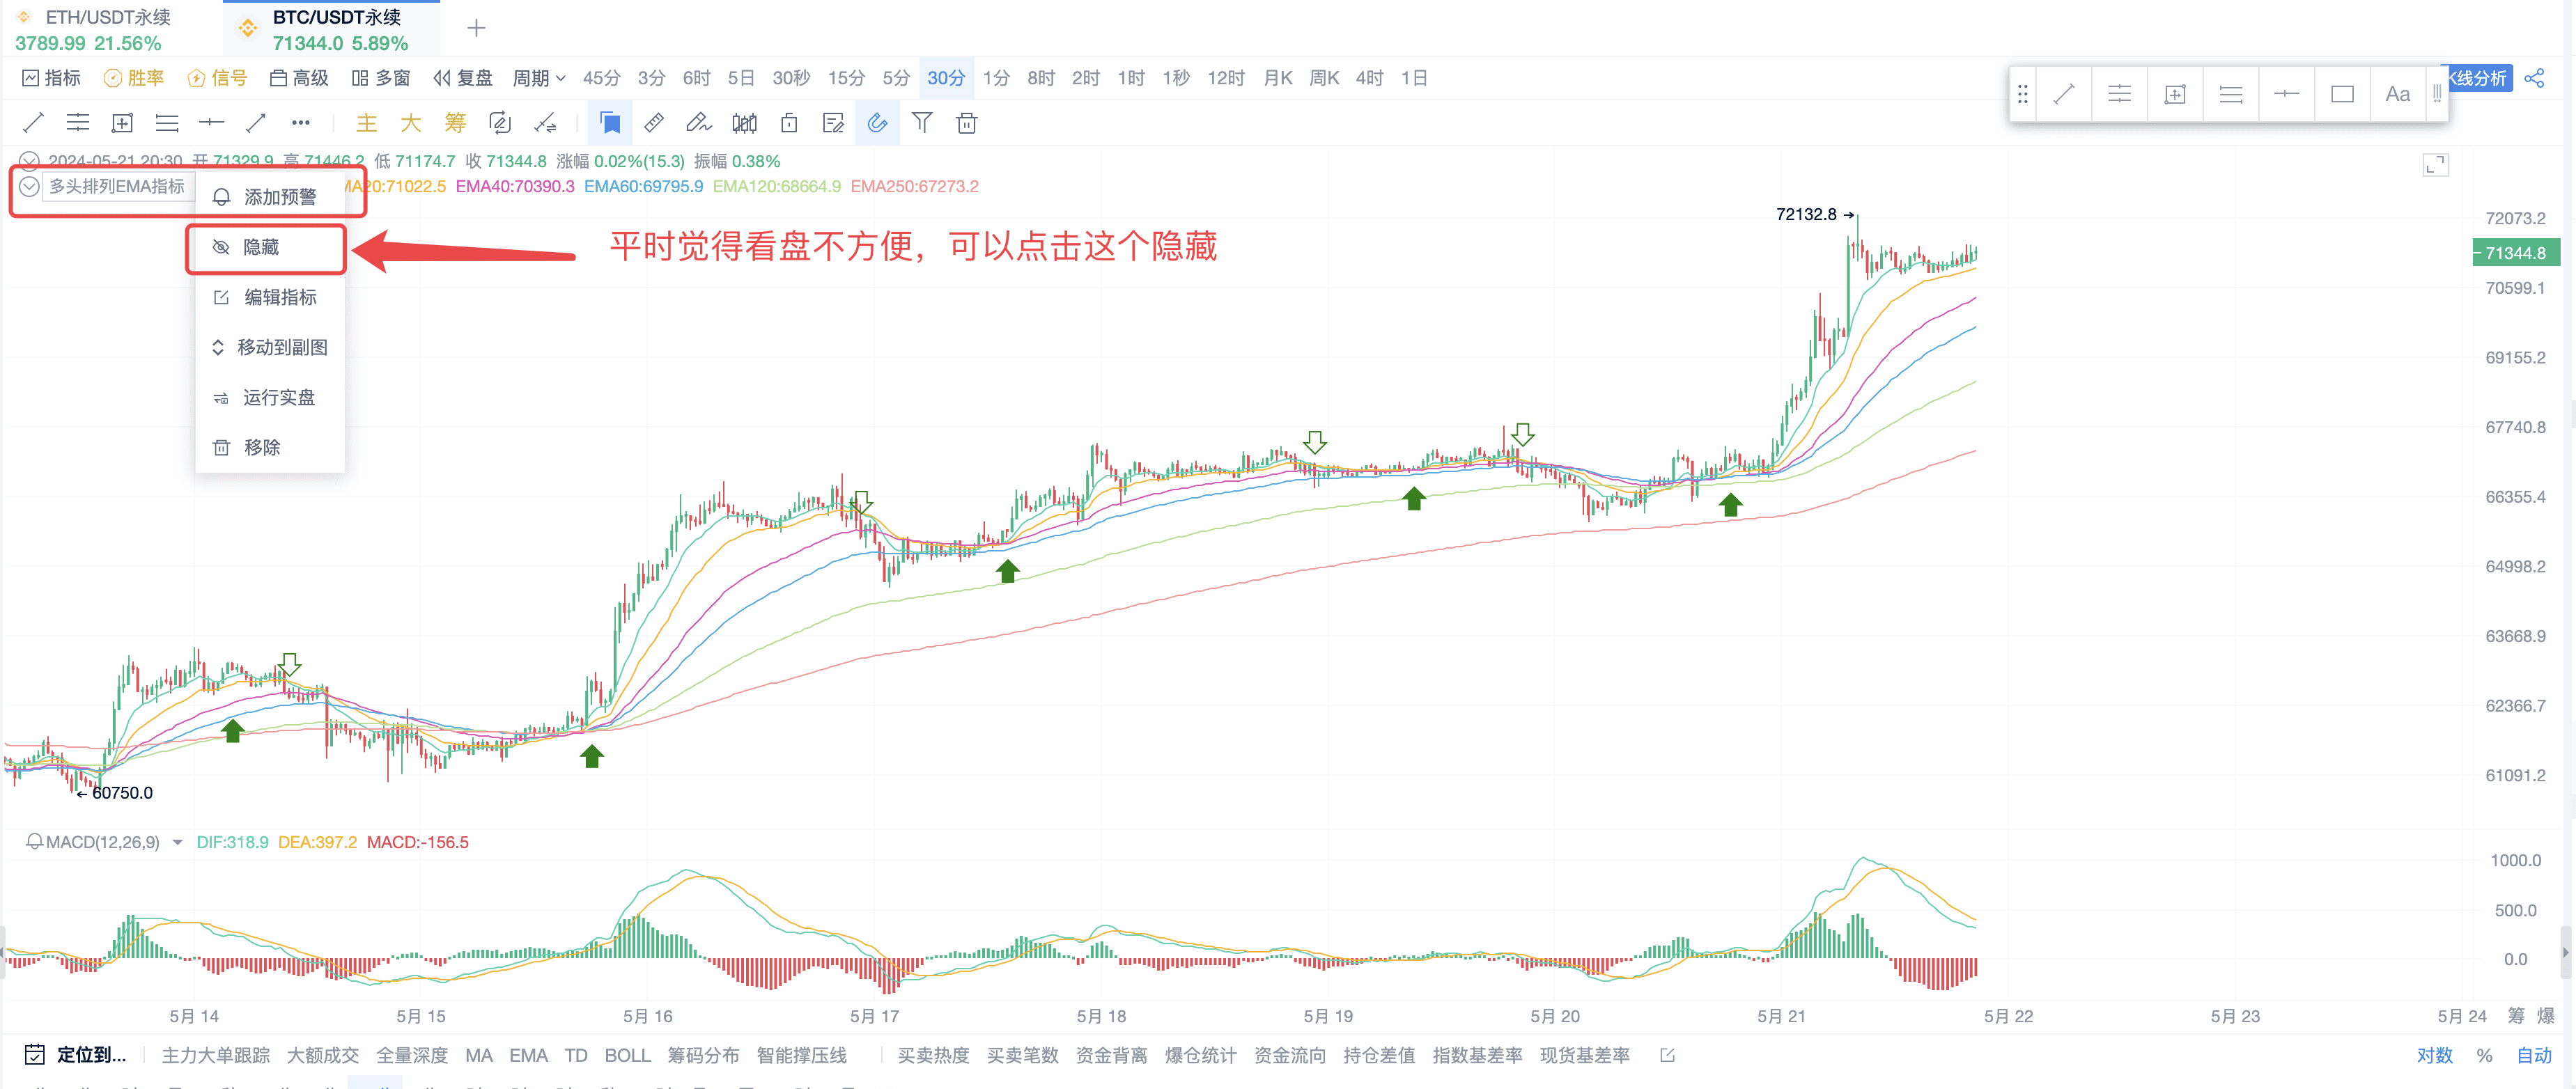
Looking at the latest signal, new consensus started to form around these time points. As retail investors, it's best to return to the indicators because the essence of all events, fundamentals, and capital is ultimately about trading, and it will ultimately return to buying and selling. As retail investors, we can use candlesticks and indicators to gauge market consensus and find the most accurate entry points for trading.
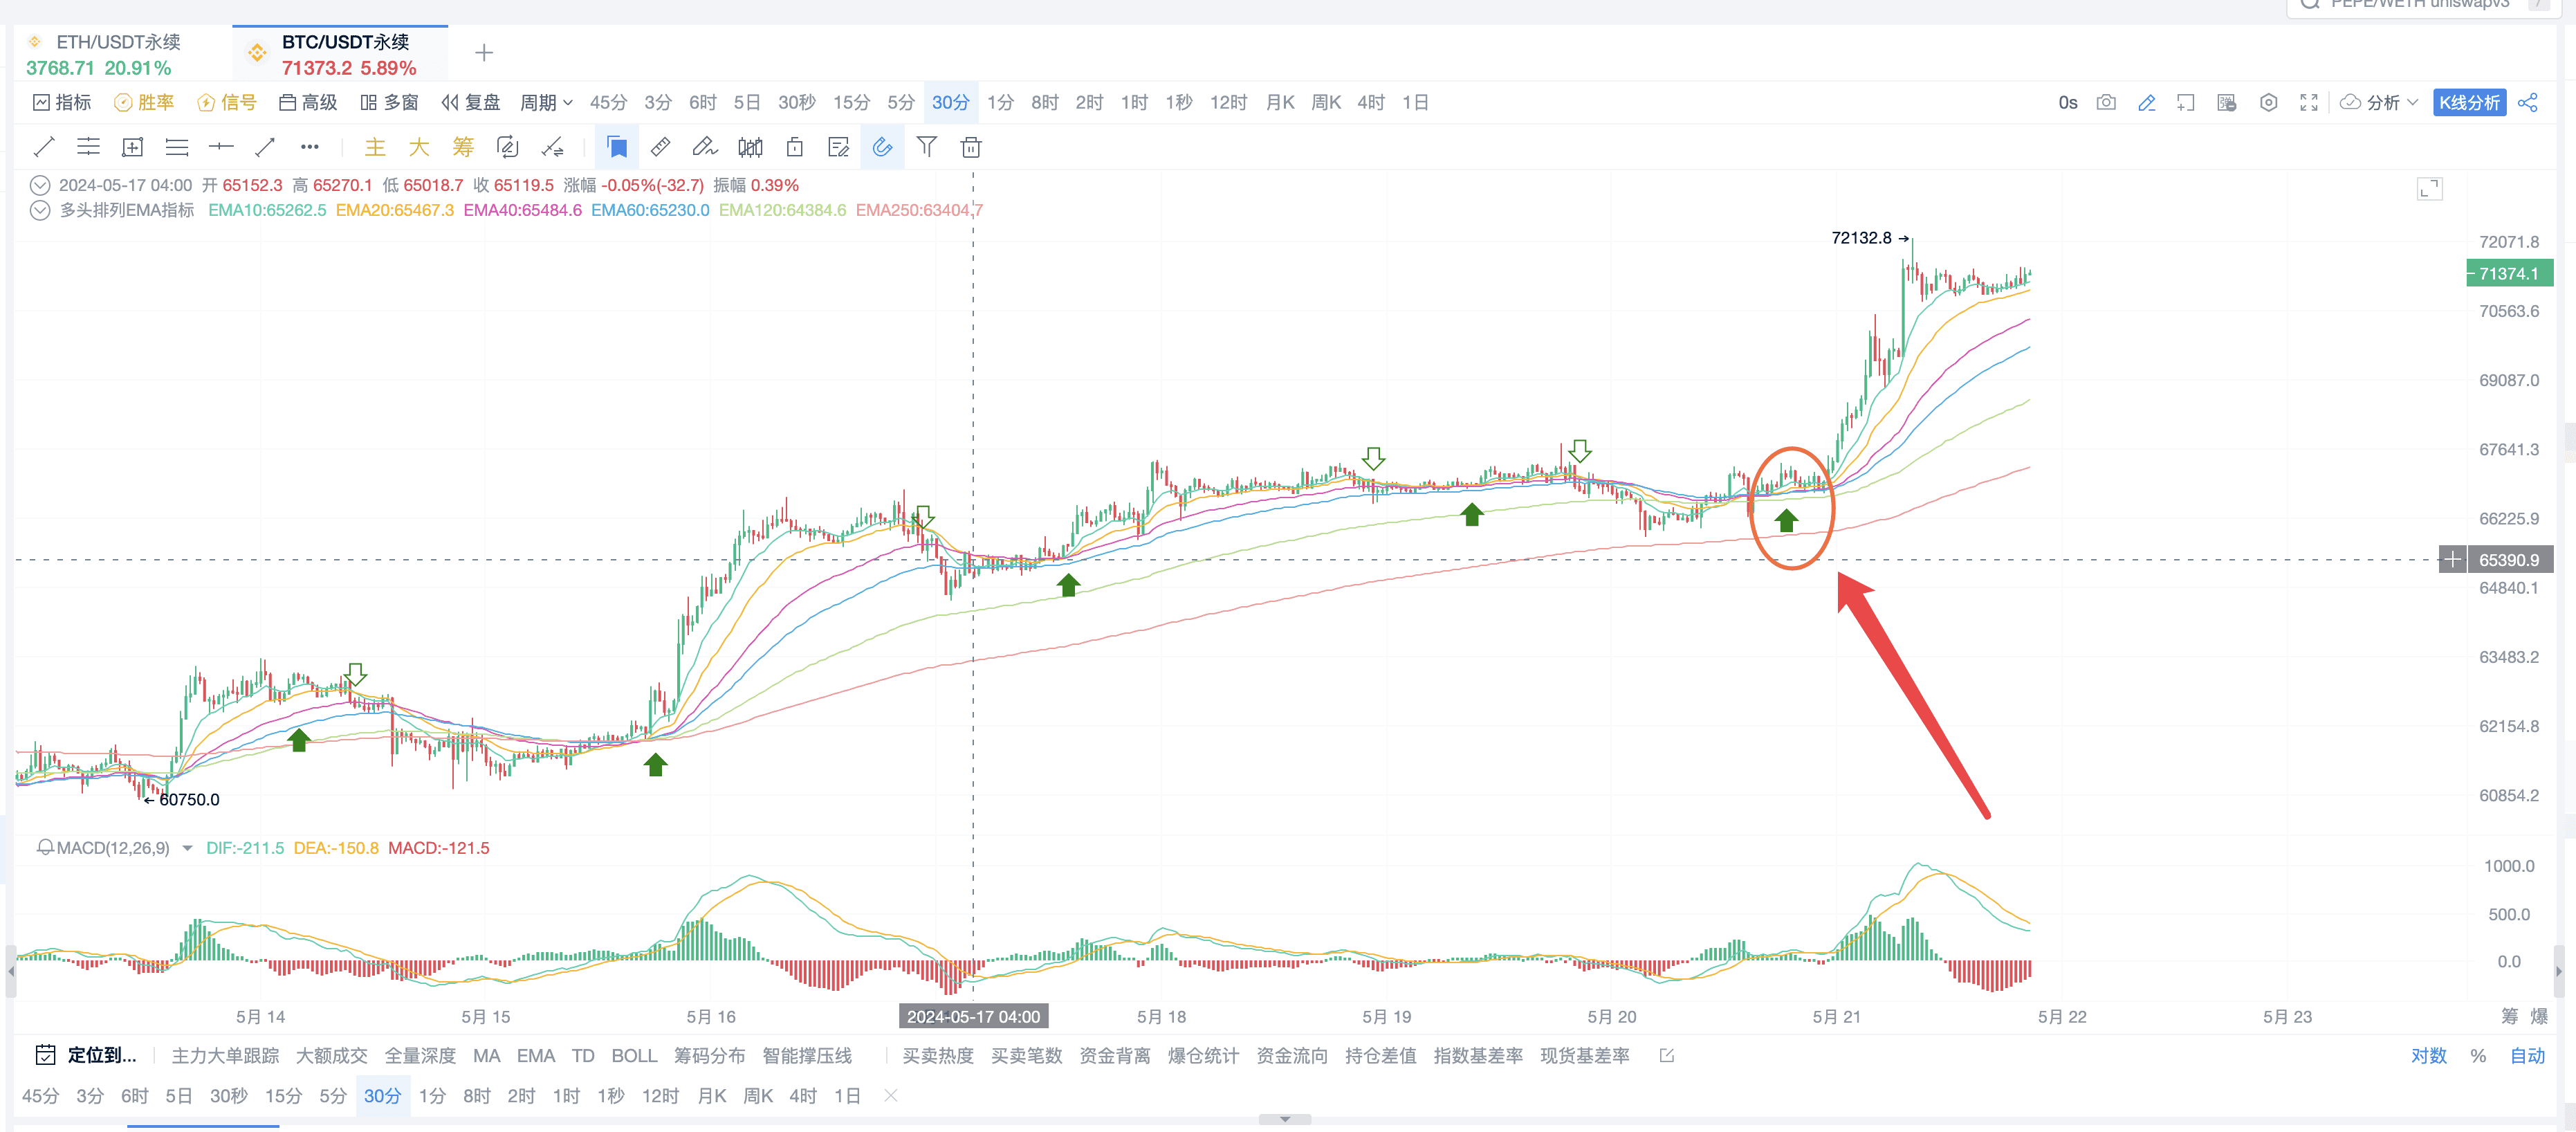
As shown in the figure, we can see that the market has formed a consensus, indicated by the EMA bullish signal. From the analysis of the candlestick chart, the market is actually very conflicted. We can understand that many parties are speculating and determining the direction. After multiple consensuses, some people feel that it's not right, leading to another discrepancy, and the direction remains conflicted. Eventually, there is a breaking point, and a consensus is formed, determining the direction.
On the candlestick chart, what we see are individual bars, but each bar represents the participation, tracking, and investment consensus of technical investors in the entire market, and this is a strategy based on forming investment consensus and discrepancies, with the underlying principle being EMA.
3. Why Use EMA?
Because in digital currency, EMA uses a weighted approach to make data indicators more sensitive, which is more suitable for observing the digital currency market. After all, the digital currency market is T+0, and funds are very free.
II. Strategy Construction
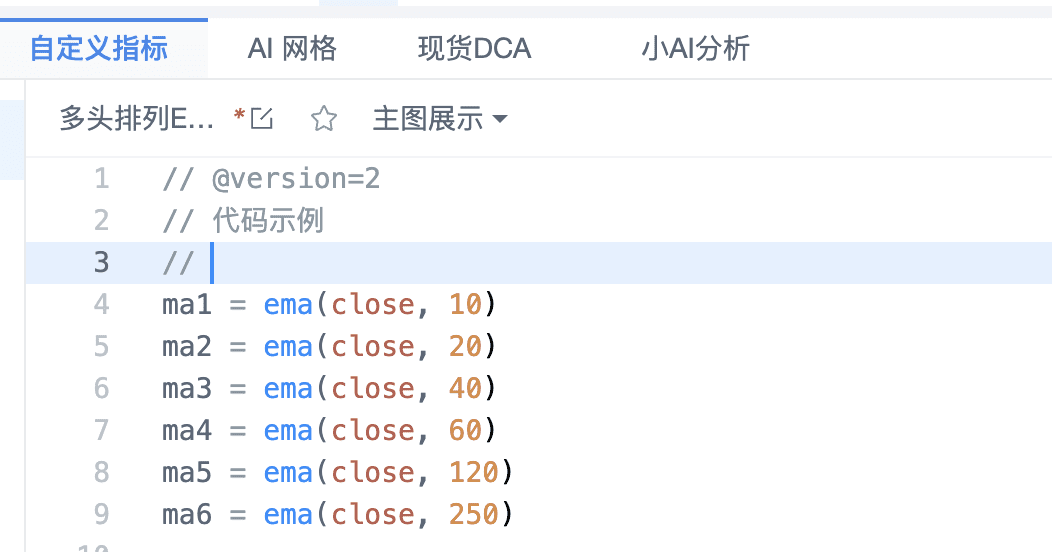
First, we set up the basic parameters of this strategy: EMA, as well as its short-term, medium-term, and long-term parameters.
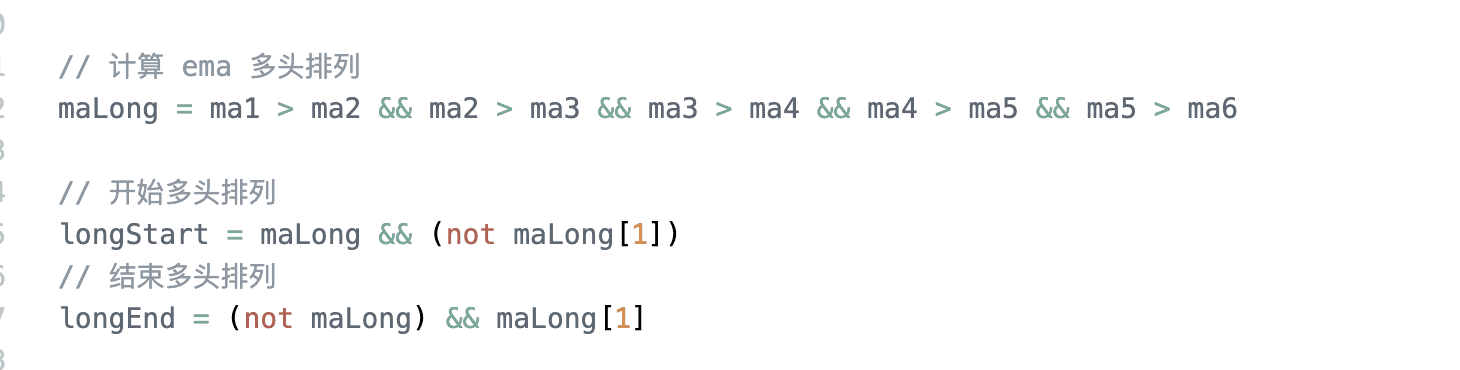
The second step is to construct the bullish arrangement signal. The method is to determine the consistent trend direction using a comparative approach.
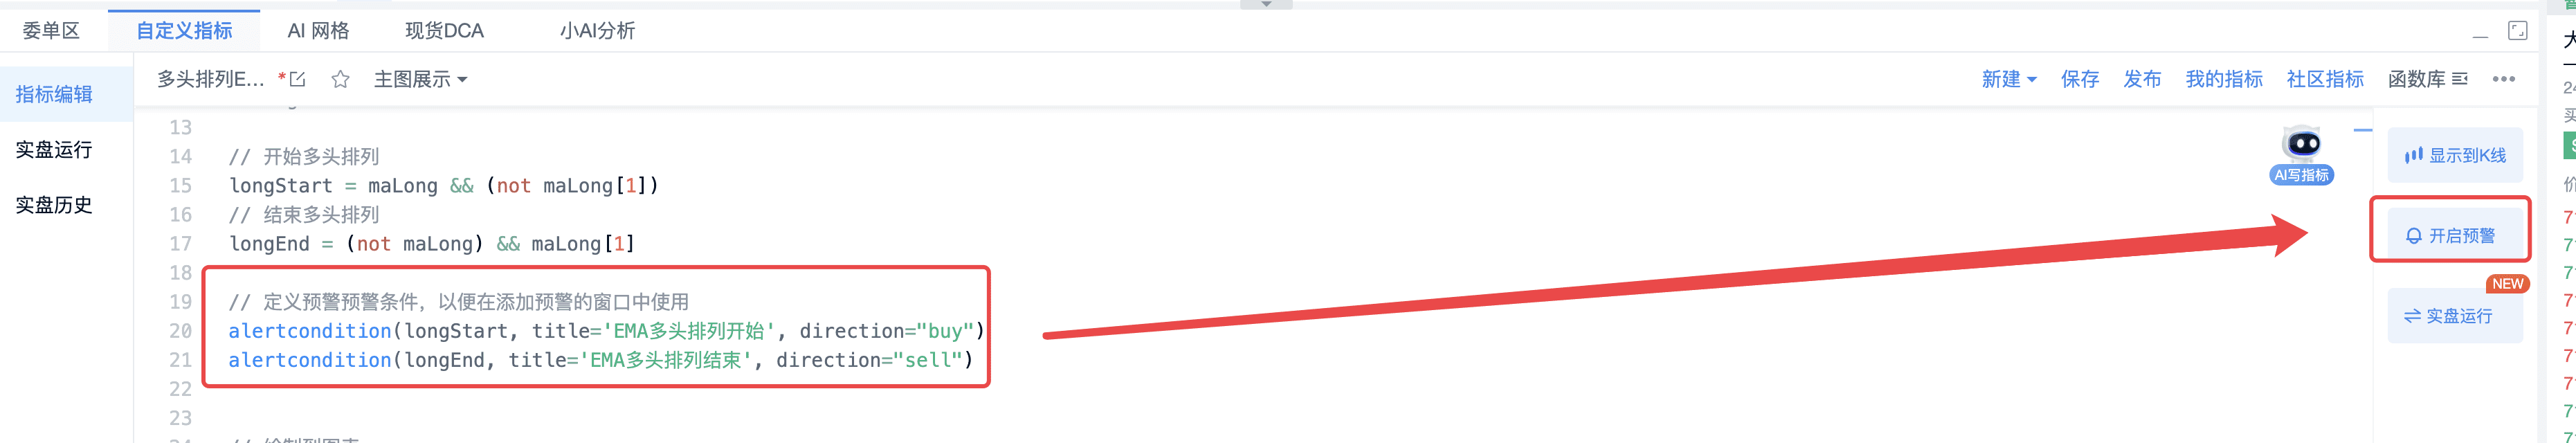
The third step is to create alerts based on the conditions of the bullish signal, making it convenient for everyone to click on the right to enable alerts, which will be sent to everyone's mobile phones, computers, phones, emails, etc.
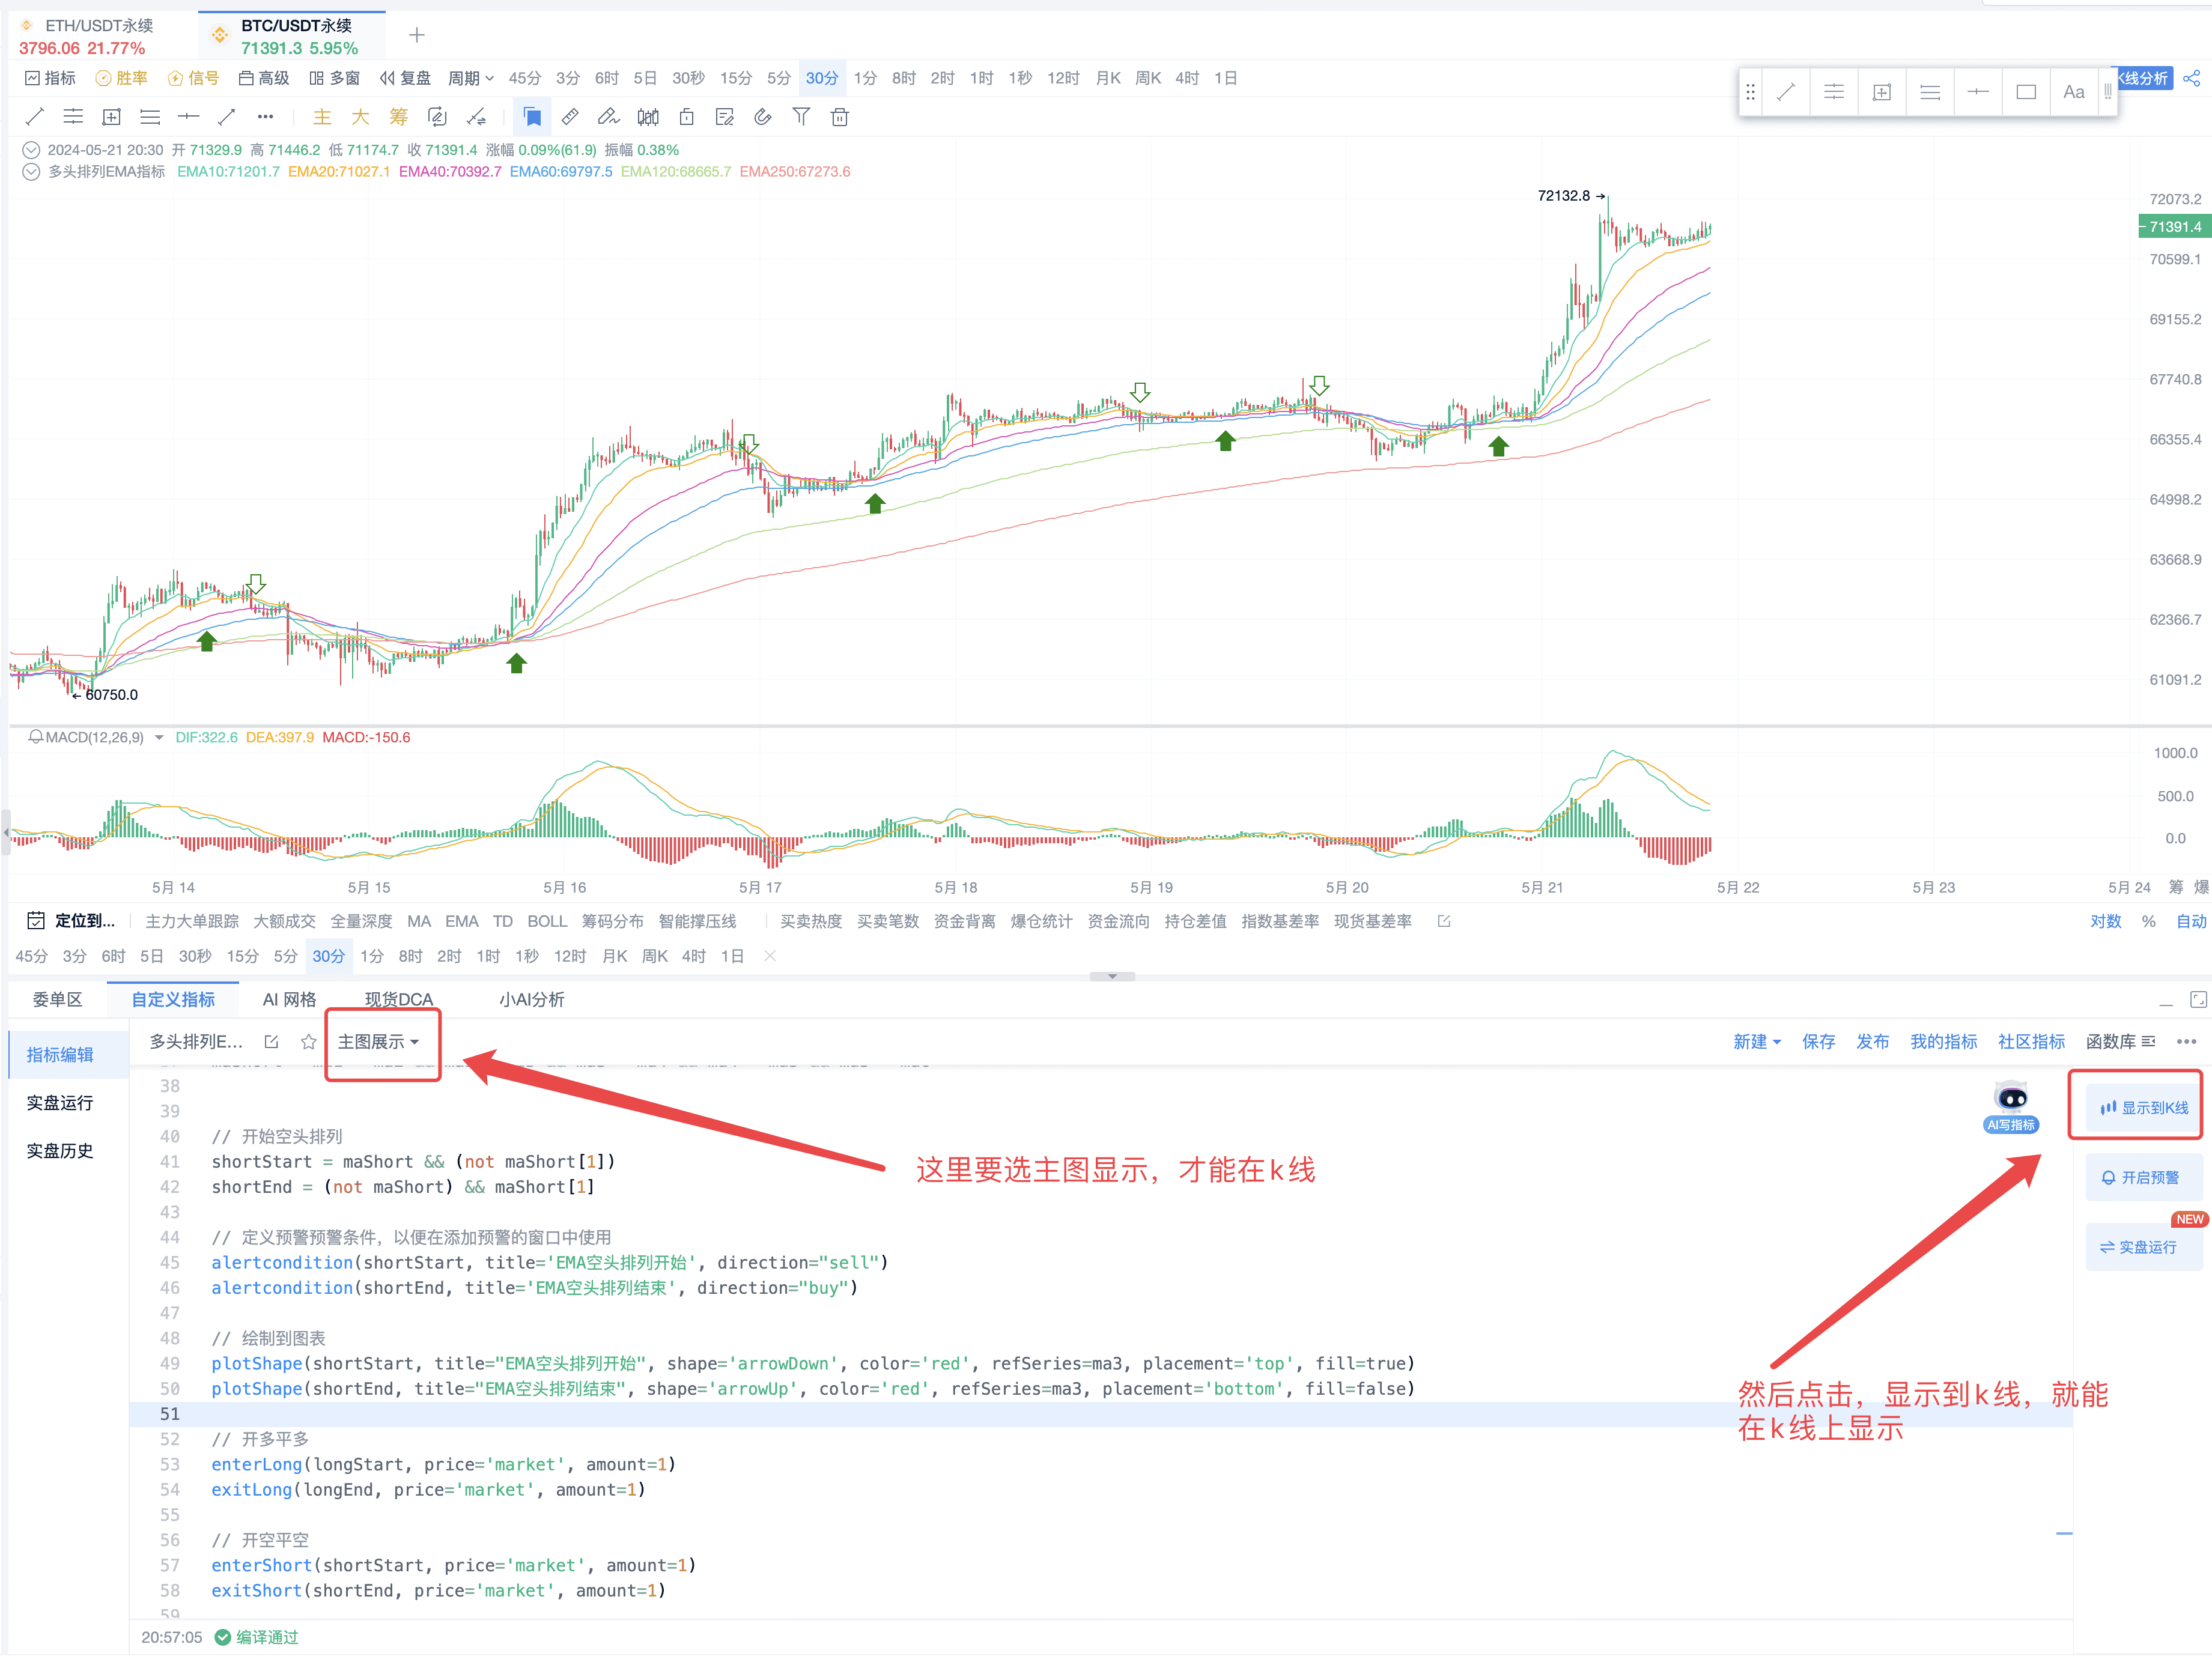
The fourth step is to draw the signals on the candlestick chart and above:
// Draw on the chart
plot(ma1, title="EMA10")
plot(ma2, title="EMA20")
plot(ma3, title="EMA40")
plot(ma4, title="EMA60")
plot(ma5, title="EMA120")
plot(ma6, title="EMA250")
plotShape(longStart, title="Start of EMA Bullish Arrangement", shape='arrowUp', color='green', refSeries=ma3, placement='bottom', fill=true)
plotShape(longEnd, title="End of EMA Bullish Arrangement", shape='arrowDown', color='green', refSeries=ma3, placement='top', fill=false)
Draw the indicators and those arrows on the candlestick chart.
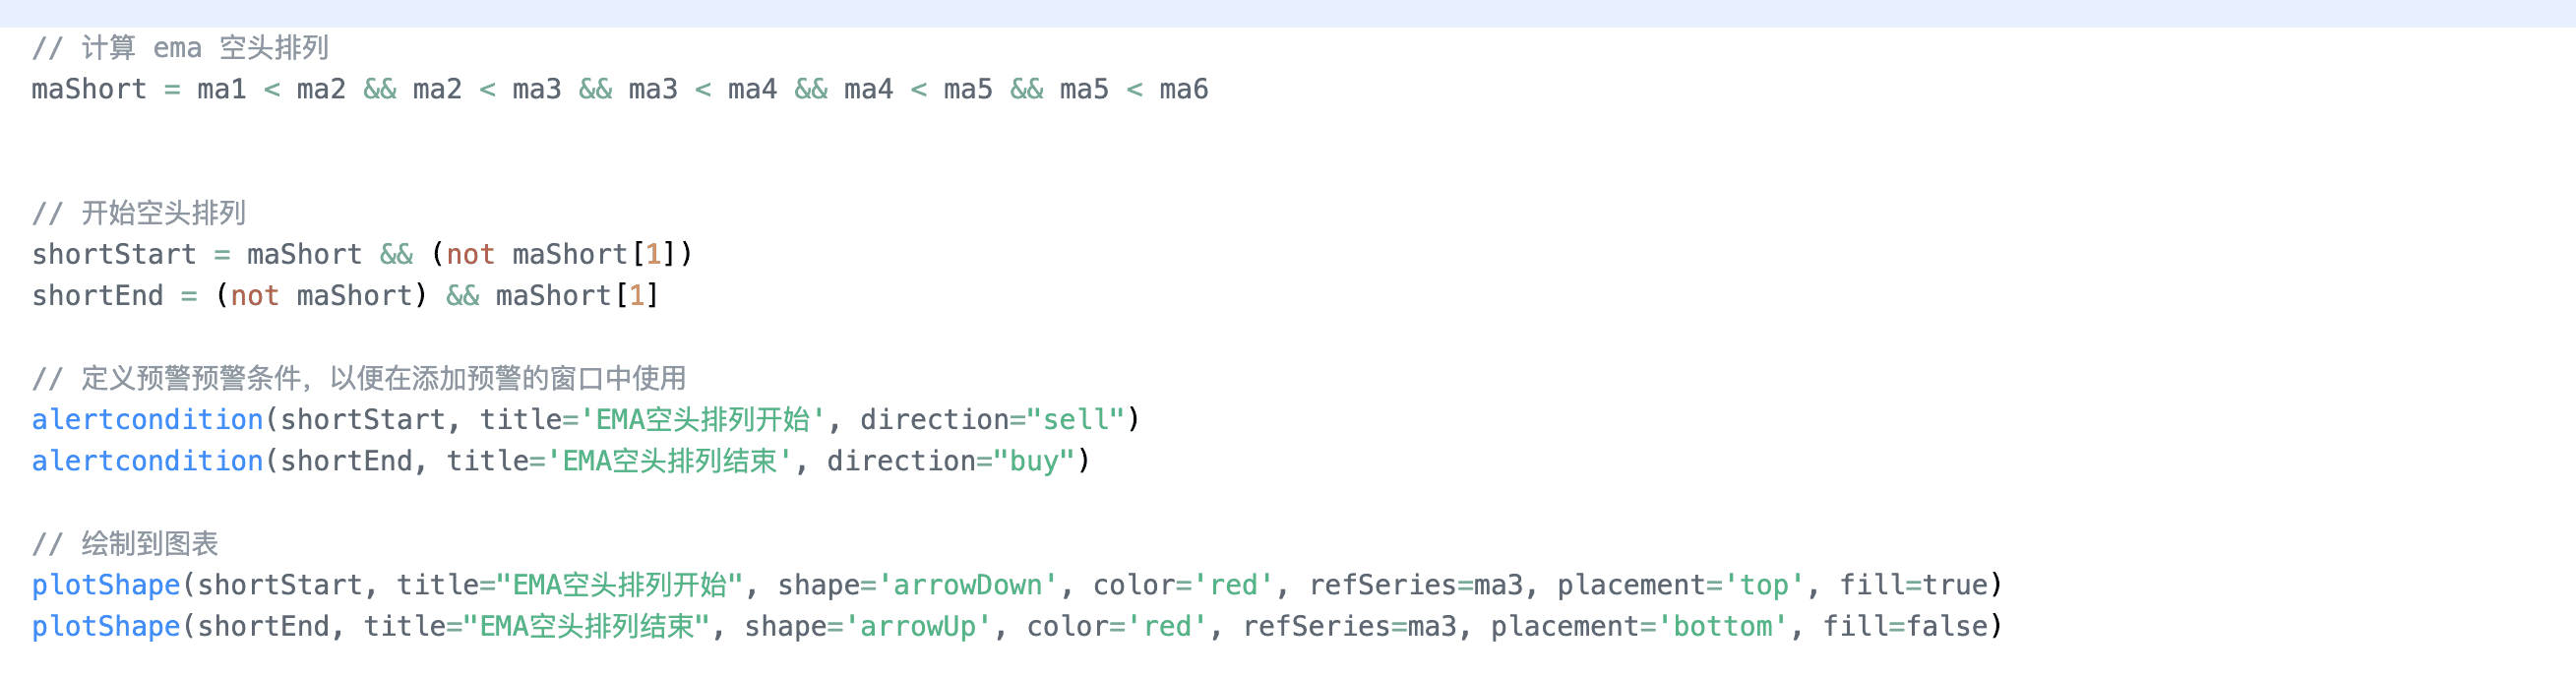
III. Bearish Arrangement Construction
We need to reverse the signals. This code segment shows the bearish signals.
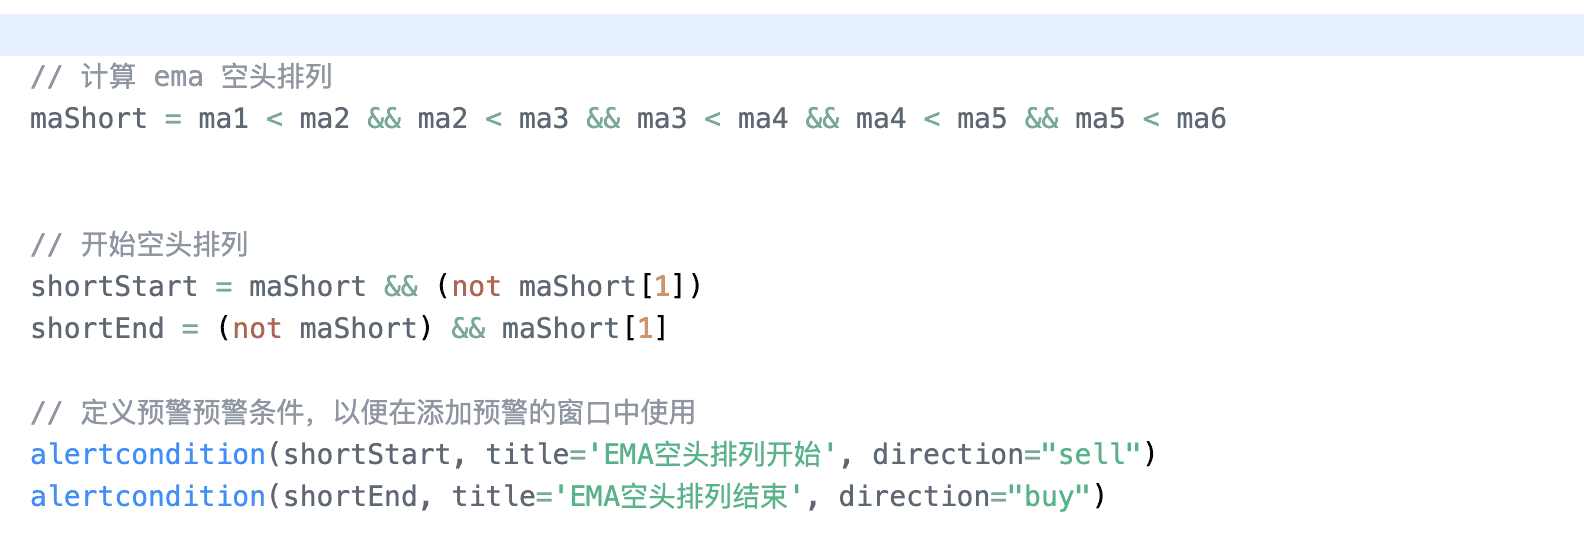
These are the bearish signals, alerts, and drawings.
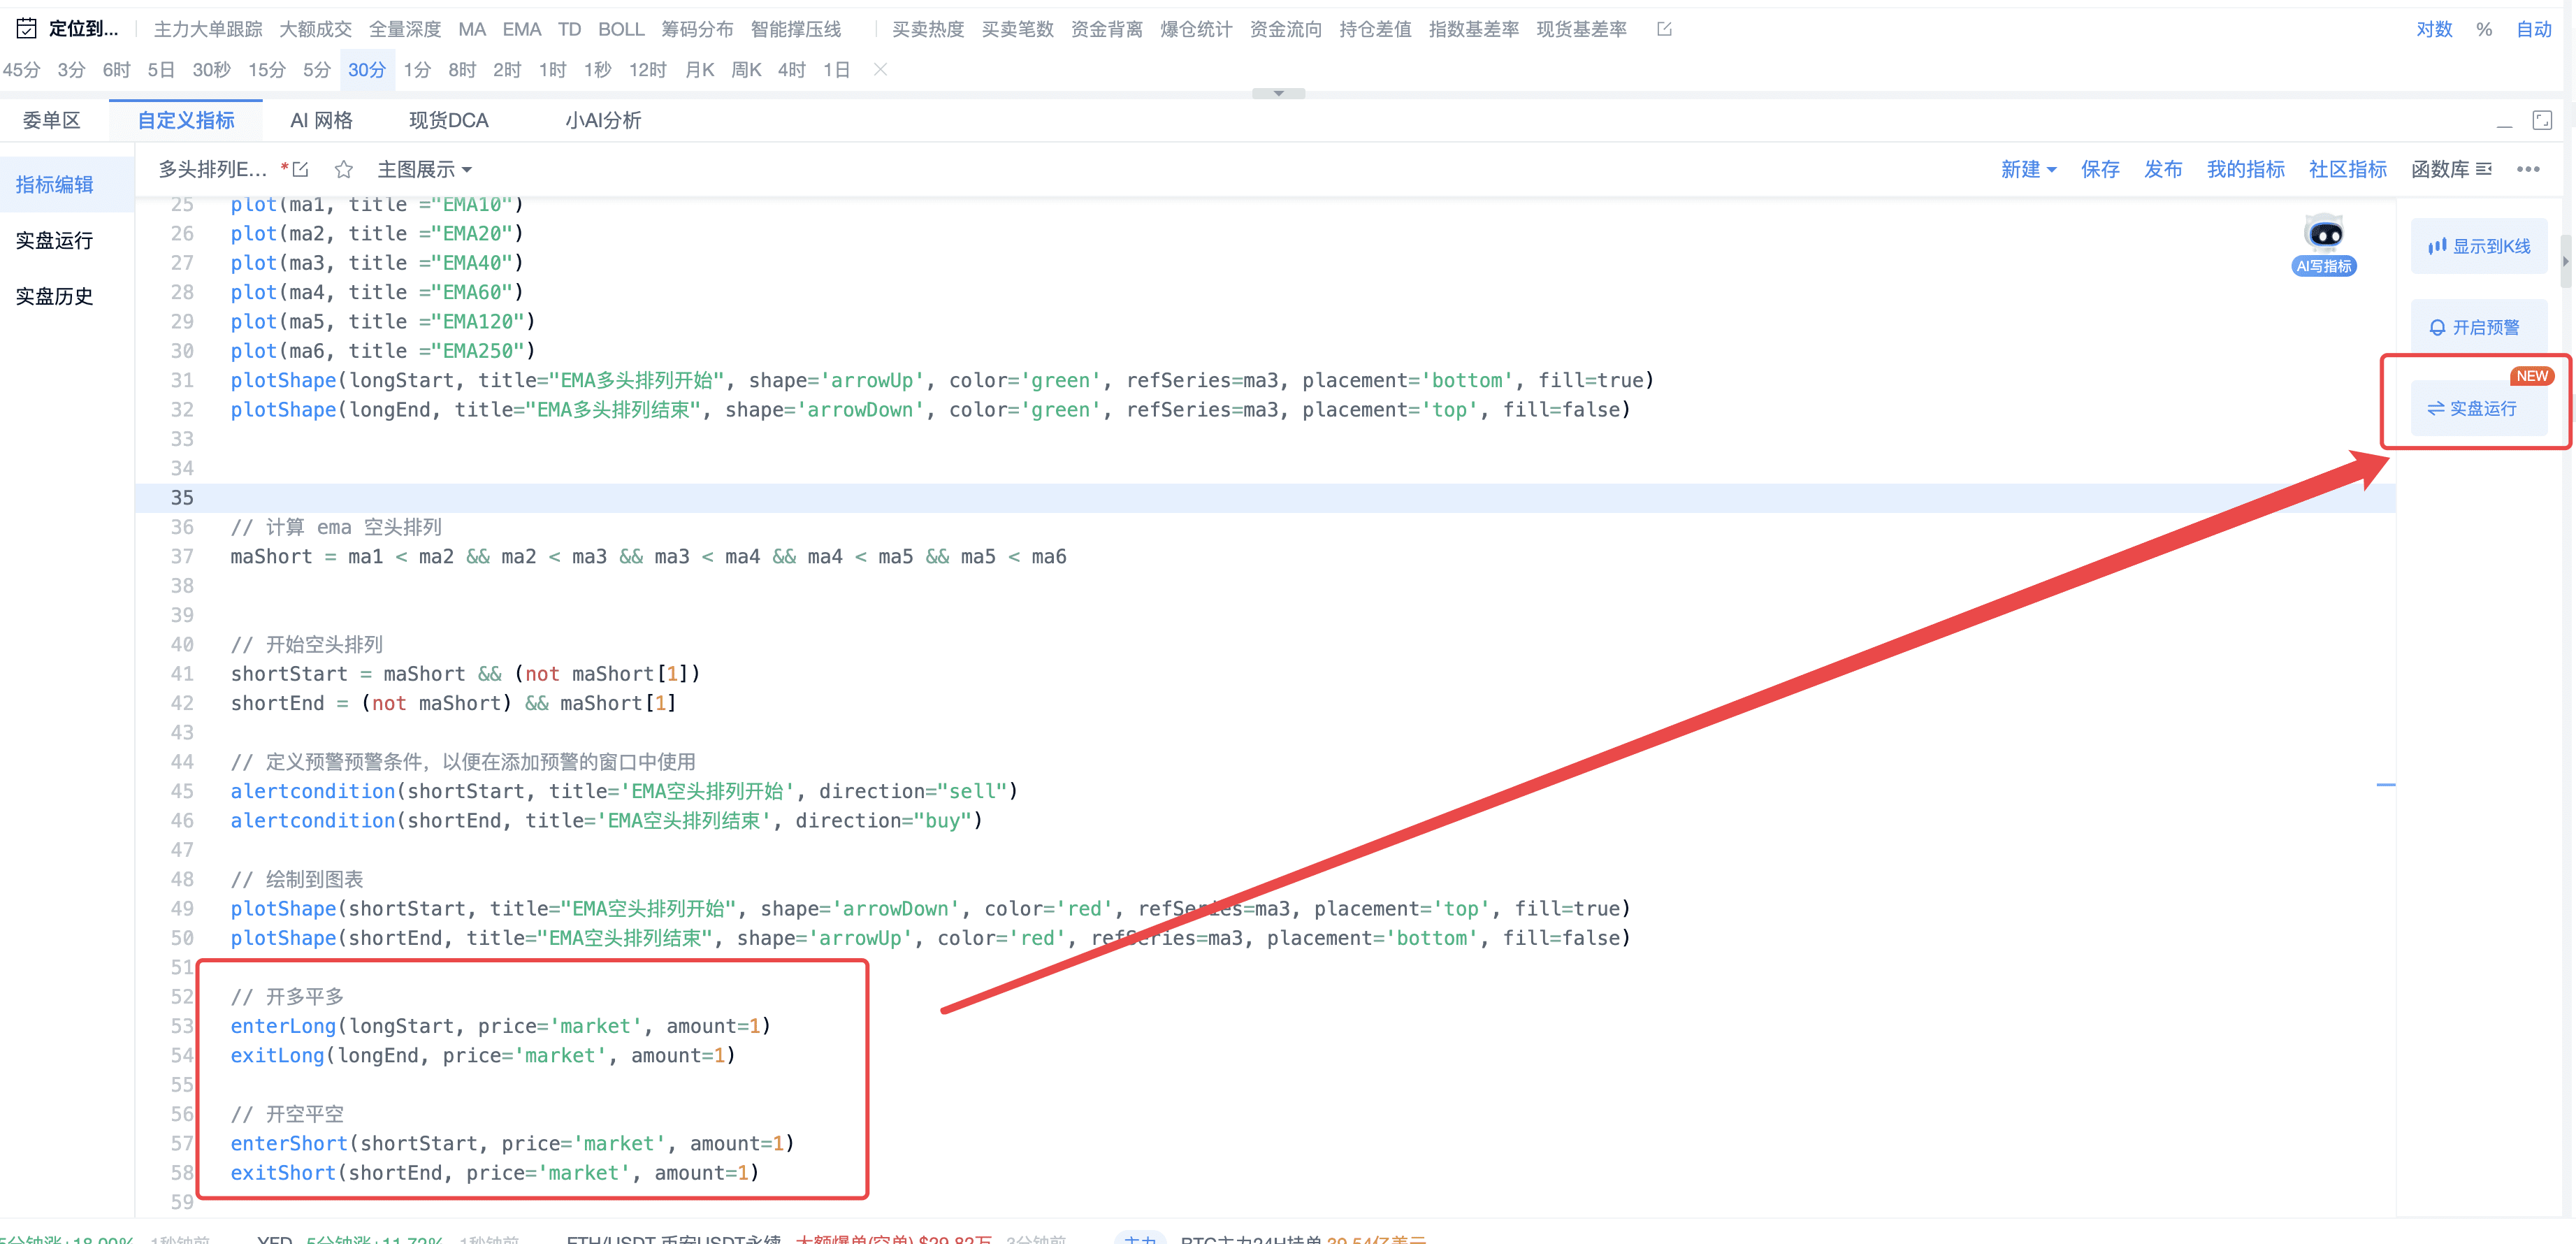
Finally, we can also implement an automated trading method, which, when added, can be used for live trading, with the program helping us trade.
IV. Complete Strategy Display
// @version=2
// Code example
//
ma1 = ema(close, 10)
ma2 = ema(close, 20)
ma3 = ema(close, 40)
ma4 = ema(close, 60)
ma5 = ema(close, 120)
ma6 = ema(close, 250)
// Calculate EMA Bullish Arrangement
maLong = ma1 > ma2 && ma2 > ma3 && ma3 > ma4 && ma4 > ma5 && ma5 > ma6
// Start of EMA Bullish Arrangement
longStart = maLong && (not maLong[1])
// End of EMA Bullish Arrangement
longEnd = (not maLong) && maLong[1]
// Define alert conditions for use in the add alert window
alertcondition(longStart, title='EMA Bullish Arrangement Start', direction="buy")
alertcondition(longEnd, title='EMA Bullish Arrangement End', direction="sell")
// Draw on the chart
plot(ma1, title ="EMA10")
plot(ma2, title ="EMA20")
plot(ma3, title ="EMA40")
plot(ma4, title ="EMA60")
plot(ma5, title ="EMA120")
plot(ma6, title ="EMA250")
plotShape(longStart, title="EMA Bullish Arrangement Start", shape='arrowUp', color='green', refSeries=ma3, placement='bottom', fill=true)
plotShape(longEnd, title="EMA Bullish Arrangement End", shape='arrowDown', color='green', refSeries=ma3, placement='top', fill=false)
// Calculate EMA Bearish Arrangement
maShort = ma1 < ma2 && ma2 < ma3 && ma3 < ma4 && ma4 < ma5 && ma5 < ma6
// Start of EMA Bearish Arrangement
shortStart = maShort && (not maShort[1])
shortEnd = (not maShort) && maShort[1]
// Define alert conditions for use in the add alert window
alertcondition(shortStart, title='EMA Bearish Arrangement Start', direction="sell")
alertcondition(shortEnd, title='EMA Bearish Arrangement End', direction="buy")
// Draw on the chart
plotShape(shortStart, title="EMA Bearish Arrangement Start", shape='arrowDown', color='red', refSeries=ma3, placement='top', fill=true)
plotShape(shortEnd, title="EMA Bearish Arrangement End", shape='arrowUp', color='red', refSeries=ma3, placement='bottom', fill=false)
// Enter long and exit long
enterLong(longStart, price='market', amount=1)
exitLong(longEnd, price='market', amount=1)
// Enter short and exit short
enterShort(shortStart, price='market', amount=1)
exitShort(shortEnd, price='market', amount=1)
PRO members and signal alert members are premium tools tailored for lazy friends, and custom indicators can help any AICoin user plan their trades and trade their plans. For more custom indicator strategy displays and multiple alert reminders, feel free to experience the custom indicator membership with the signal alert/PRO version K-line, both of which are available for a limited time for free. Click the link below to experience: https://aicoin.com/en/vip/chartpro
Recommended Reading
For more live content, please follow the AICoin "News/Information-Live Review" section, and feel free to download AICoin PC-end
免责声明:本文章仅代表作者个人观点,不代表本平台的立场和观点。本文章仅供信息分享,不构成对任何人的任何投资建议。用户与作者之间的任何争议,与本平台无关。如网页中刊载的文章或图片涉及侵权,请提供相关的权利证明和身份证明发送邮件到support@aicoin.com,本平台相关工作人员将会进行核查。


