On the afternoon of May 20th, AICoin researchers conducted a graphic and textual live broadcast sharing titled "Small Full Wins All, a MACD High Winning Rate Strategy (Free Membership)" in the AICoin PC-end-Group Chat-Live. The following is a summary of the live content.
I. Explanation of MACD Indicator
1. Concept Definition
MACD (Moving Average Convergence Divergence) describes the relationship between two moving averages, namely a fast line and a slow line. Essentially, the MACD indicator is used to judge and speculate on the change or continuation of price trends.
2. How to Enable the MACD Indicator?
Open the indicator library, search for the MACD indicator, and check to enable it. The MACD indicator will then appear below.
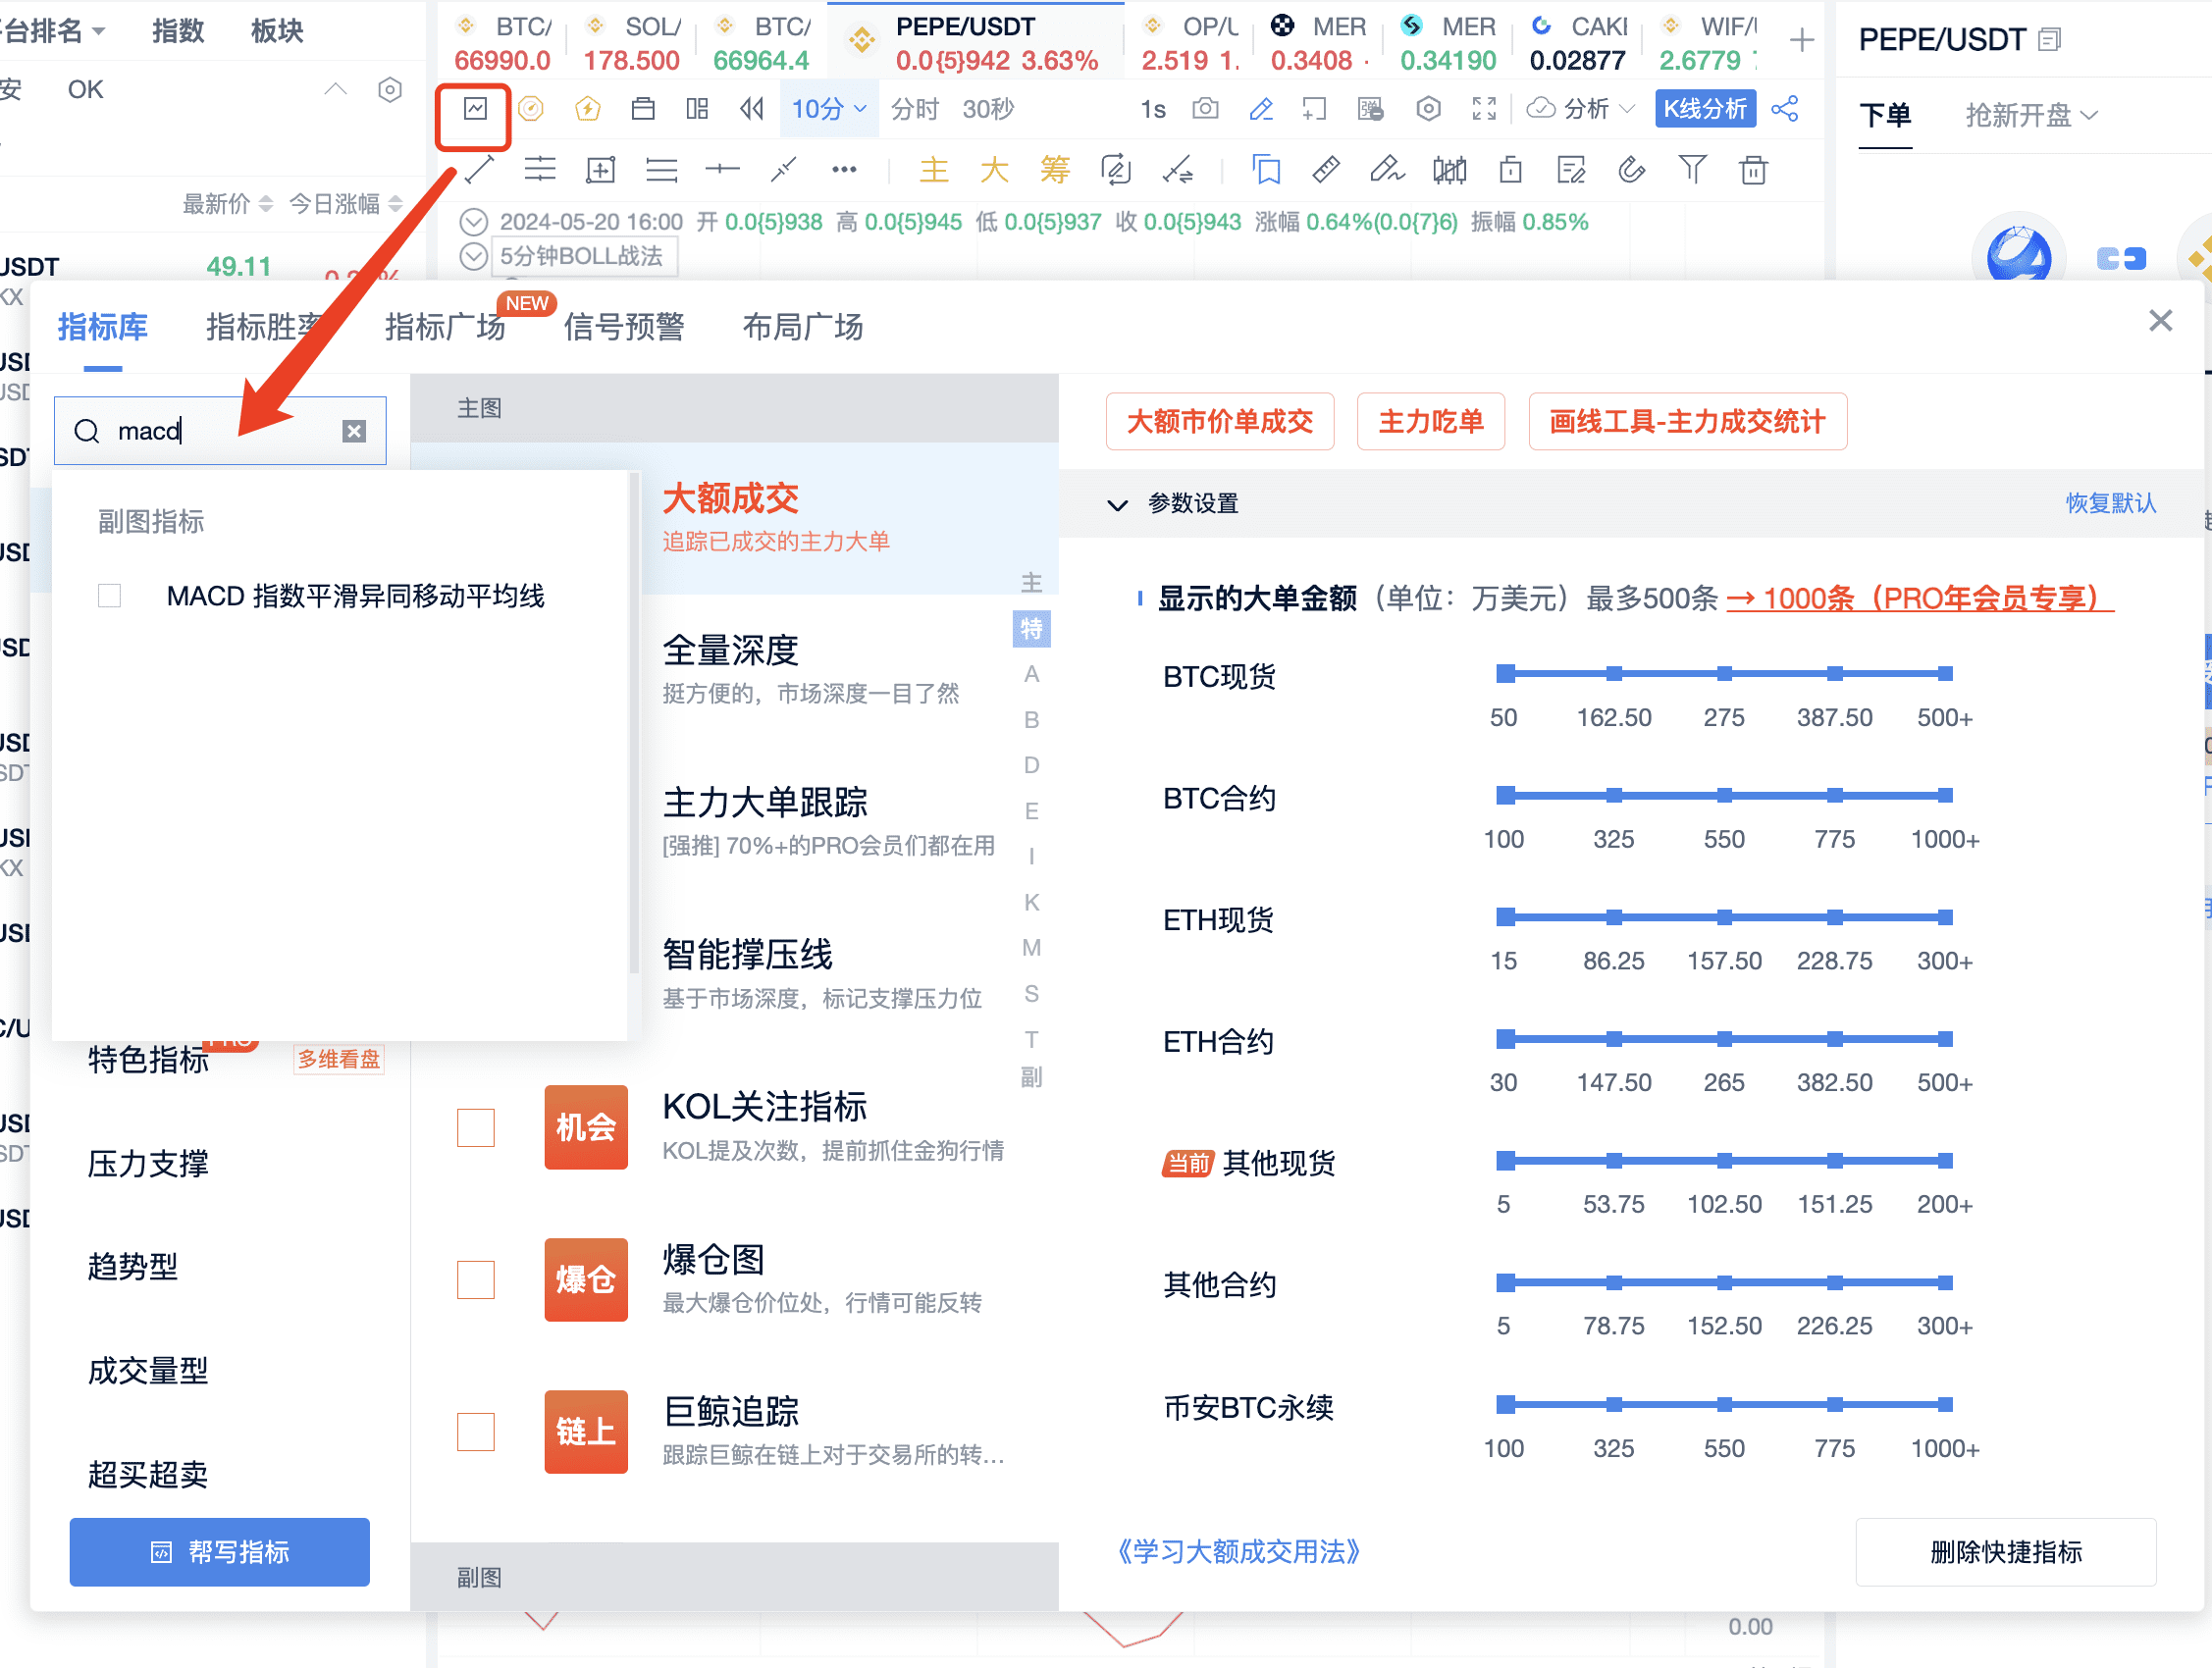
BTC/USDT on Binance is ₮66997.99, switch to BTC 1-hour. Set the MACD call 1, spot. We can use the original settings without making too many changes. The original parameters are short period (N1) 12, long period (N2) 26, and DEA period (M) 9.
3. Green Line and Orange Line
The green line (DIF, fast line) is the difference between the short period (12 periods) EMA and the long period (26 periods) EMA, also known as the "fast line." It reflects market changes over a shorter time span and is therefore more sensitive than the slow line.
The orange line (DEA, slow line) is the 9-period EMA of DIF, also known as the "slow line." It is a smooth line calculated from DIF, reflecting market changes over a longer time span and thus smoother and more lagging than the fast line.
The MACD histogram shows the difference between DIF and DEA. Based on these three elements, we can judge the market trend and momentum changes.
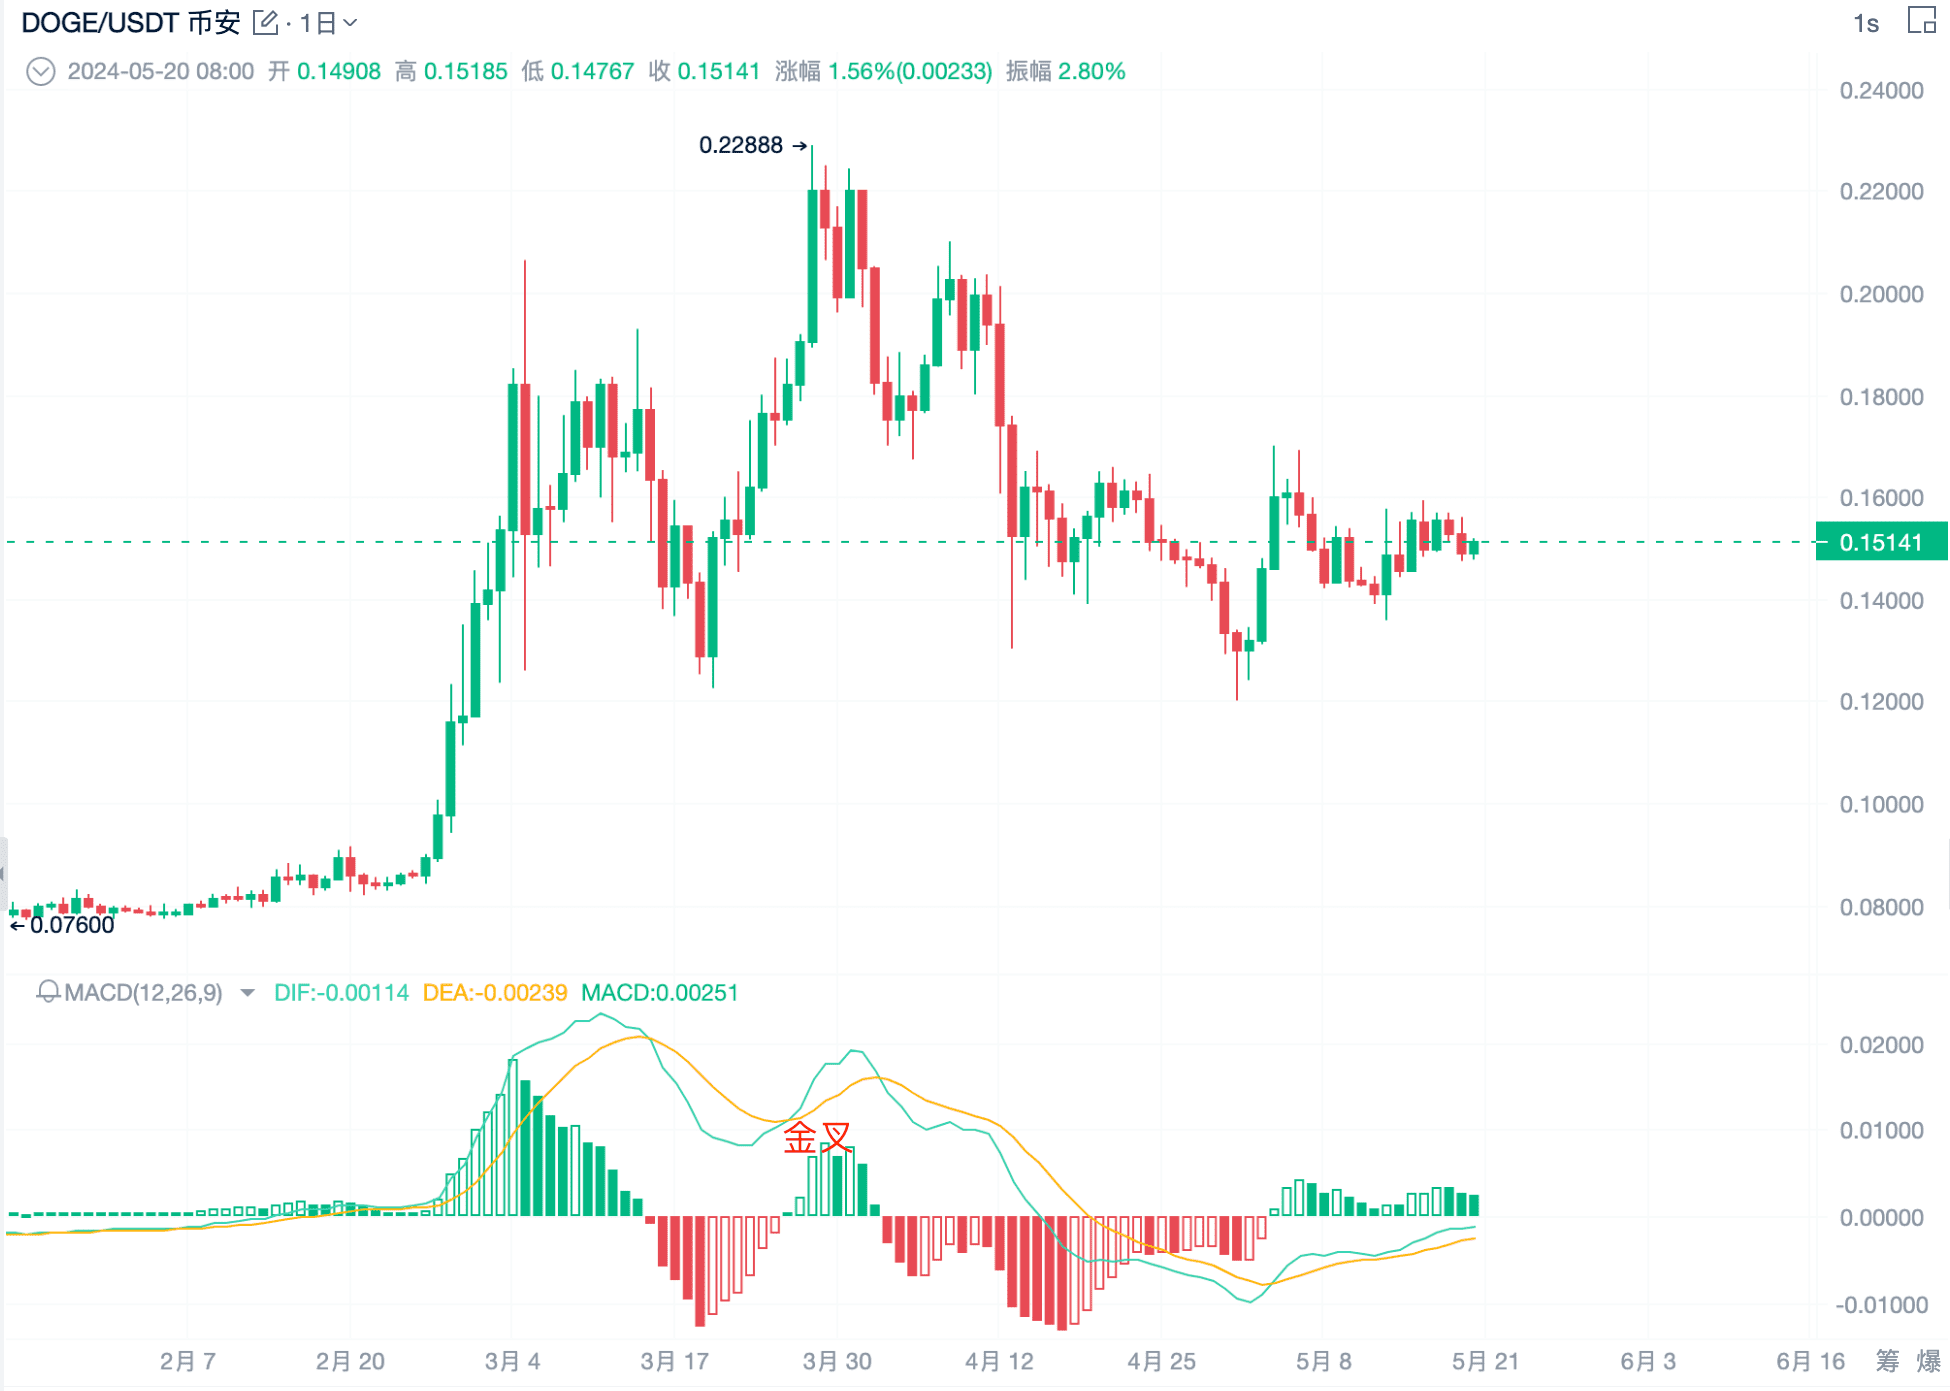
II. MACD Golden Cross and Death Cross Trading Strategy
When the price is in a downtrend, the fast line crossing above the slow line, known as the golden cross, indicates that the trend is about to change from a downtrend to an uptrend, presenting a long trading opportunity.
Subsequently, when the price is in an uptrend and the fast line crosses below the slow line, known as the death cross, it indicates that the trend will change from an uptrend to a downtrend, presenting a reasonable short entry point.
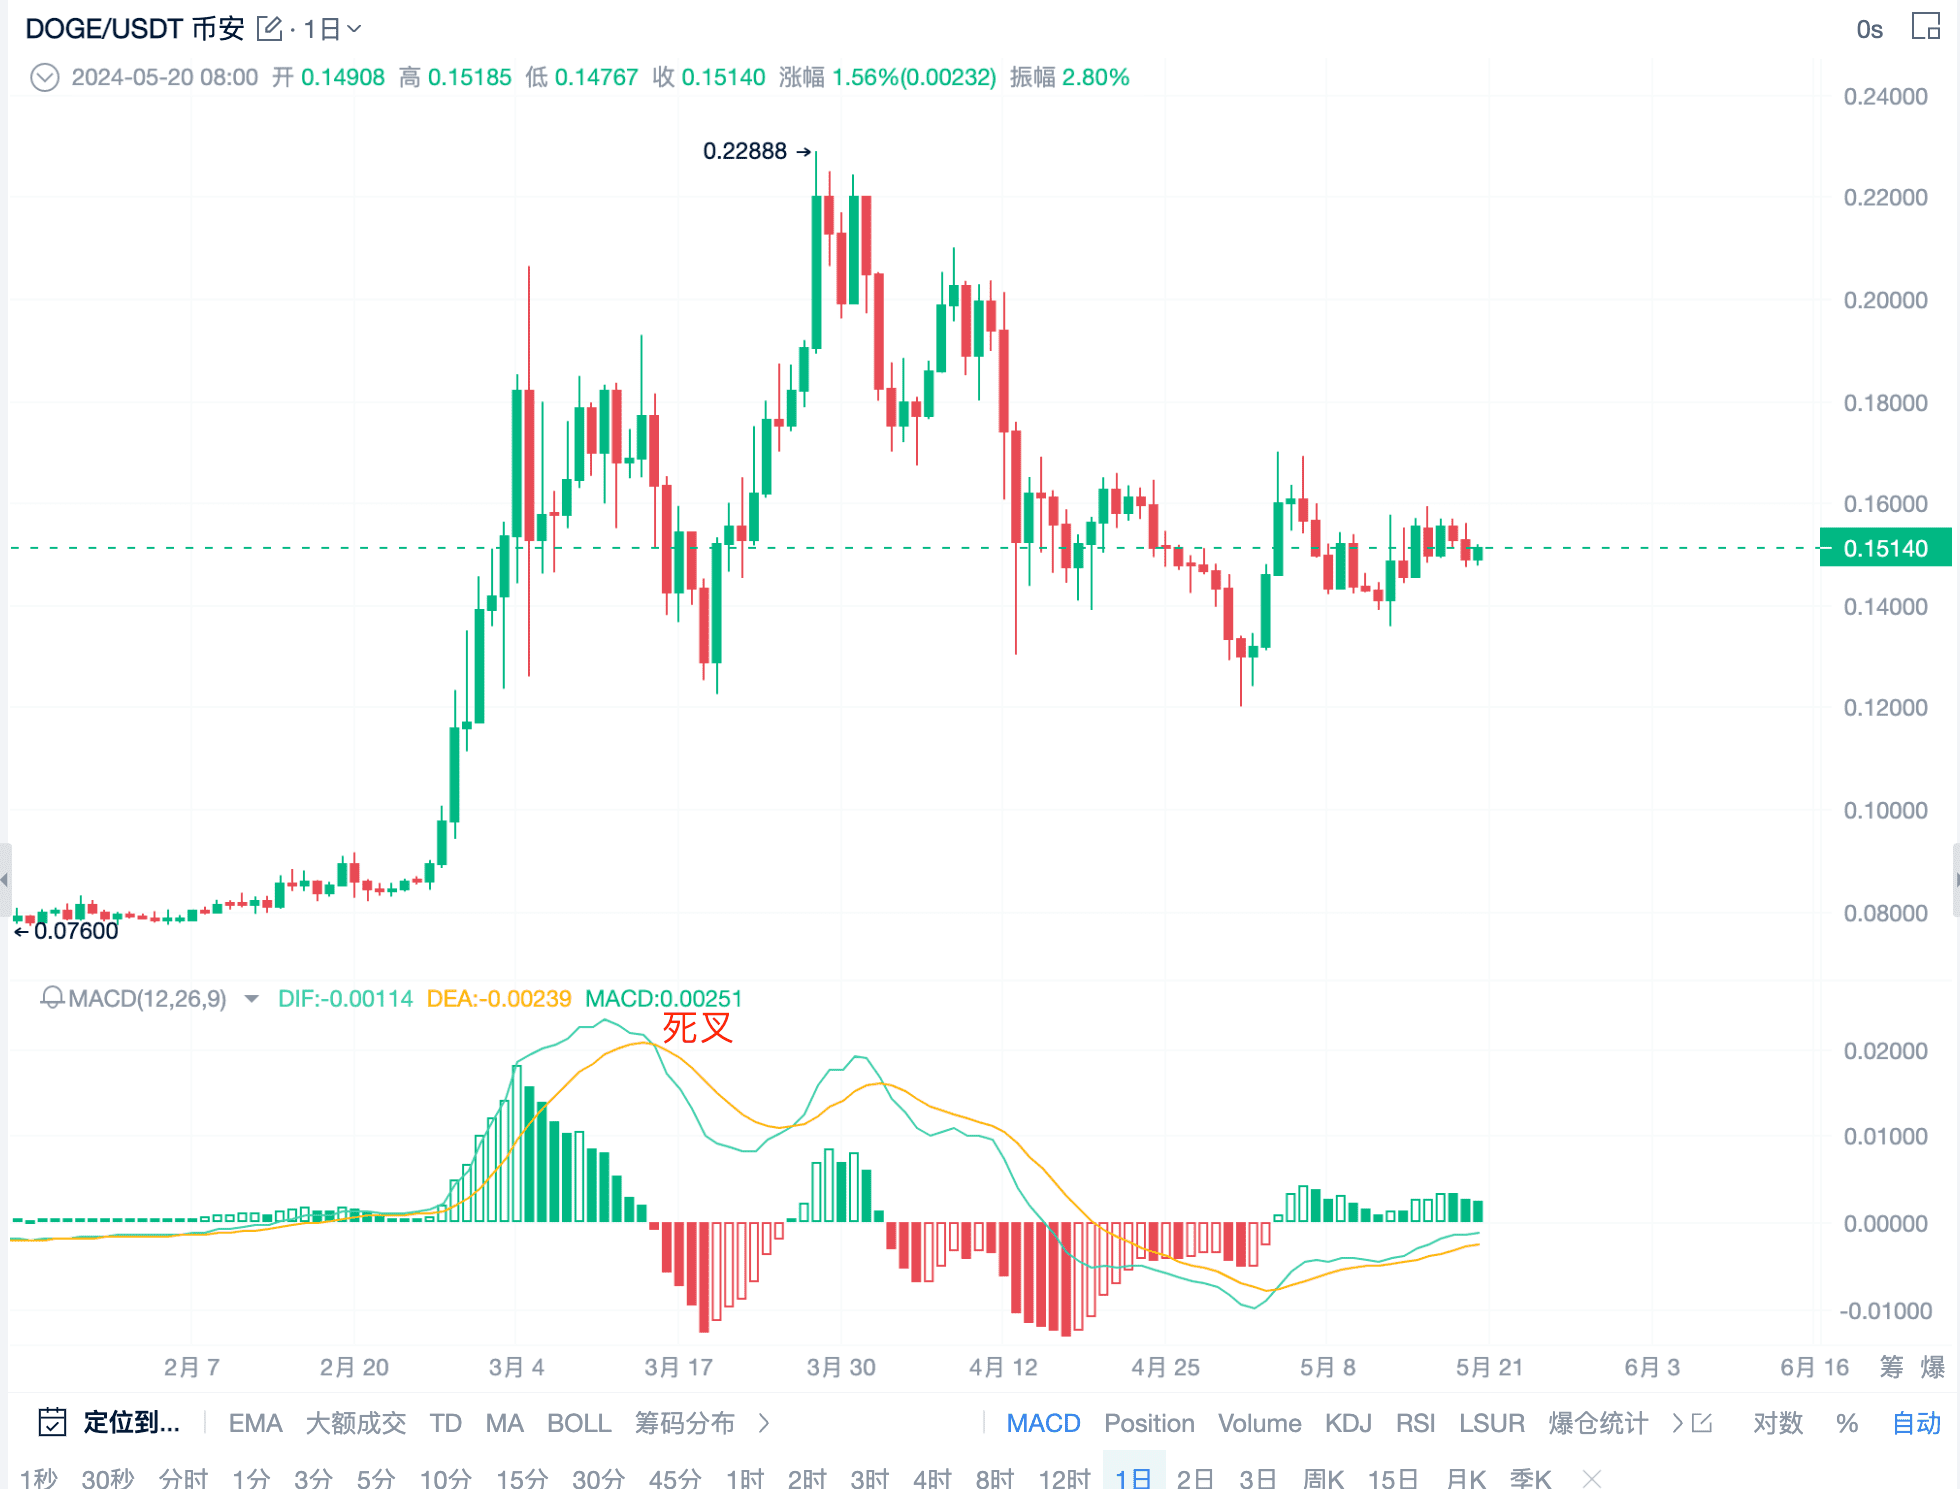
This is the traditional use of MACD.
III. MACD Divergence Trading Strategy
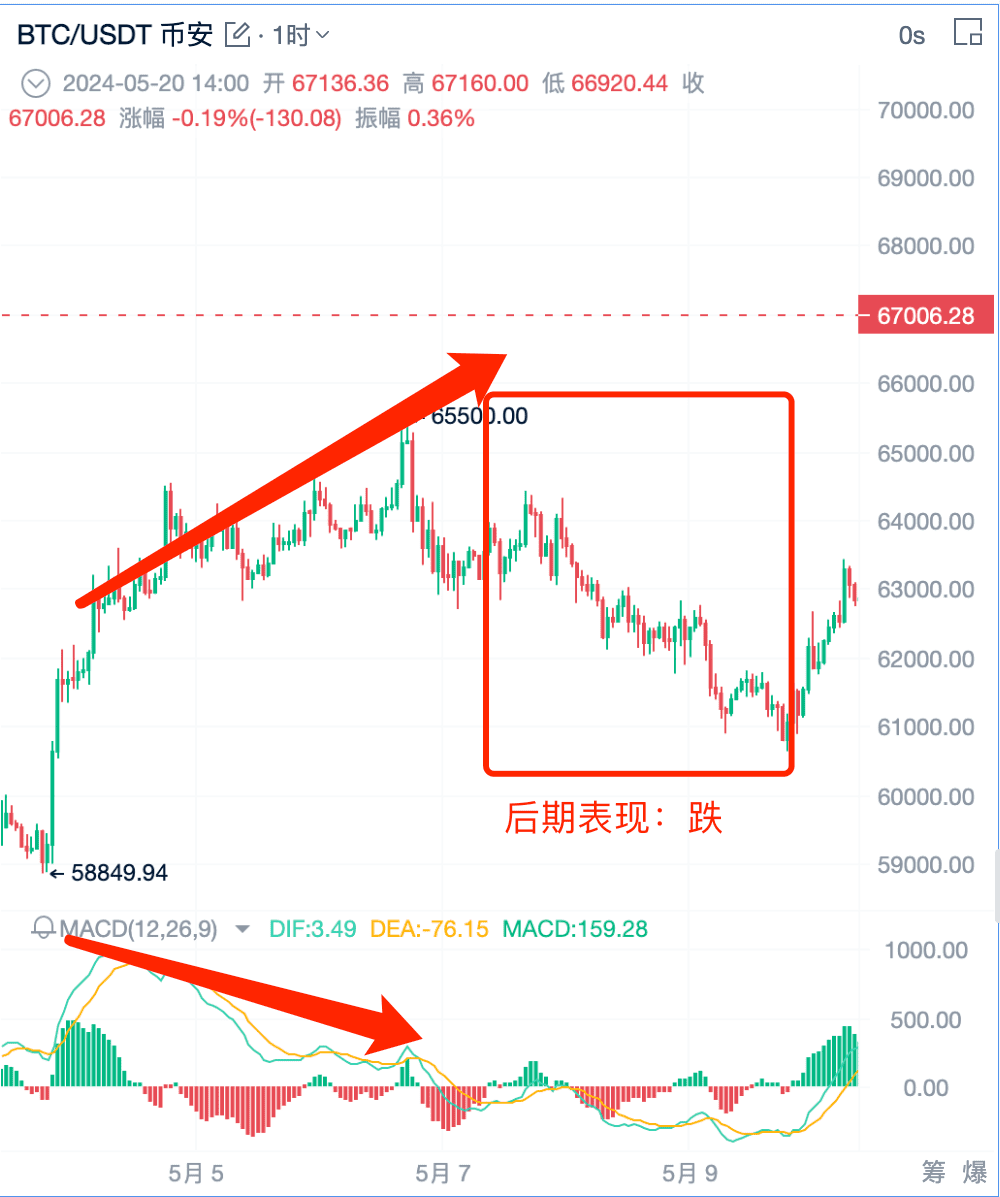
1. MACD Bearish Divergence
When the high point of the price is higher than the previous high, this is a bearish divergence.
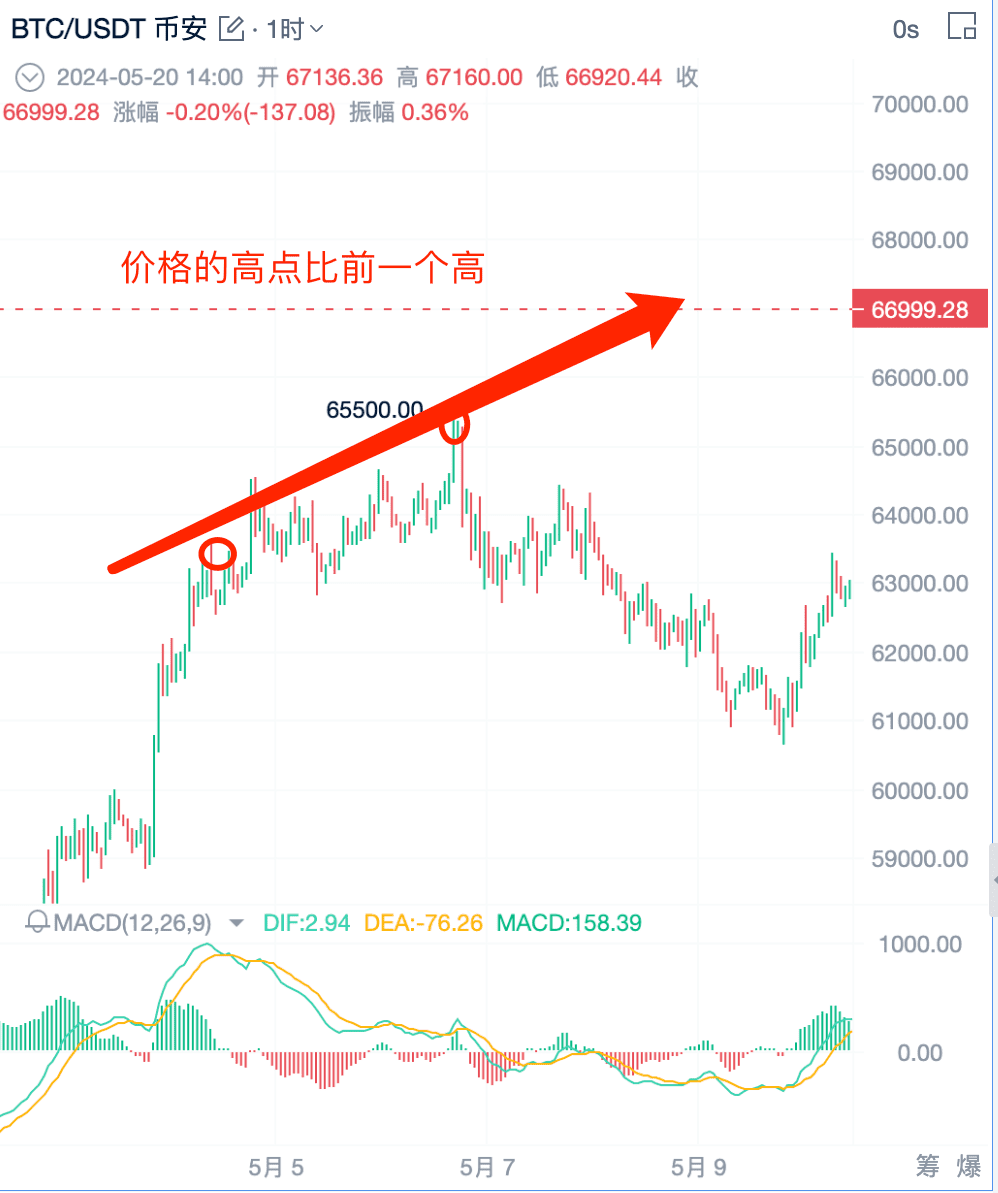
In theory, the MACD should also form a higher high to correspond to the trend momentum of the price. However, at this point, the MACD forms a lower high, indicating a weakening trend momentum. The second high point in the image is higher than the first, constituting a bearish divergence.
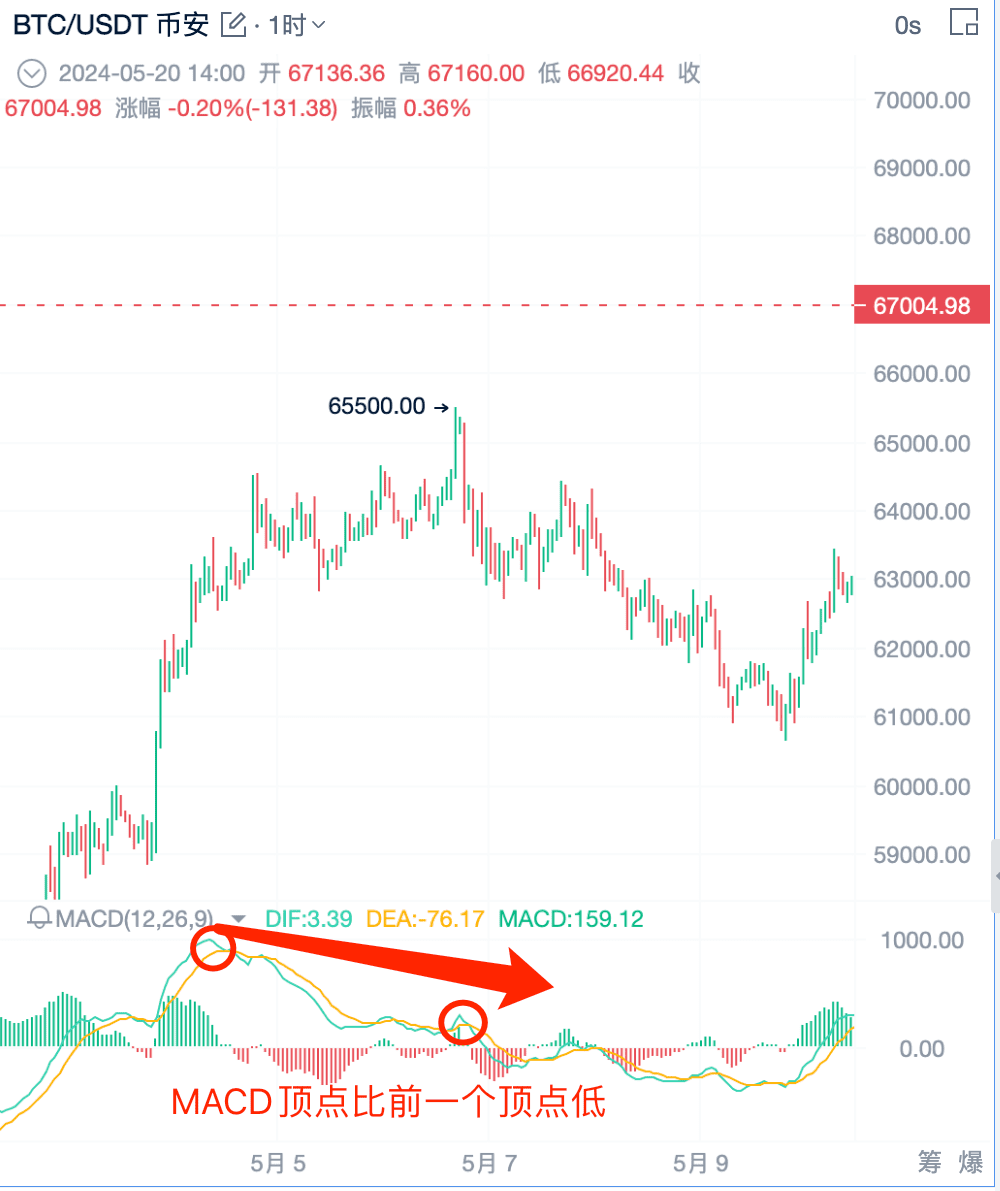
When the price forms a higher high but the MACD forms a lower high, this is a bearish divergence. Seeing the price form a higher high but the MACD form a lower high constitutes a bearish divergence. The price trend is likely to reverse downwards.
We need to find the key price level + MACD trend reversal divergence to confirm the trend.
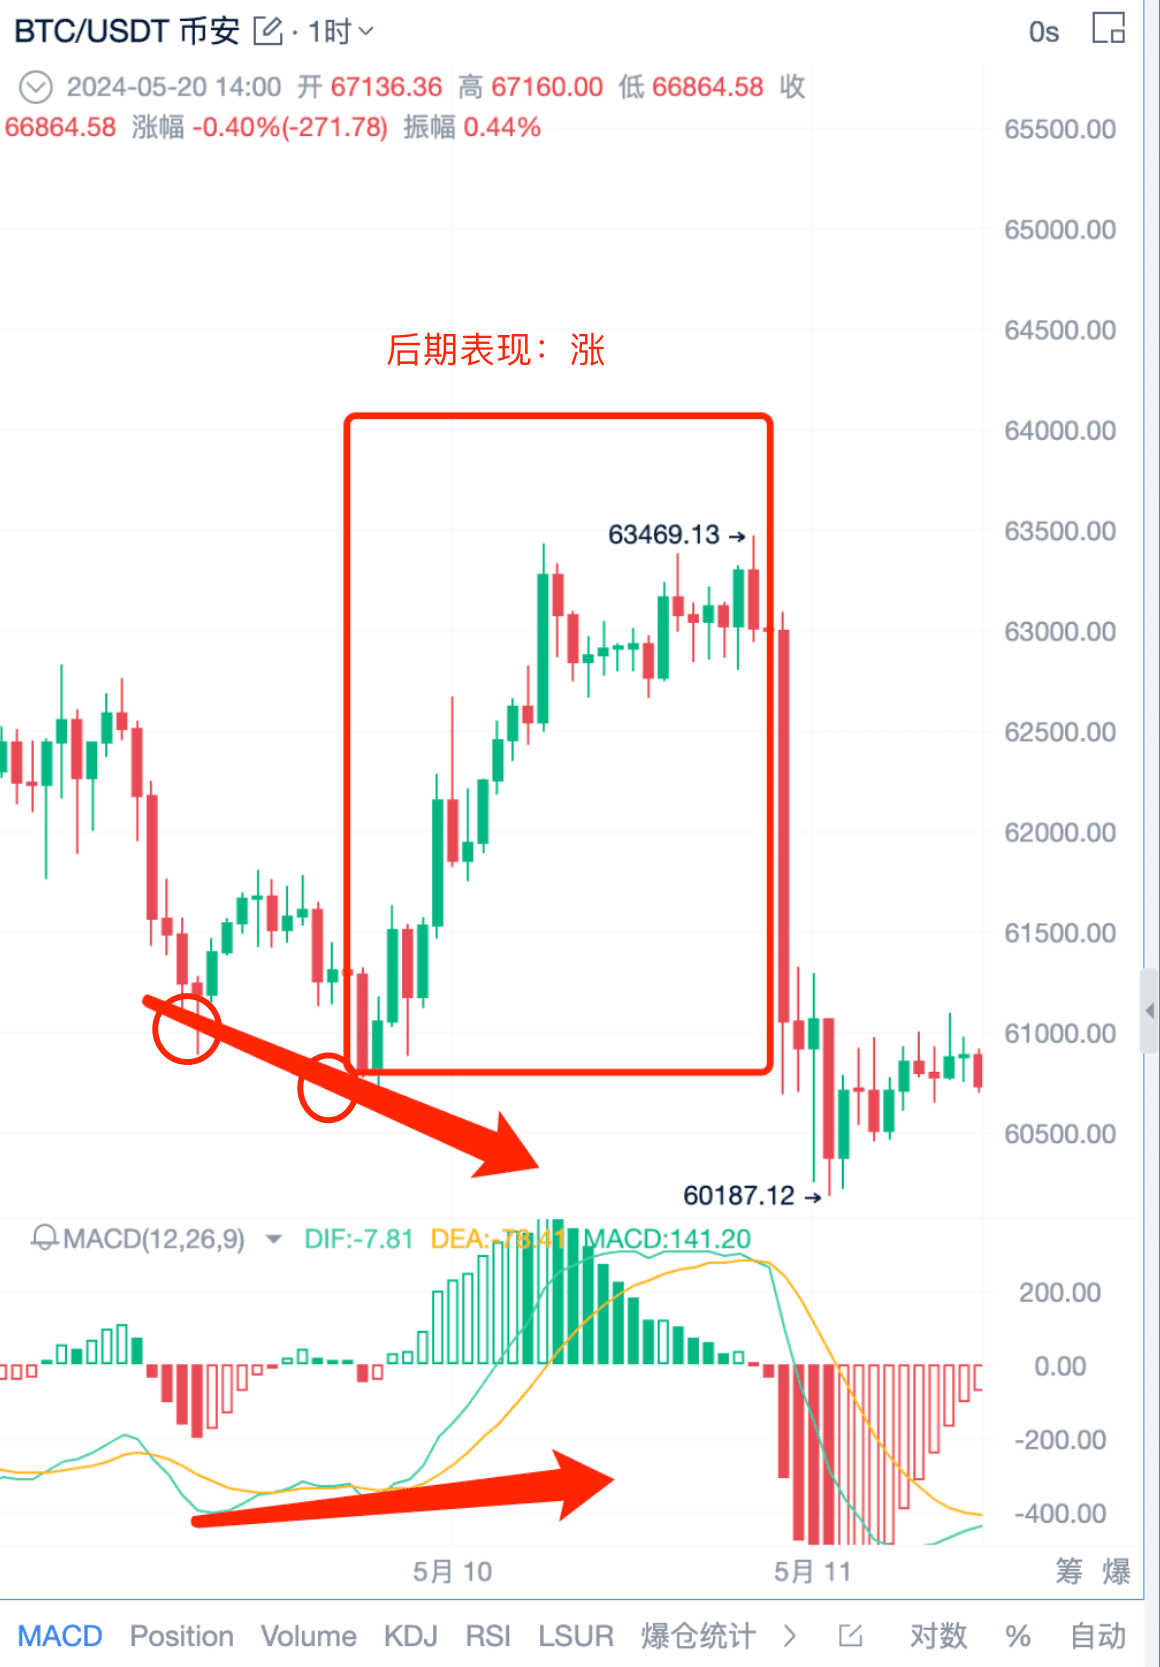
2. MACD Bullish Divergence
When the low point of the price is lower than the previous low, this is a bullish divergence.
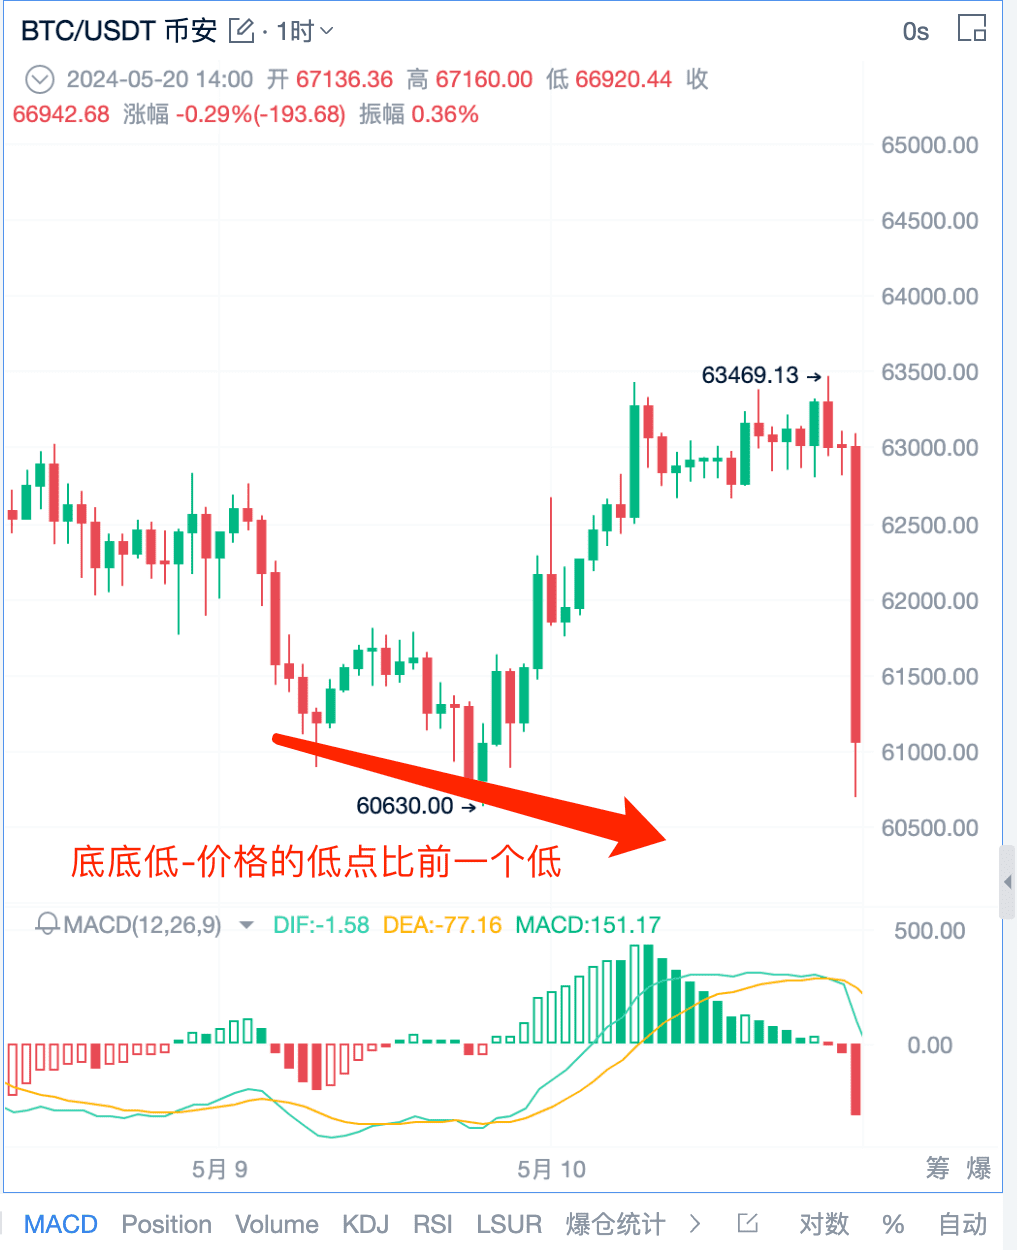
However, the MACD forms a higher low, indicating the intervention of buyers and a gradual weakening of the downward momentum.
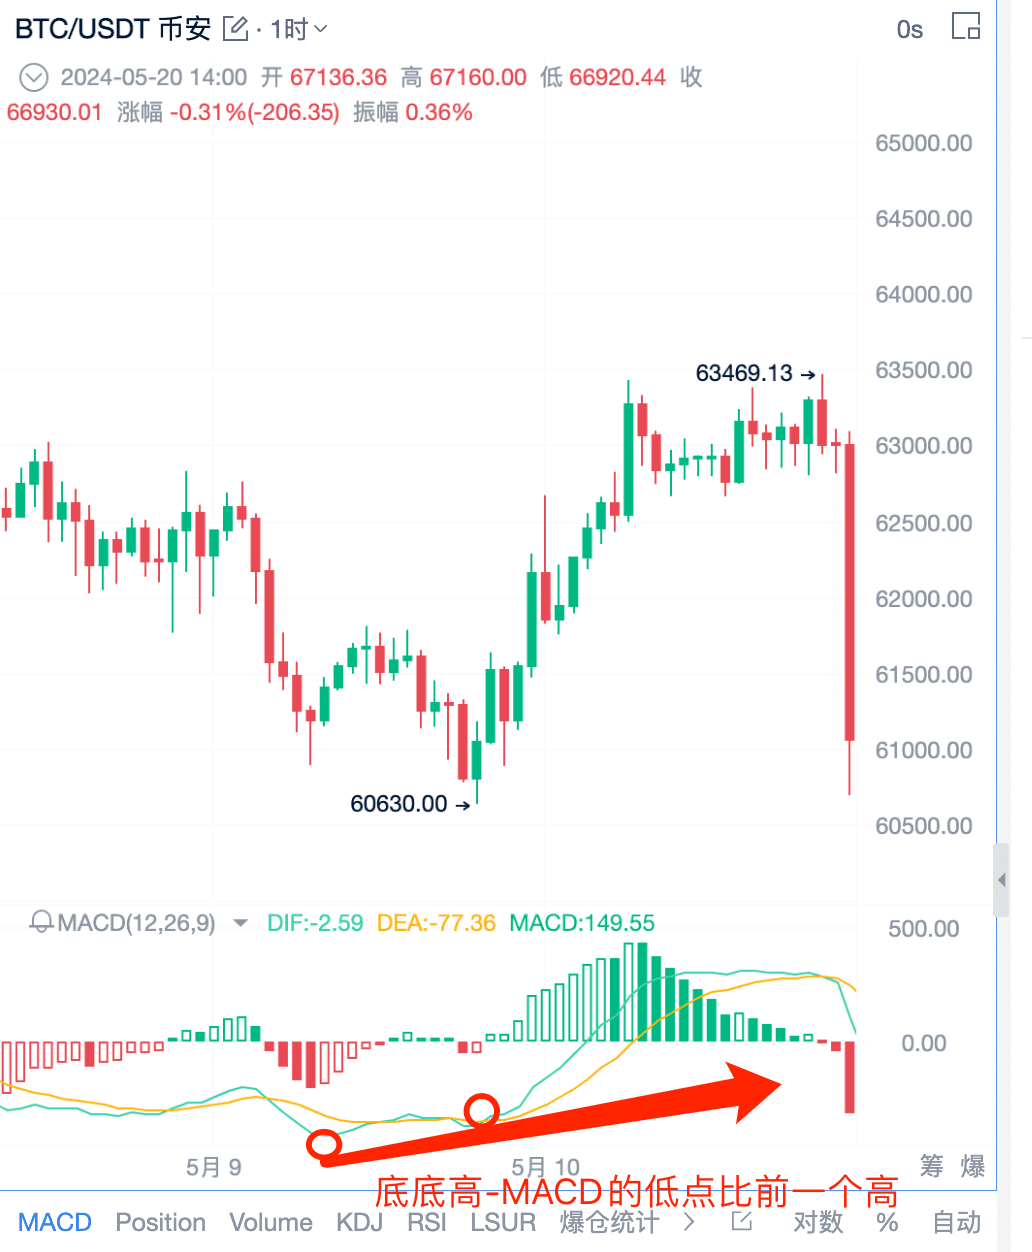
The trend is likely to change from a downtrend to an uptrend. When the price forms a lower low and the MACD forms a higher low, this is a bullish divergence. When a bullish divergence forms, it indicates that the trend is likely to change to an uptrend, presenting a reasonable buying opportunity.
3. MACD Trend Reversal Trading Strategy
Key price level + MACD trend reversal divergence, as long as we find two connected peaks and corresponding two peaks in the bottom MACD.
The first step is to determine the key support level. We can see that the price has tested this support level multiple times and then experienced a significant rise, making it a key support level. When the price returns to this key support level, we can look for a long trading signal.
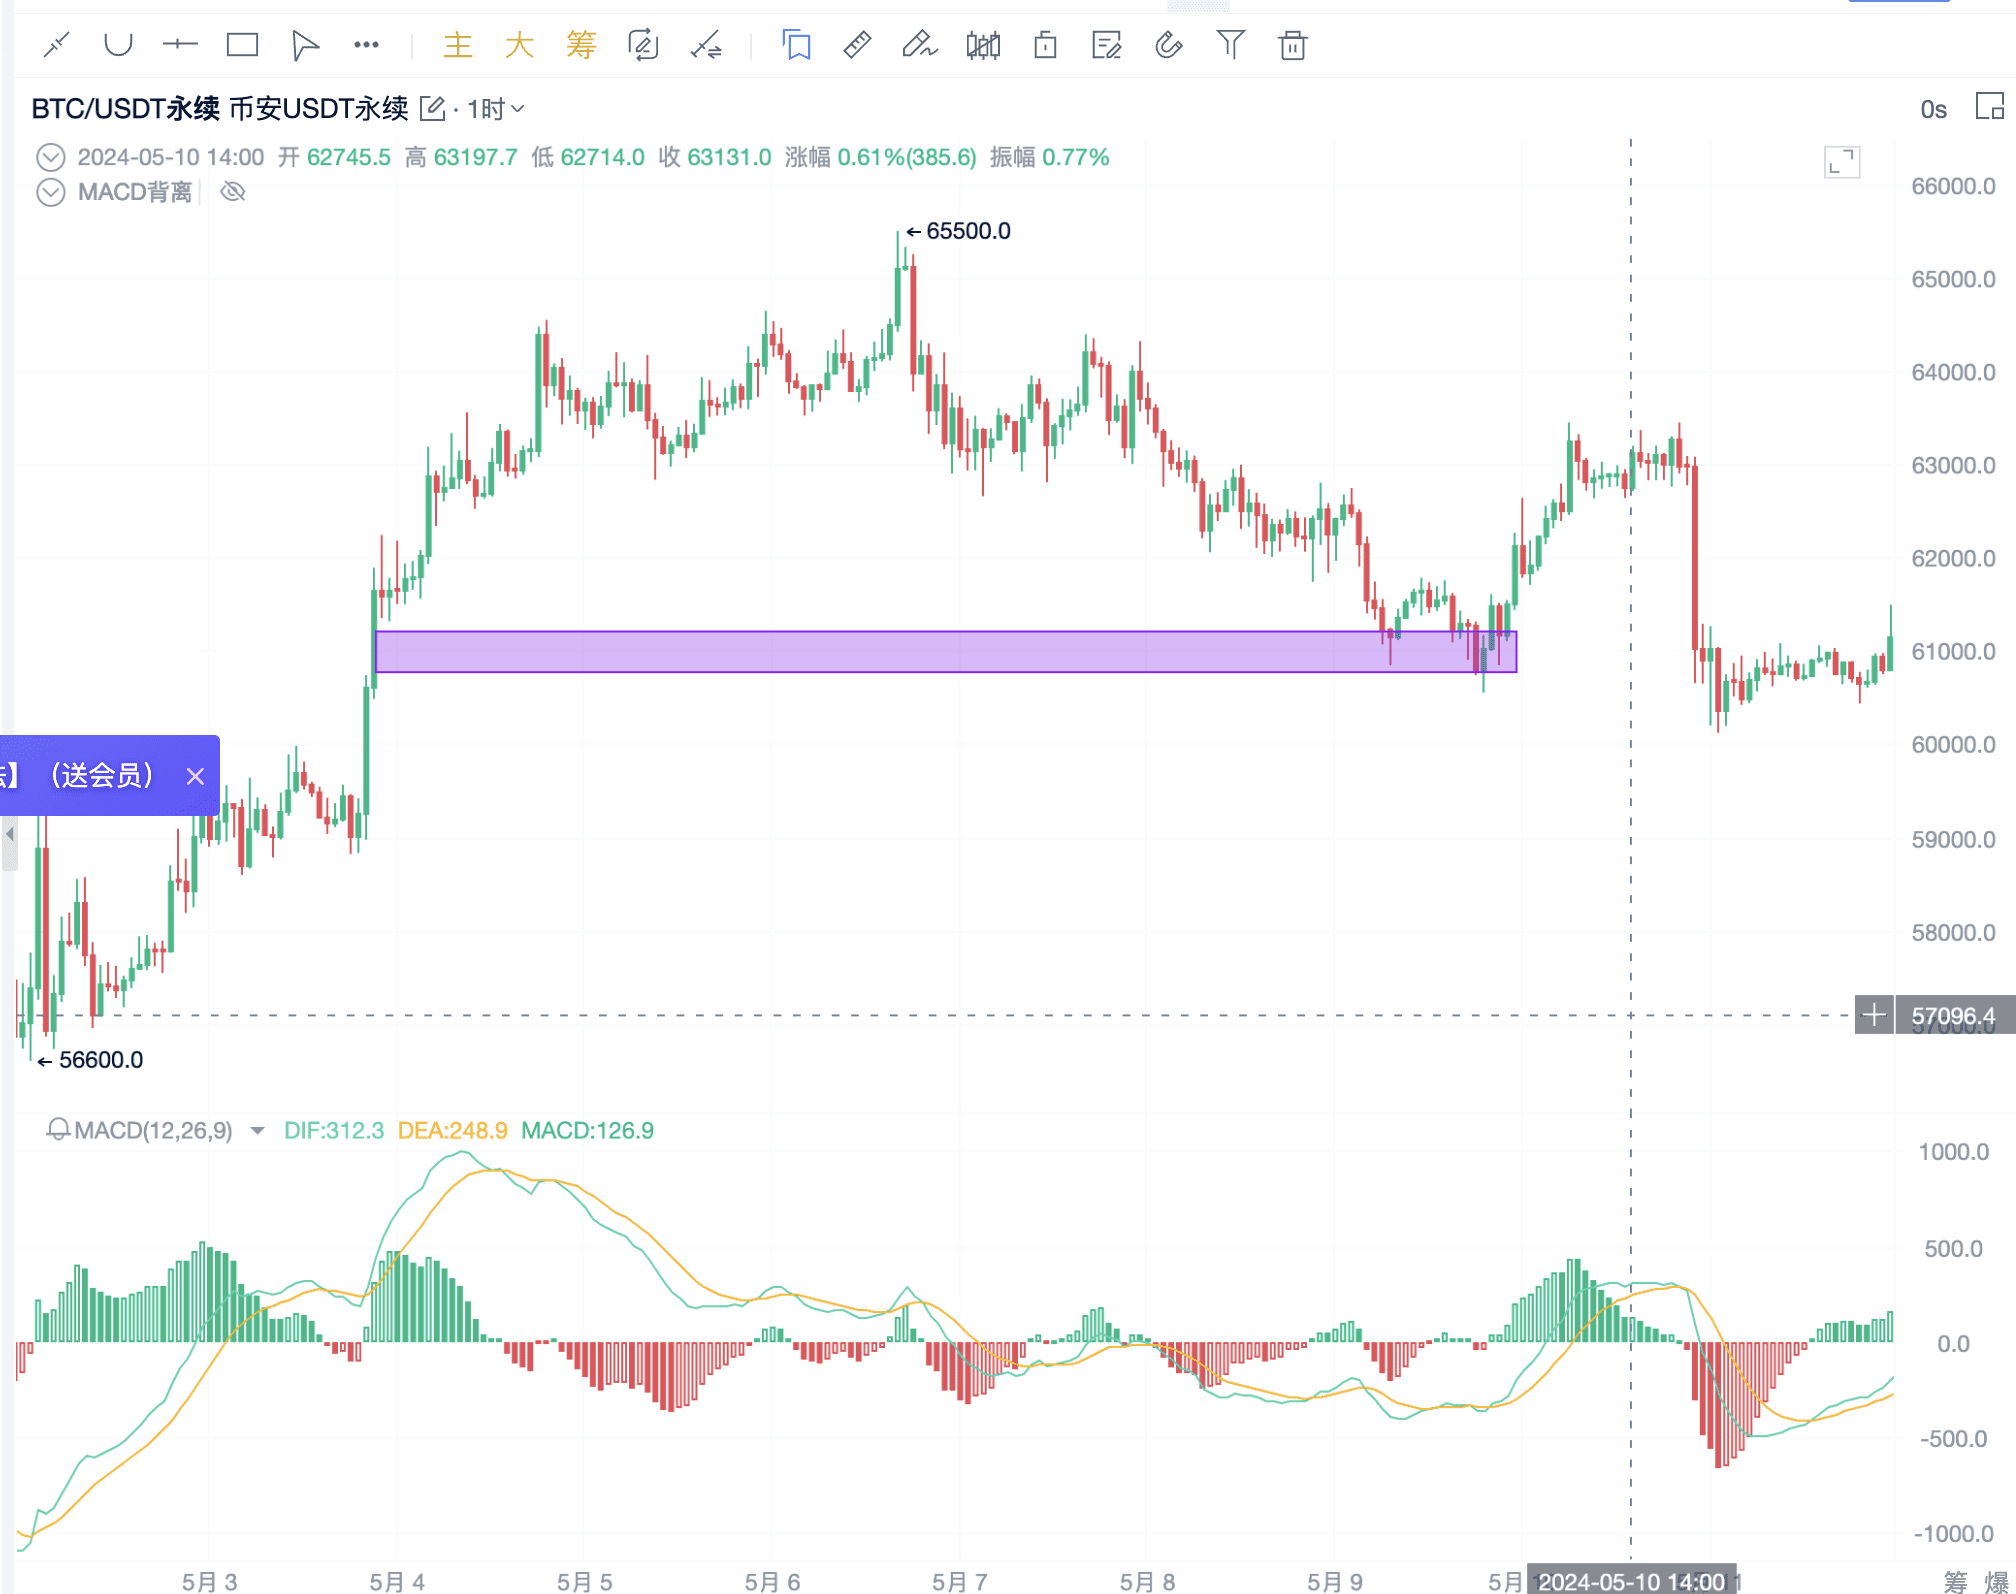
For example, if we find a peak that has gone through a round of ups and downs and returned to the support level.
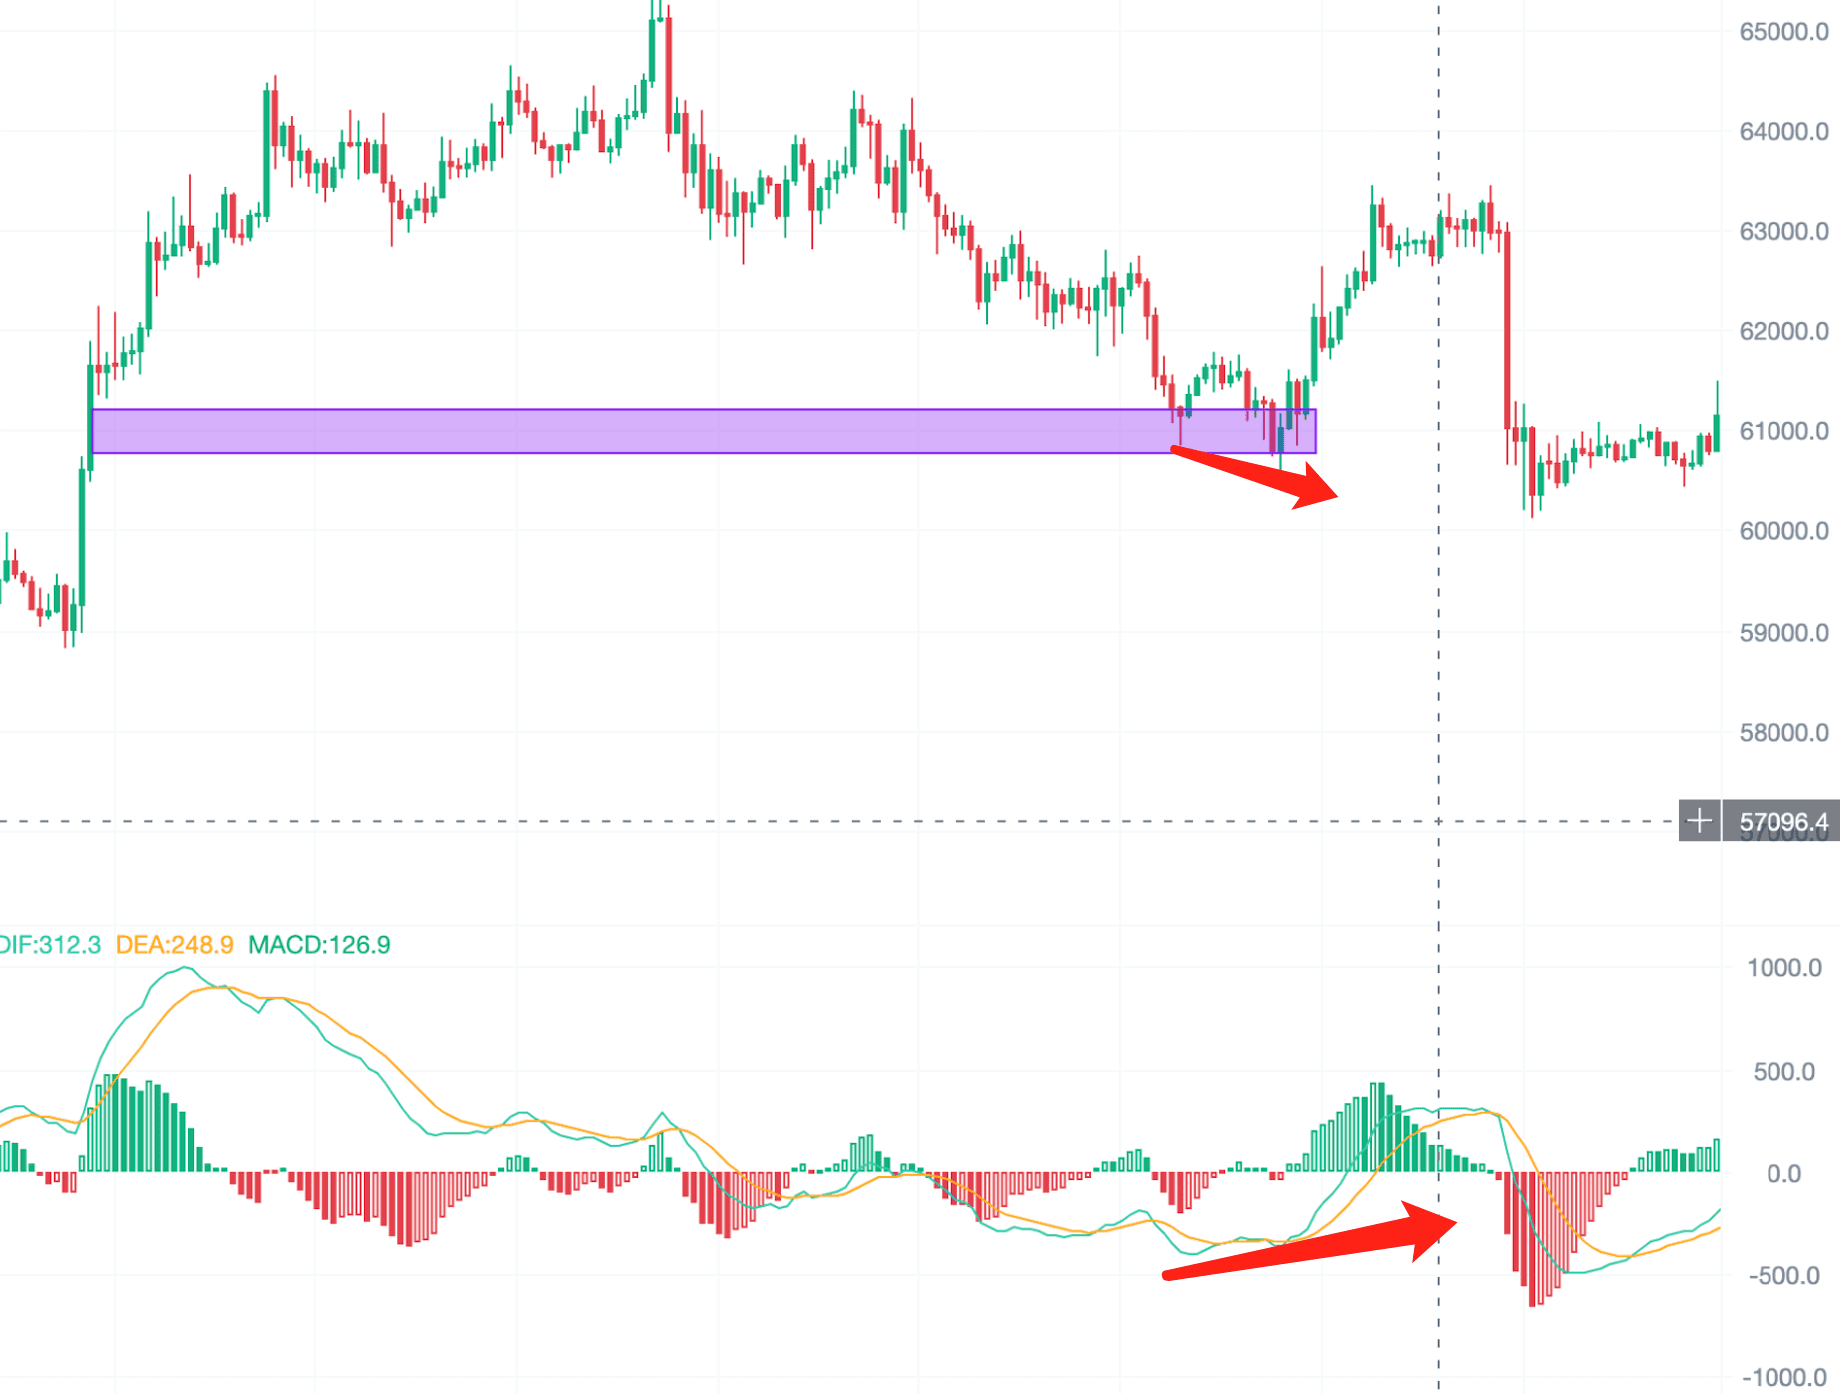
However, we cannot go long at this point. We need another signal to confirm that this bullish divergence is valid. We draw a downtrend line here.
This is a bullish chart pattern. When the price breaks through this descending wedge triangle, we can enter a long position.
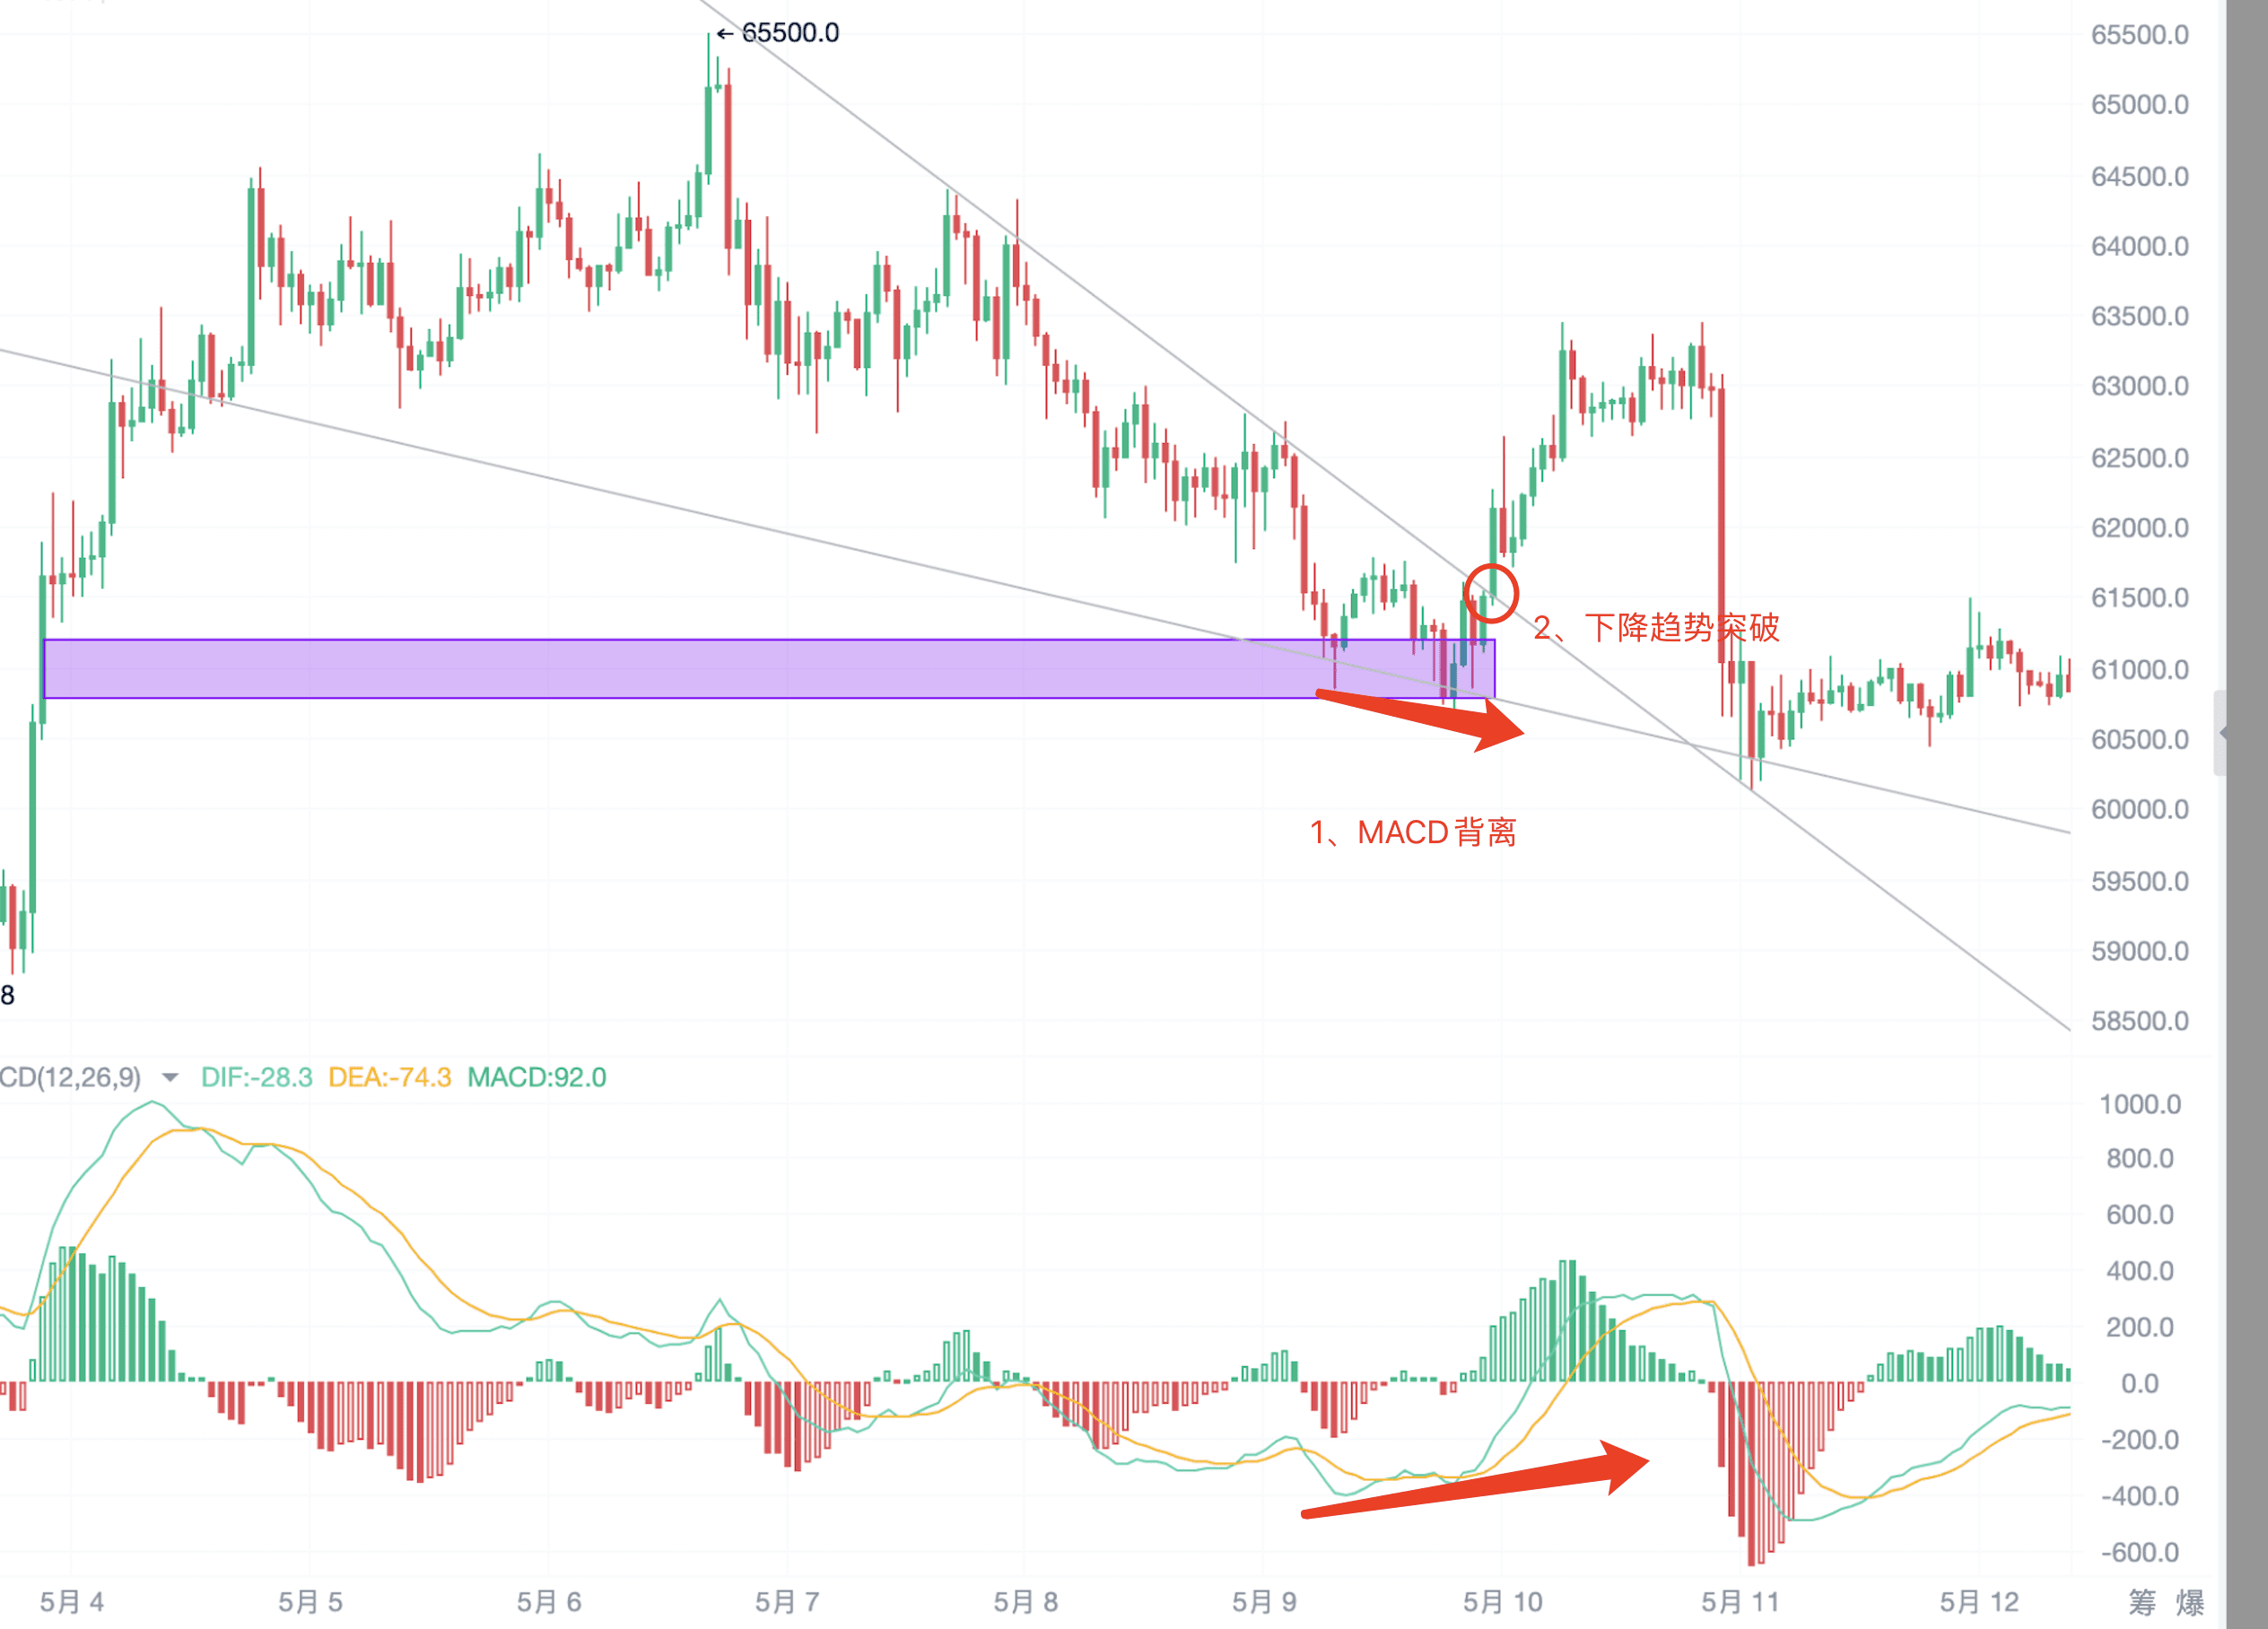
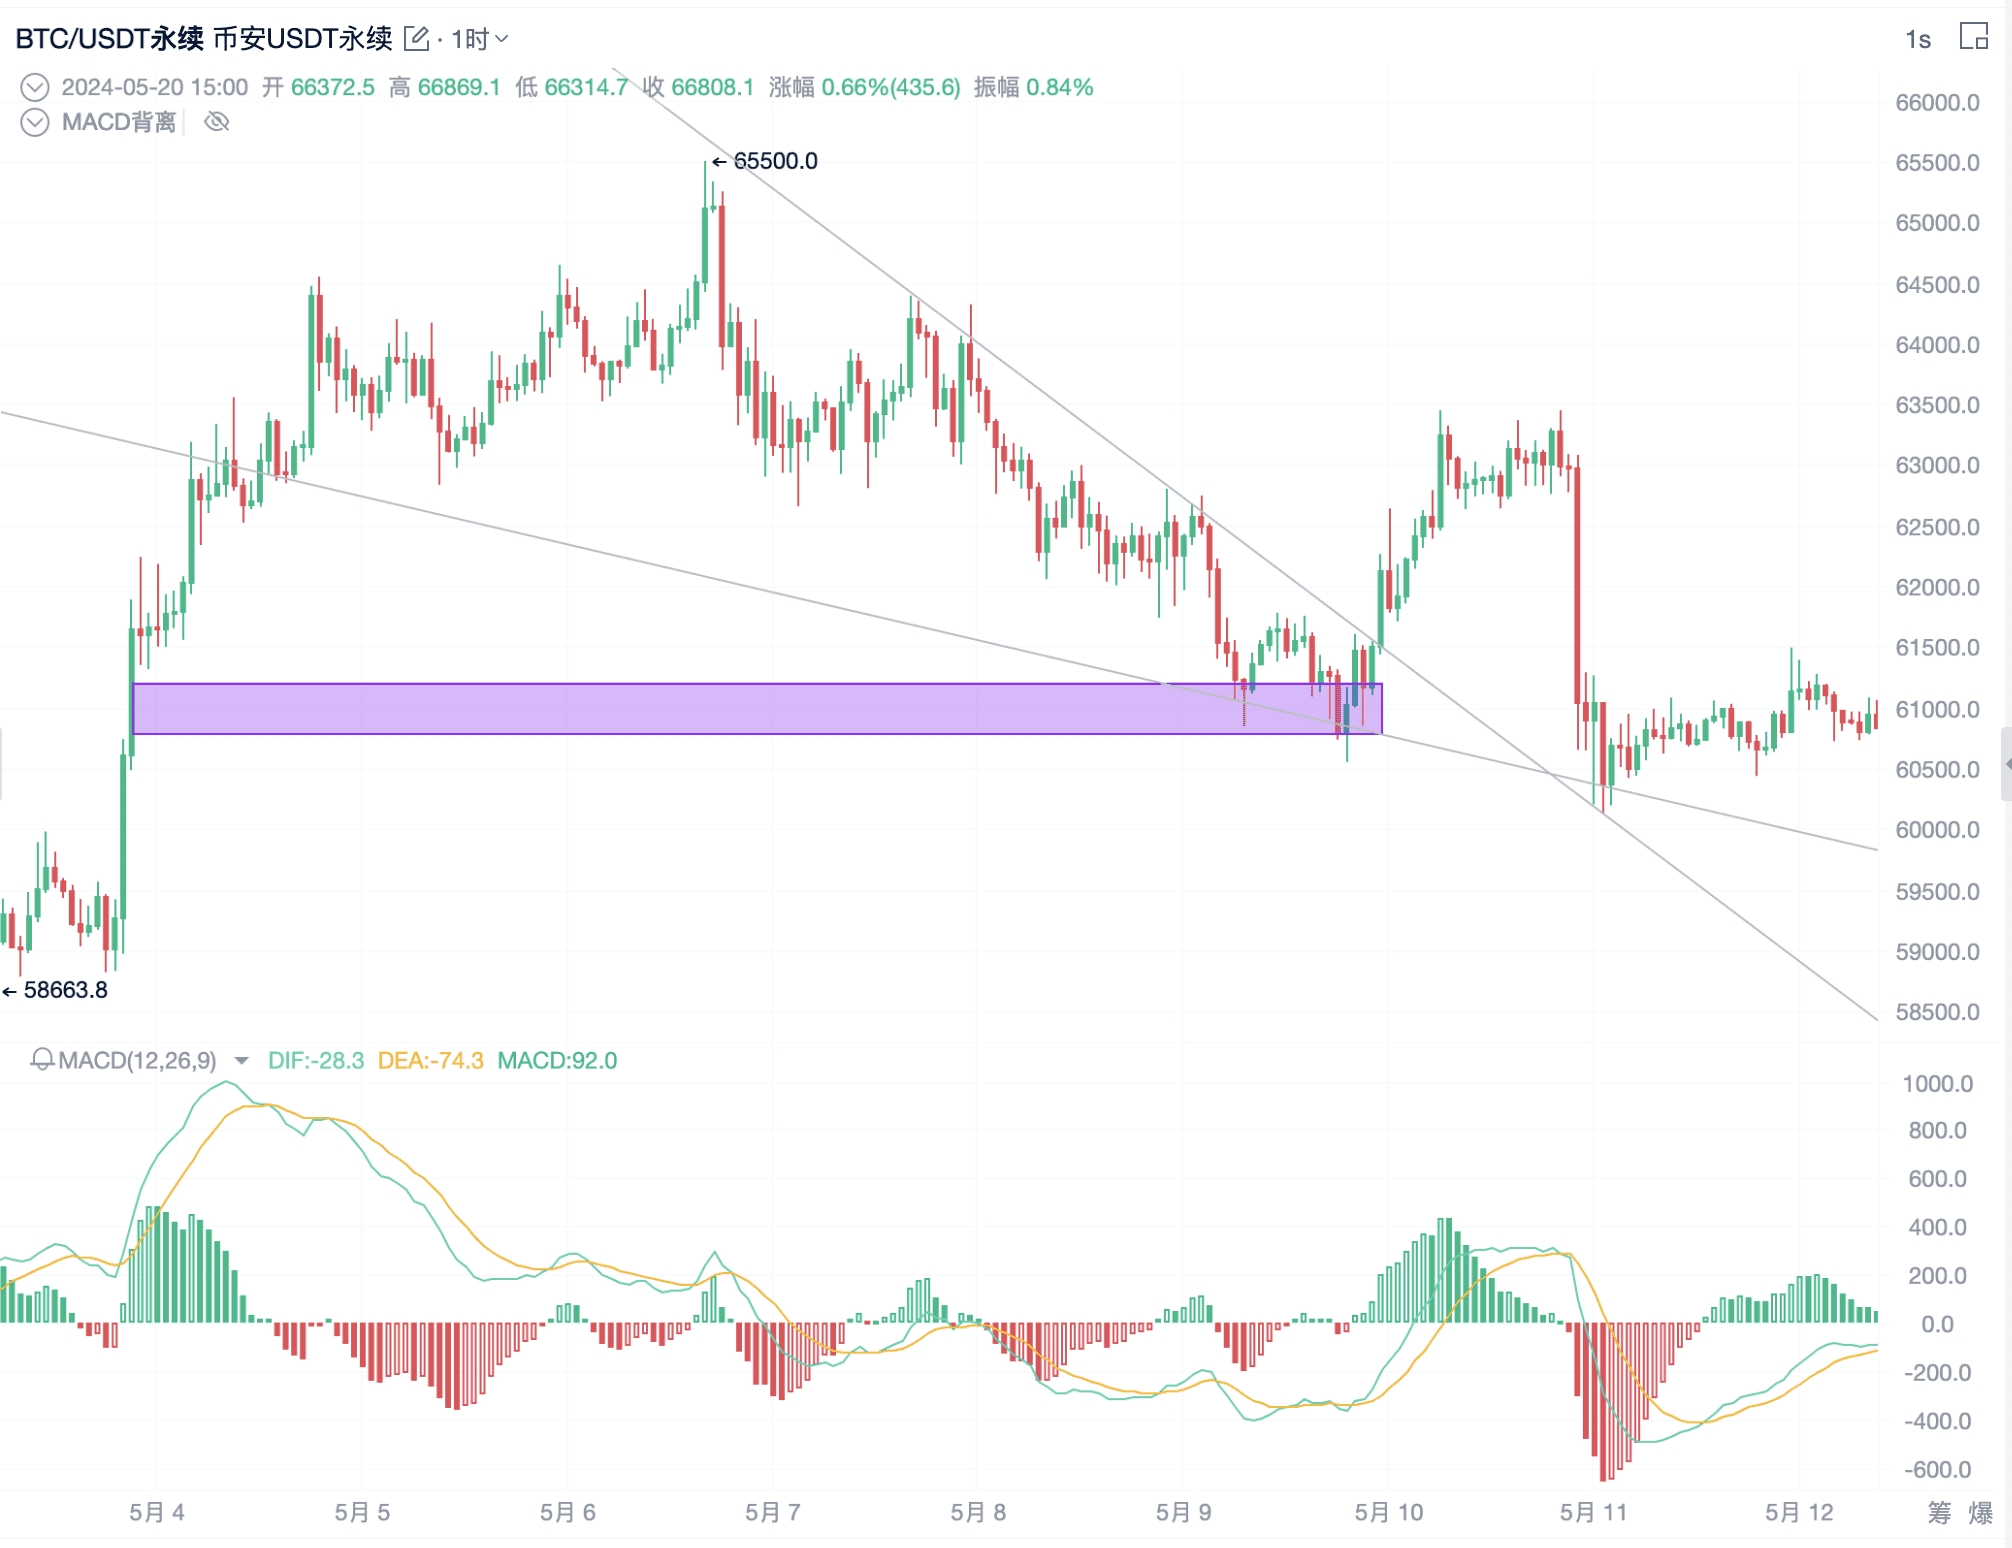
Meeting these two conditions, breaking the downtrend line, can be considered for a long position. Alternatively, we can draw a line at the previous high in the downtrend. When the price breaks the previous high, it indicates a trend reversal. The price is likely to change from a downtrend to an uptrend, and we can enter a long position after the price breaks the previous high. In short, it is about: key price level + MACD trend reversal divergence.
4. How to Find Support Levels?
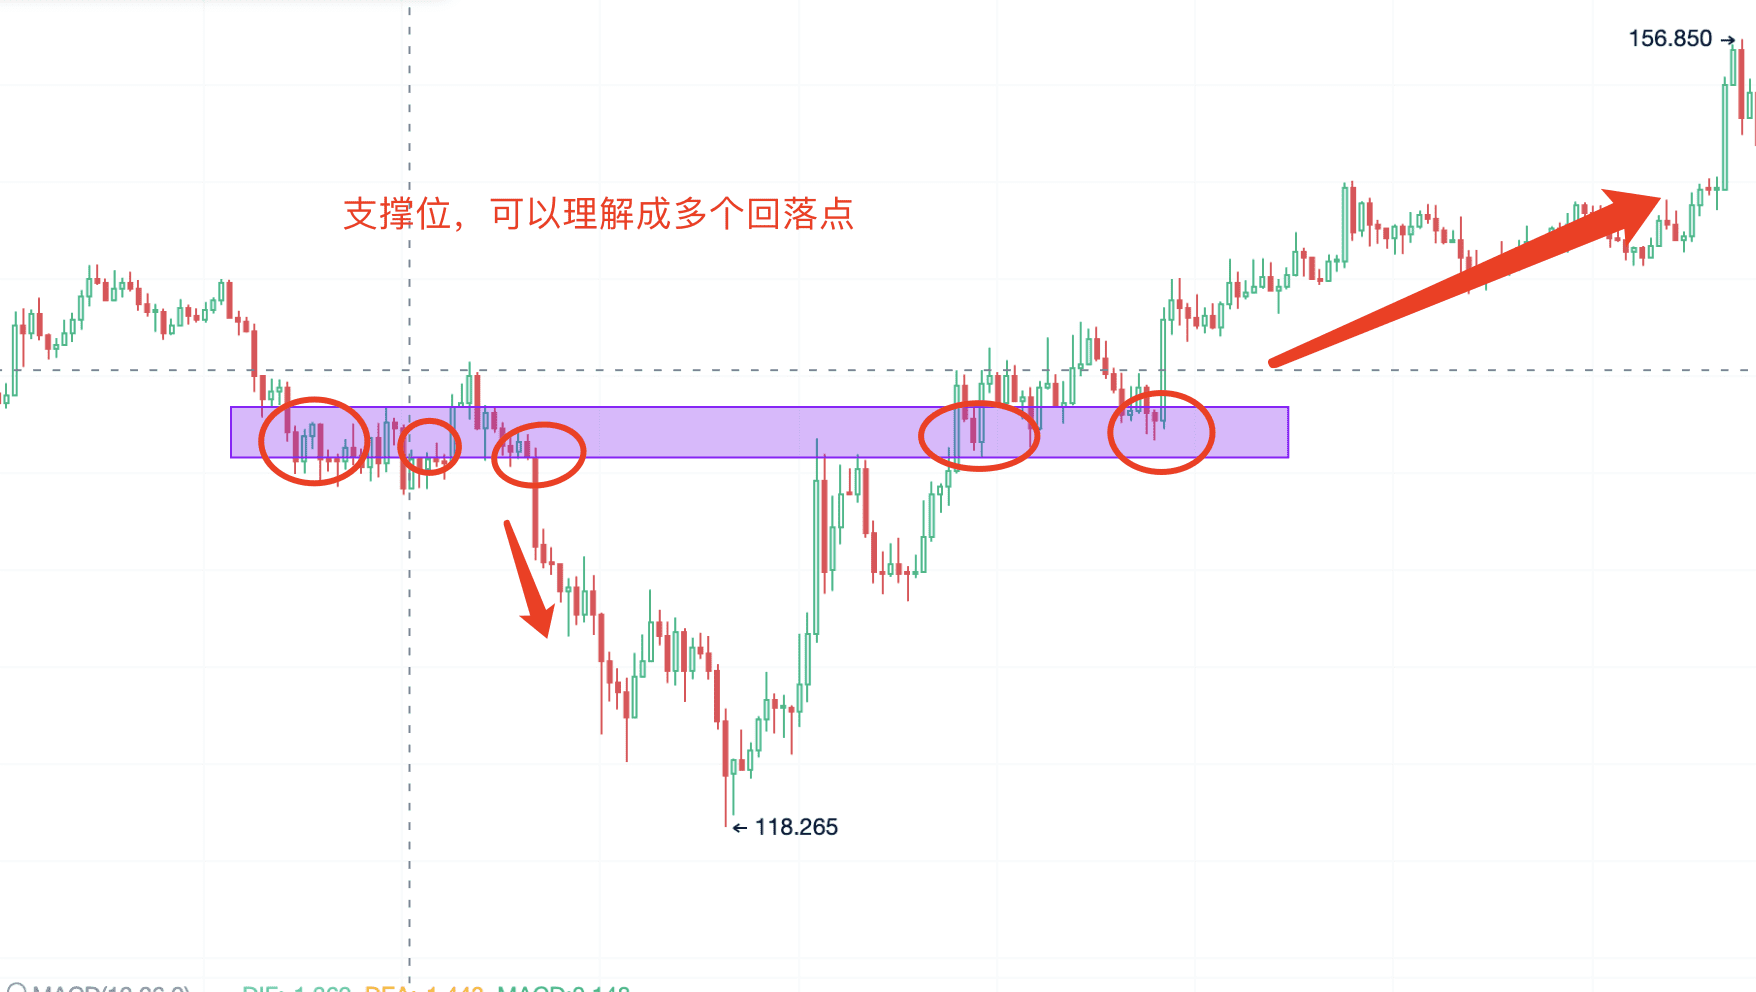
Support levels can be understood as multiple retracement points, forming valleys or peaks, with multiple retracements at the foot of the mountain. It can be a small range of prices or a specific point. What we just discussed is MACD divergence + key price level. The key price level is whether this support level has been broken.
PRO members and signal alert members are premium tools tailored for lazy friends, and custom indicators can help any AICoin user to plan their trades and trade their plans. If you want to see more custom indicator strategy demonstrations and multiple alert reminders, feel free to subscribe to the Signal Alert/PRO K-line version, both of which offer a limited-time free trial of the custom indicator membership. Click the link below to subscribe and experience: https://aicoin.com/en/vip/chartpro
Recommended Reading
For more live broadcast content, please follow the AICoin "News/Information-Live Review" section, and feel free to download the AICoin PC-end app.
免责声明:本文章仅代表作者个人观点,不代表本平台的立场和观点。本文章仅供信息分享,不构成对任何人的任何投资建议。用户与作者之间的任何争议,与本平台无关。如网页中刊载的文章或图片涉及侵权,请提供相关的权利证明和身份证明发送邮件到support@aicoin.com,本平台相关工作人员将会进行核查。


