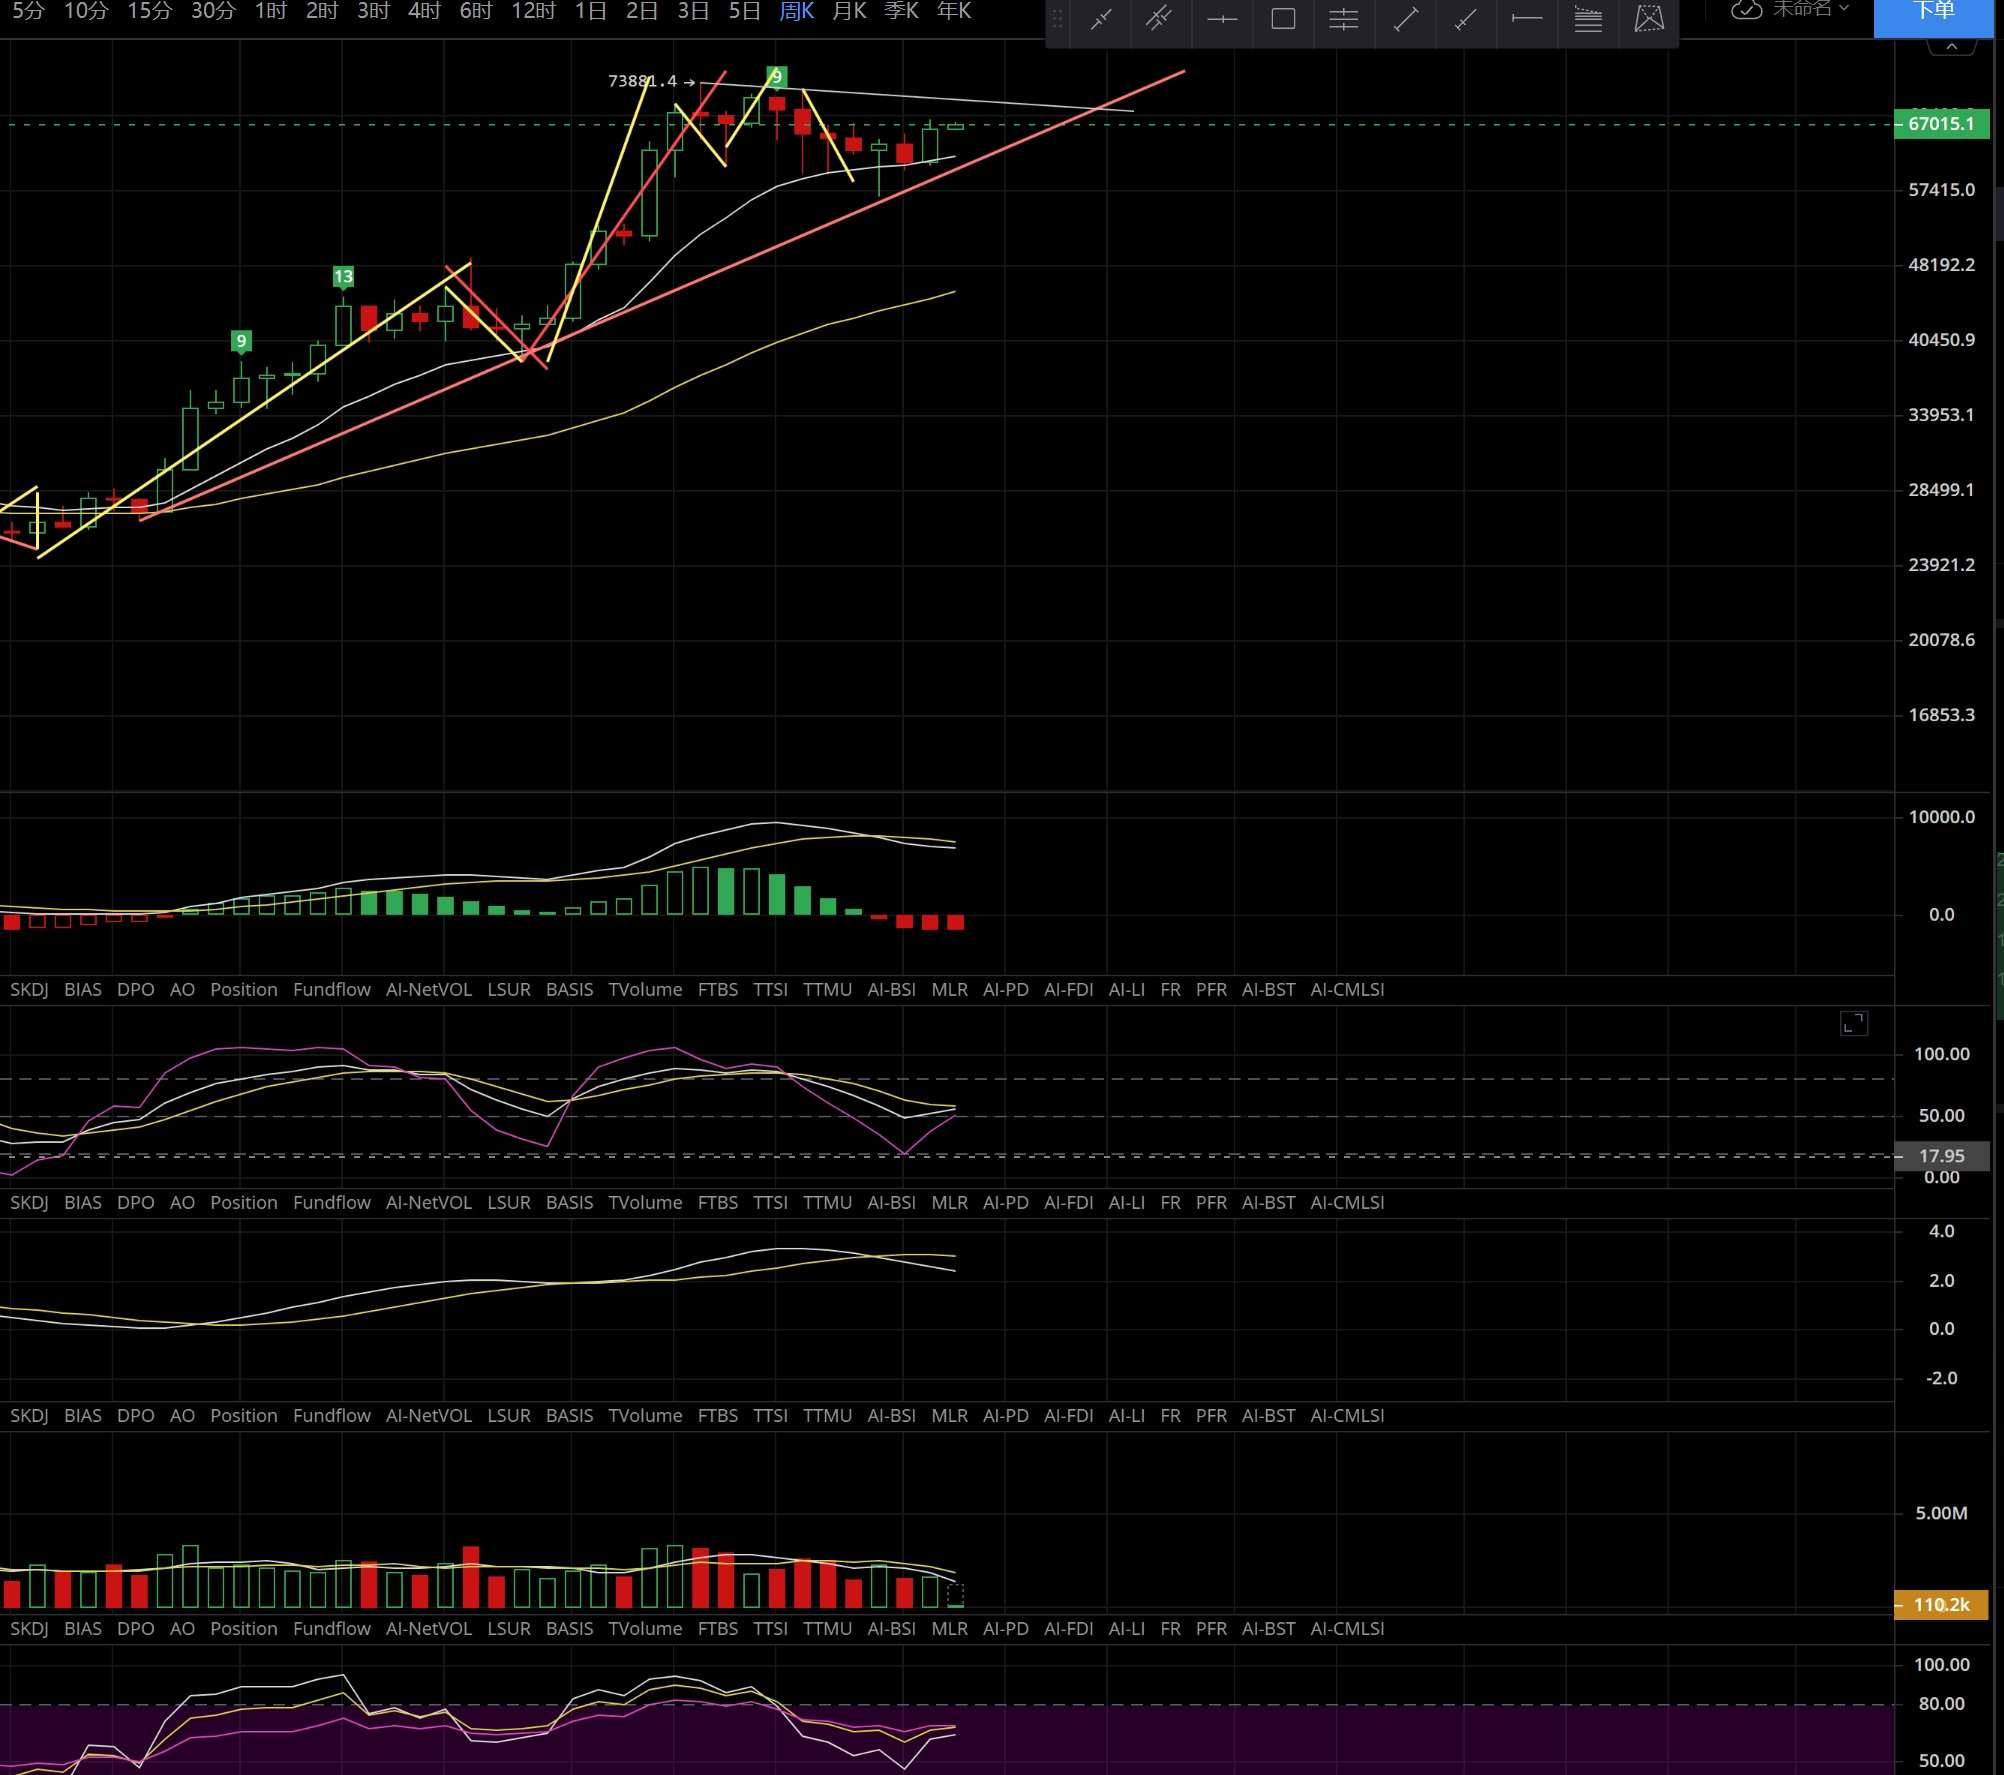
BTC has changed its weekly chart today. The selling pressure on the weekly chart has weakened a lot this week, but it has not turned stronger. The three-day chart has just turned into a weak bullish trend, but the daily chart is currently bullish, but it is already critical. Even if there is a rally in the future, it will not last long, so there will be another period of volatility in the short term. As for ETH, the indicators on the weekly chart have accelerated the adjustment, which also means that there will be a rebound in the weekly chart in the future, which may take about 1-3 weeks. However, due to the accelerated smashing of the indicators on the weekly chart, it still needs to be observed whether it can last long. Many friends have been trapped in a lot of altcoins. Everyone should pay attention to the rebound of ETH in the future. The short-term support for the overall market is at 65500-63500-60900, and the resistance is at 67800-70800-75000. The support for ETH is at 3020-2885, and the resistance is at 3150-3280-3680.

You can also follow my official account to get ahead of the market trends.

免责声明:本文章仅代表作者个人观点,不代表本平台的立场和观点。本文章仅供信息分享,不构成对任何人的任何投资建议。用户与作者之间的任何争议,与本平台无关。如网页中刊载的文章或图片涉及侵权,请提供相关的权利证明和身份证明发送邮件到support@aicoin.com,本平台相关工作人员将会进行核查。


