On the evening of May 14th, AICoin researchers conducted a live graphic and text sharing session titled "5-Minute BOLL High-Frequency Strategy (Free Membership)" in the AICoin PC-end Group Chat Live. Below is a summary of the live content.
I. Algorithm Sharing
This algorithm utilizes two elements:
First element: 5-minute cycle, which can be considered relatively moderate for short to medium-term and relatively high-frequency trading.
Second element: The strategy includes BOLL and KDJ indicators, which are suitable for playing with 5-minute cycles as they consider both trends and oscillations.
II. Concept Explanation
1. BOLL Indicator
BOLL mainly consists of three elements: upper band, middle band, and lower band.
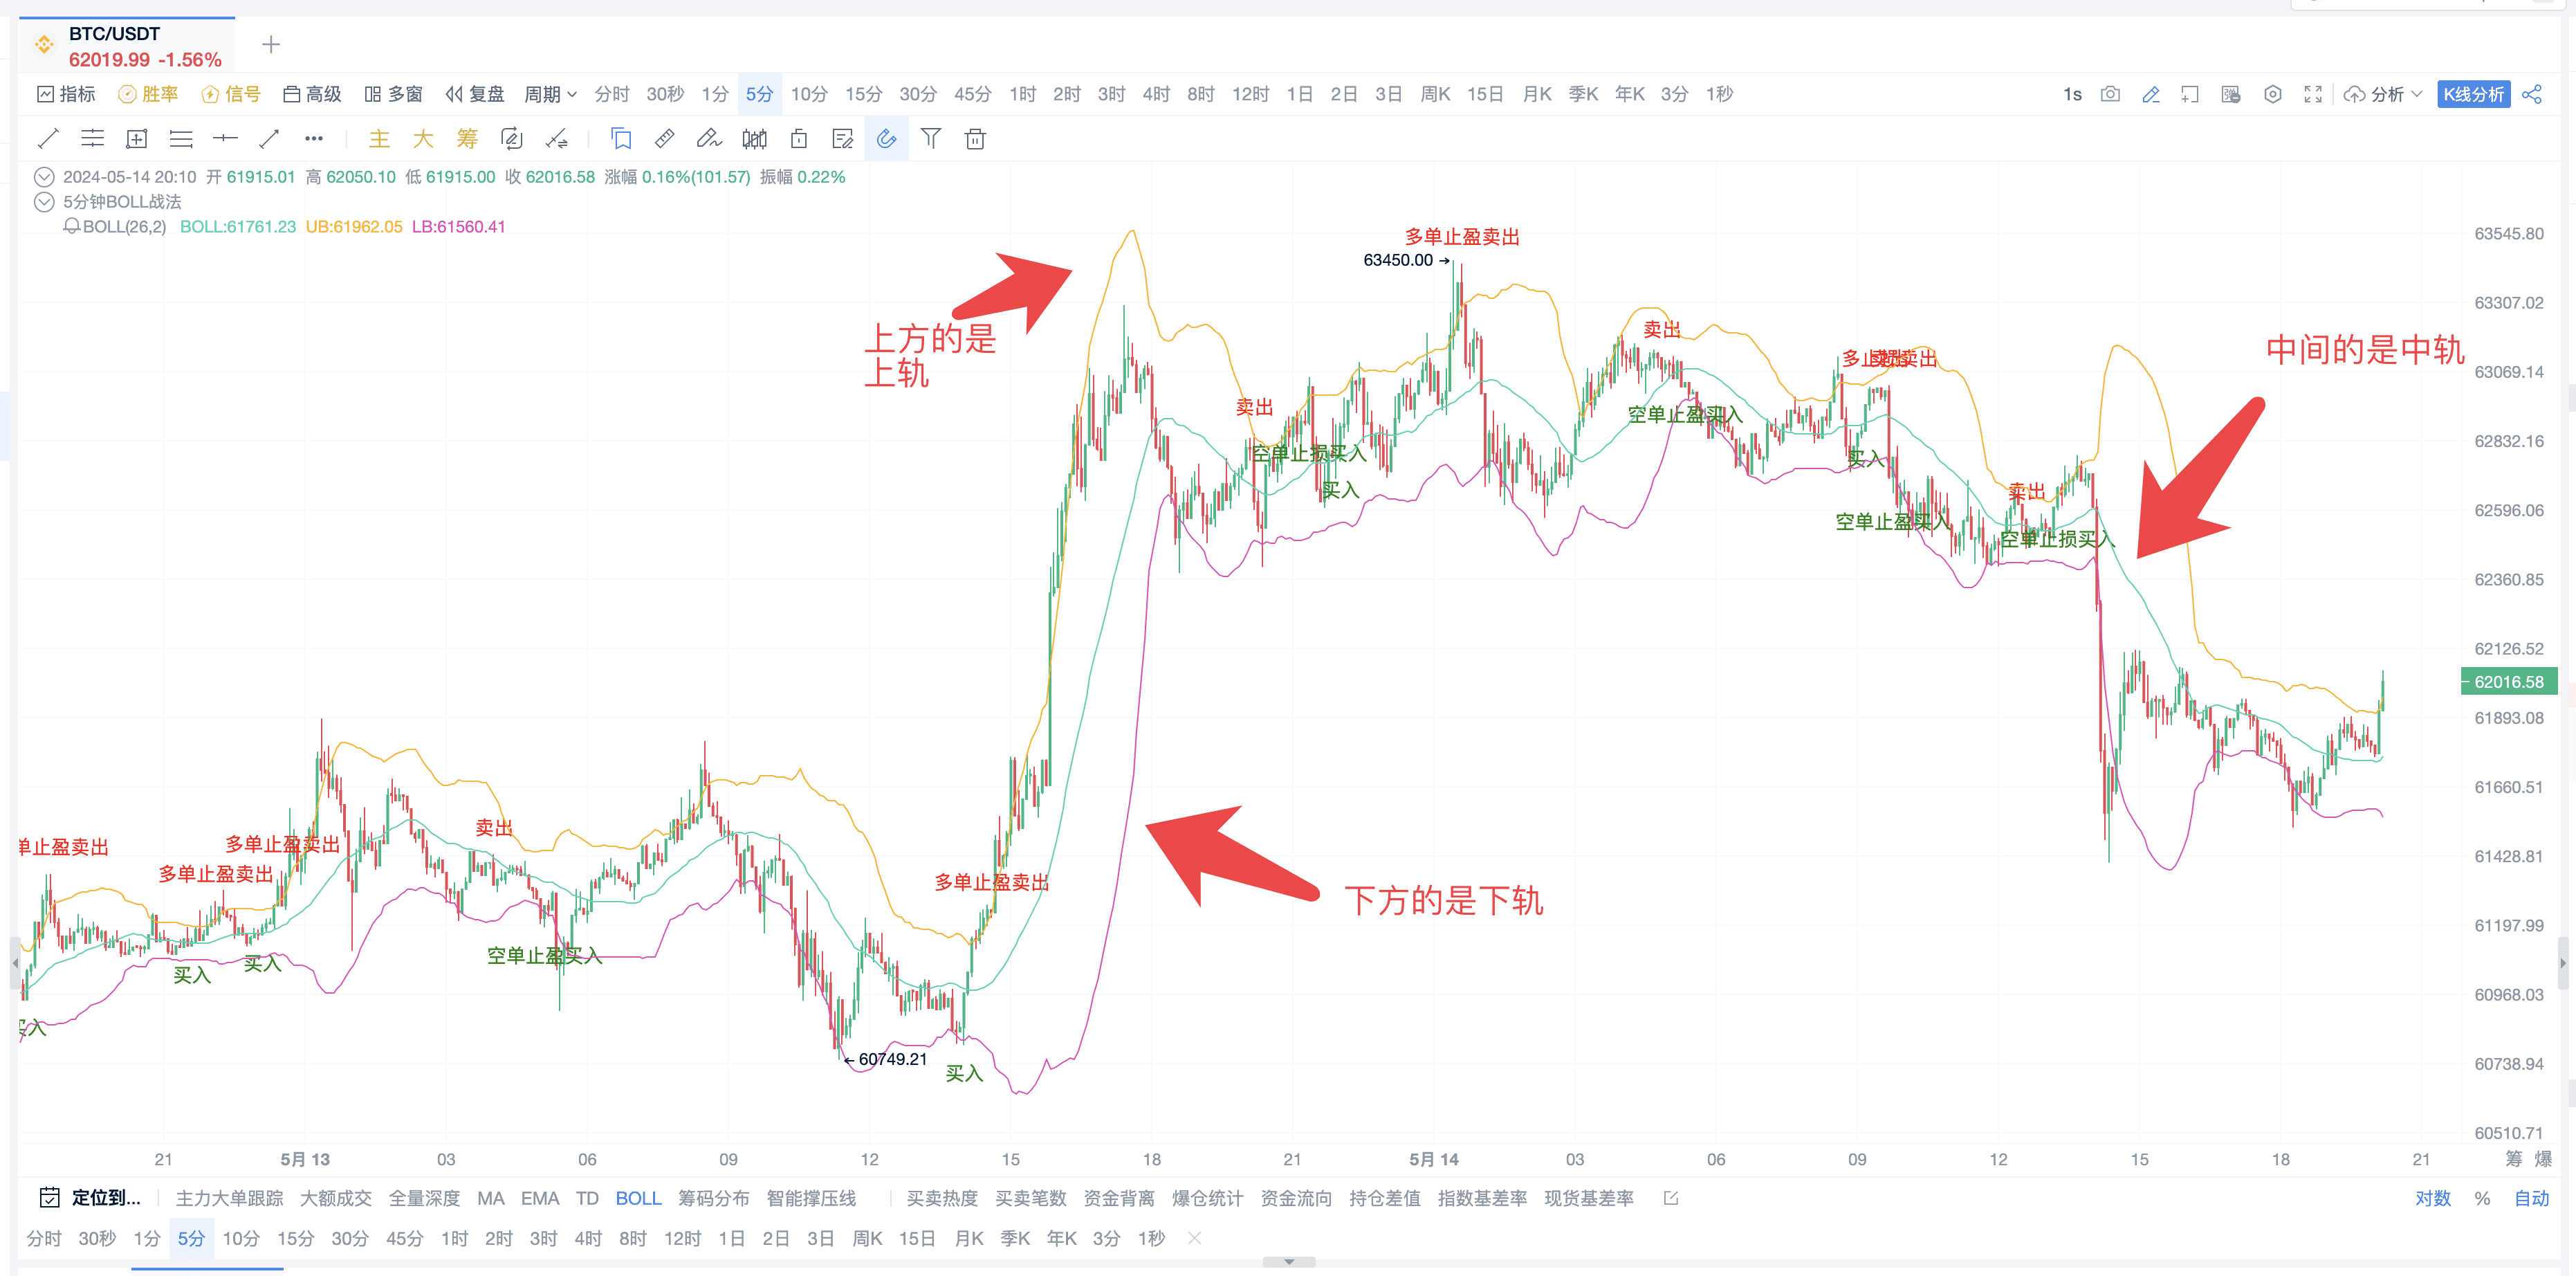
The middle band is formed by MA, so it carries the trend; while the upper and lower bands discern price fluctuations.
(1) Principle
The upper and lower bands represent standard deviation, meaning they reflect price fluctuations. When the bands contract and come close together, it indicates a period of stagnation in the market. Conversely, when the distance between the bands expands, market volatility strengthens, and price action increases.
(2) Role of BOLL (Bollinger Bands):
① Determine price trends (direction of Boll channel movement)
② Read trend strength (overbought and oversold situations)
③ Locate the best entry time (narrowing and expanding of Bollinger Bands)
2. KDJ Indicator
Similarly, KDJ has more lines.
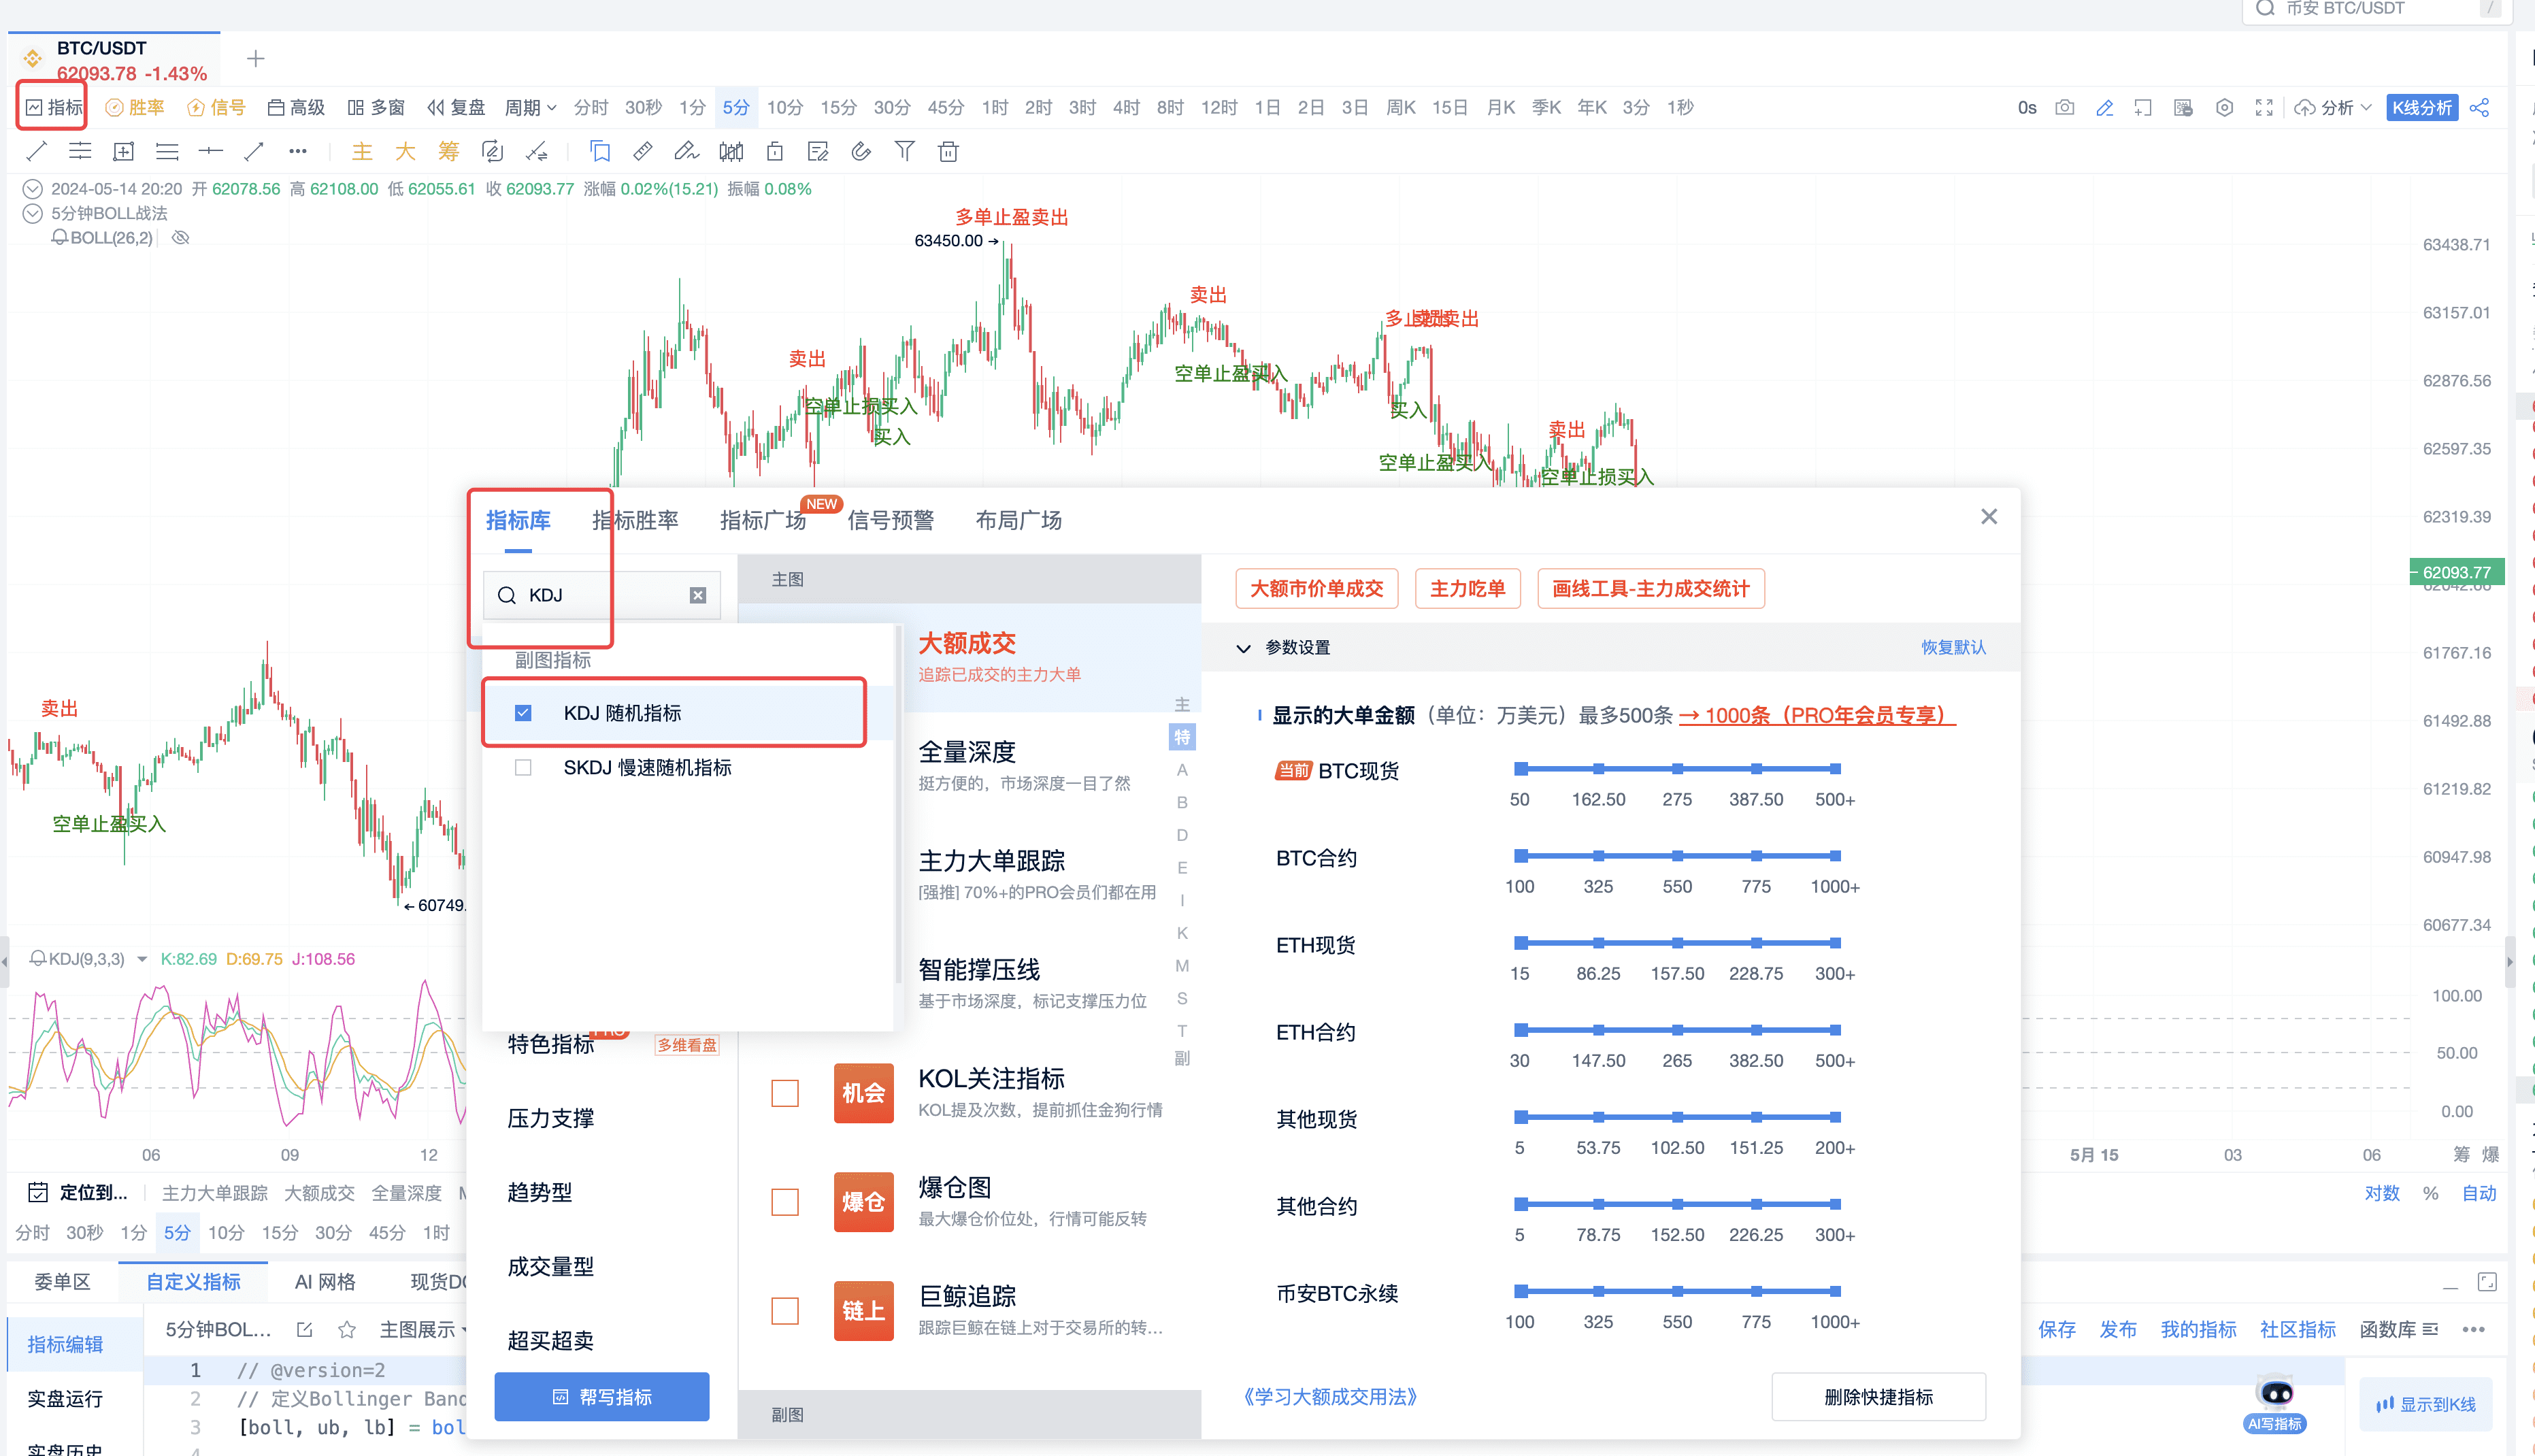
It can be simplified to look at the features: KDJ consists of three lines, namely K line, D line, and J line. Among them, the K line is called the fast confirmation line, the D line is called the slow main line, and the J line is called the direction-sensitive line. Judging from their names, the J line can be used as a reference line for determining trend direction, while K and D can be used as reference lines for entry points.
(1) Principle
KDJ is calculated based on the highest price, lowest price, and closing price. Therefore, it uses the authenticity of price fluctuations to reflect the strength of price fluctuations, overbought and oversold conditions, and provides trading signals before price rises or falls.
(2) Role of KDJ
Used as a trend reference and for determining entry points.
III. Script Decomposition
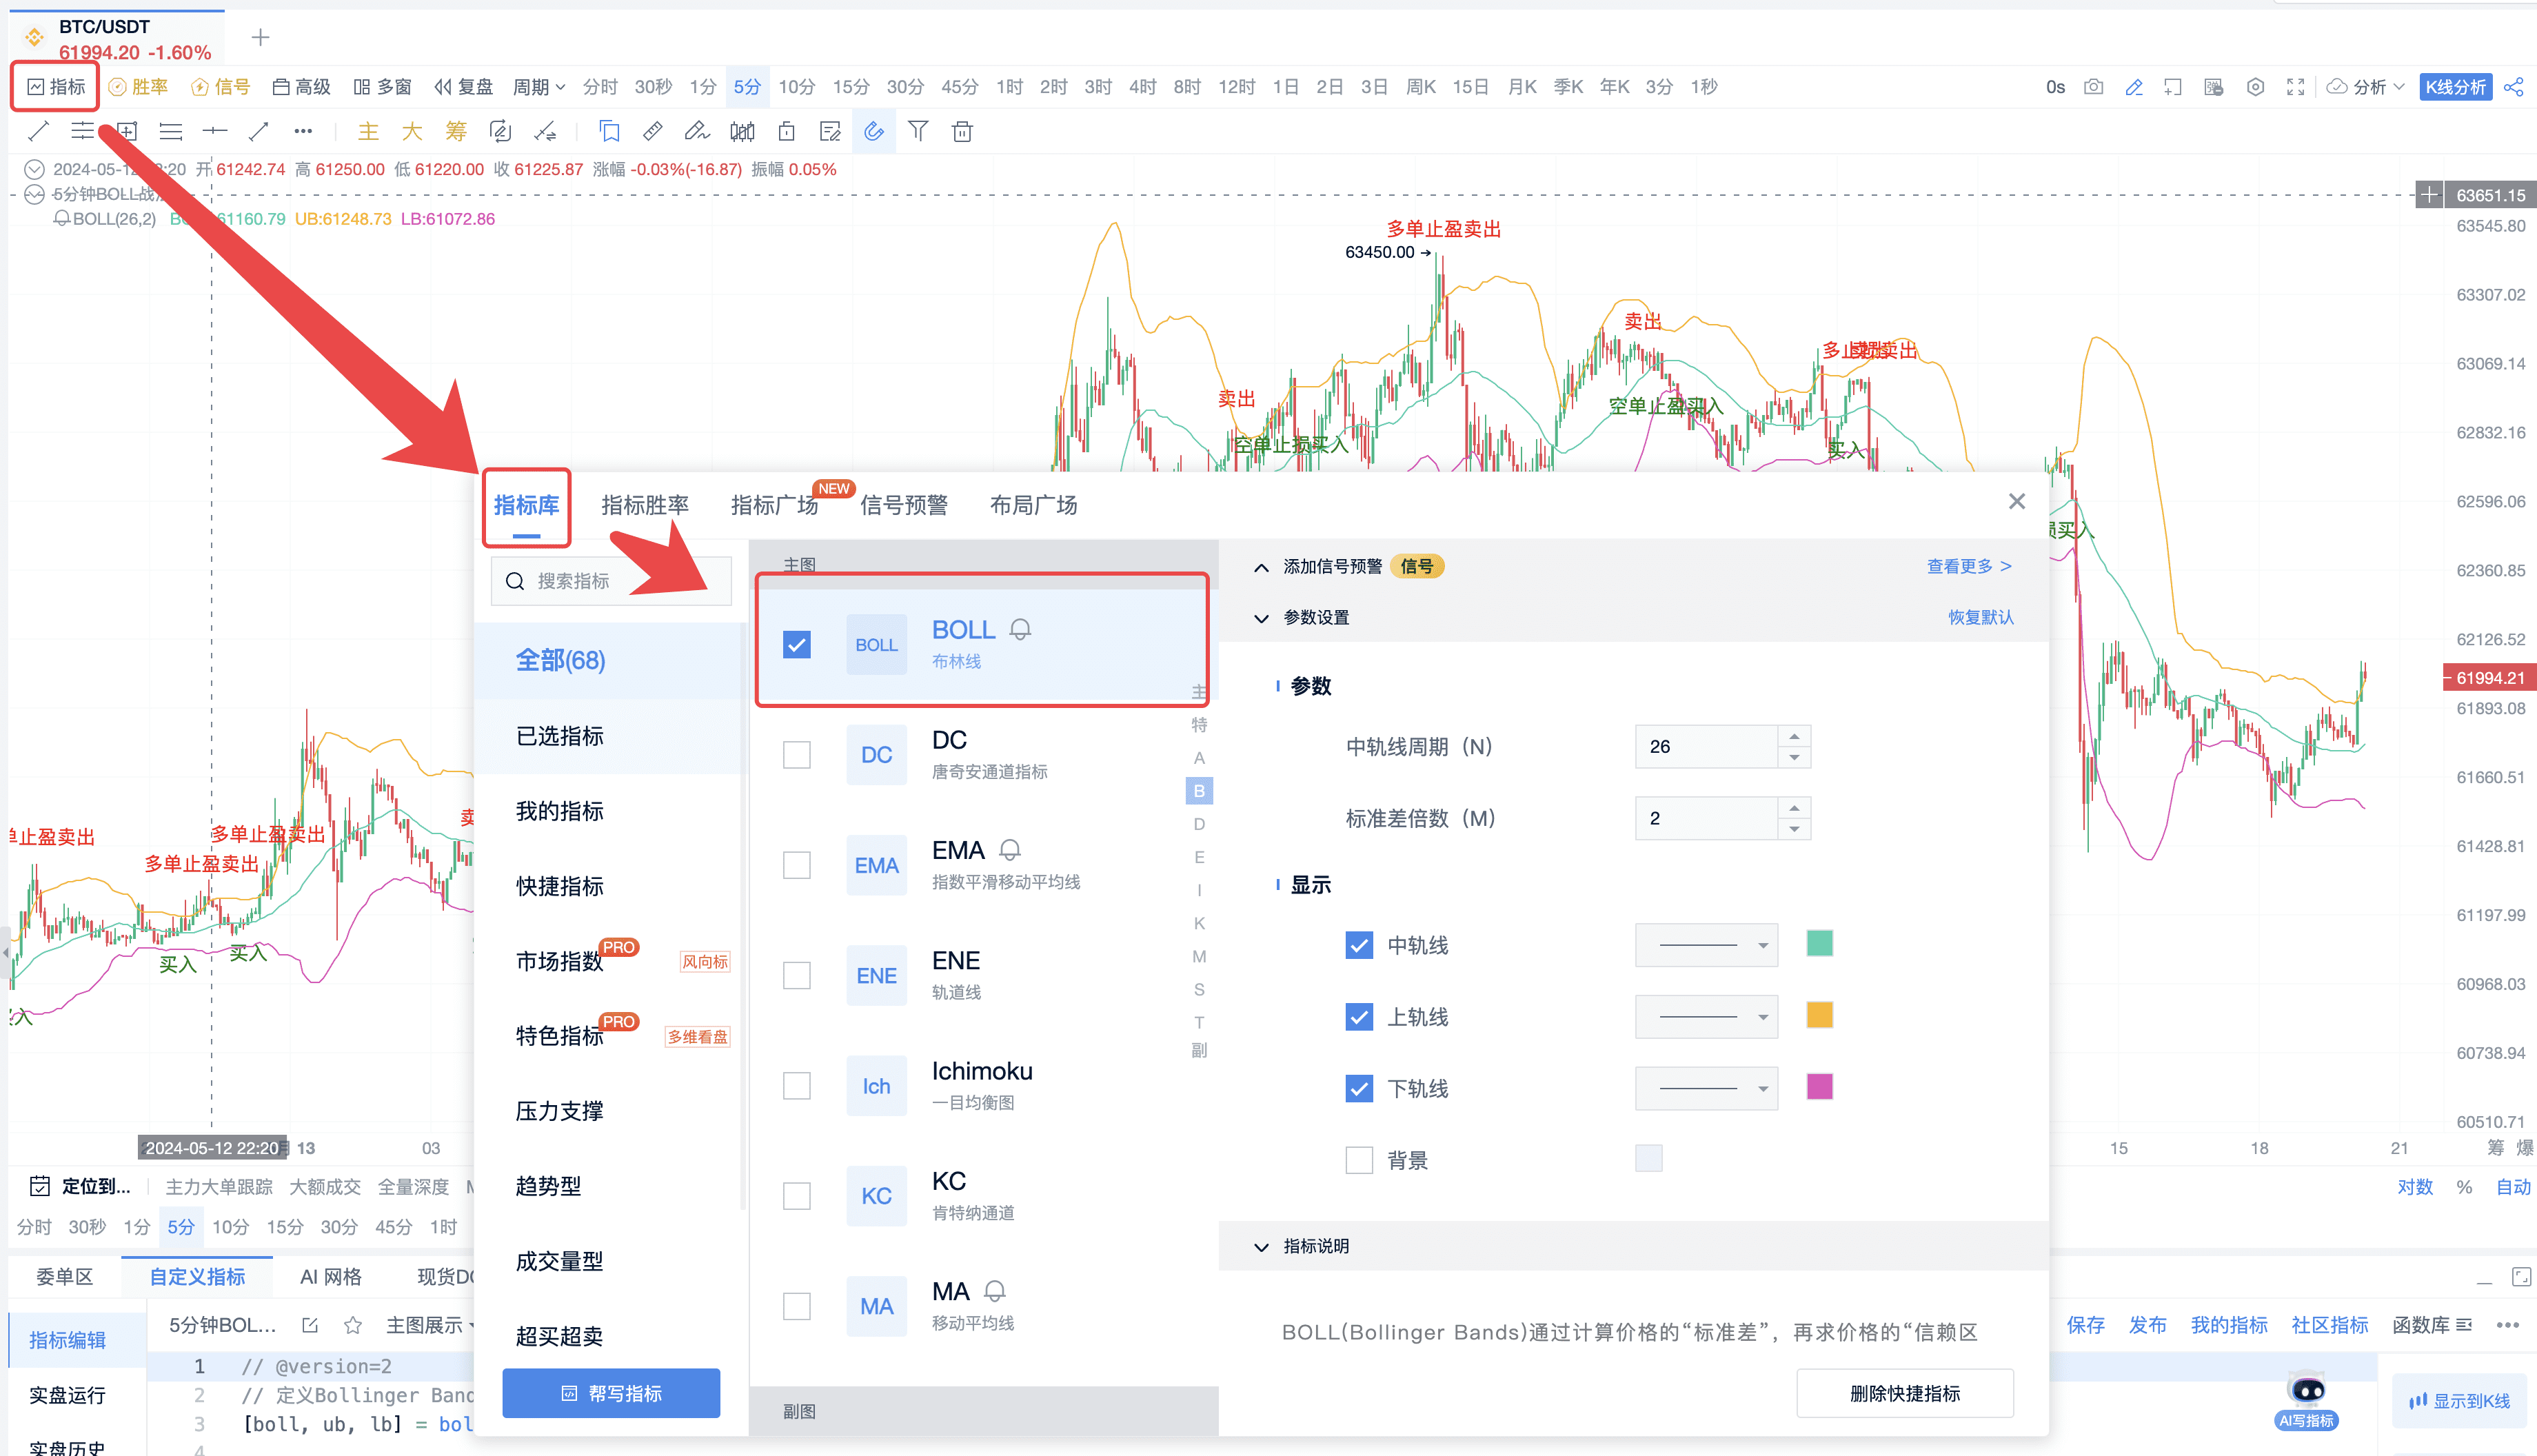
1. Parameter Settings for 5-Minute BOLL+KDJ Strategy
BOLL uses 20, 2; KDJ uses 9, 3, 3.
The basic elements of this strategy:
// Define Bollinger Bands indicator parameters [boll, ub, lb] = boll(close, 20, 2);
// Define KDJ indicator parameters [k, d, j] = kdj(close, 9, 3, 3, 'smma');
For BOLL, the key point to note is the situation when the price crosses the middle band. For KDJ, the key point to note is the situation when K and D cross each other.
Therefore, these two situations are calculated:
// Calculate the crossing of the Bollinger Bands middle band
crossBollUp = crossup(close, boll);
crossBollDown = crossdown(close, boll);
// Calculate KDJ golden cross and dead cross situations
kdjGoldenCross = crossup(k, d);
kdjDeadCross = crossdown(k, d);
After constructing the opening conditions for KDJ and BOLL, a signal model can be built.
buySignal = kdjGoldenCross and crossBollUp and k < 50 and longCount == 0
sellSignal = crossBollDown and kdjDeadCross and k > 50 and shortCount == 0
if (buySignal) {
longCount := 1
}
if (sellSignal) {
shortCount := 1
}
This model combines the above-mentioned KDJ golden and dead crosses as well as BOLL crossing situations.
2. Building Profit-Taking and Stop-Loss Signals
After opening positions, profit-taking and stop-loss signals are constructed.
For setting profit-taking and stop-loss, the upper and lower bands of the Bollinger Bands are used. Calculating the long position profit-taking condition: when the K line crosses above the upper Bollinger band and then falls back within the Bollinger band range. This is similar to a trailing profit-taking mode. If it rises above the upper band and then falls back, it may indicate a regression, suggesting that the short-term uptrend has ended, making it suitable for profit-taking. Similarly, for stop-loss, the lower band of the Bollinger Bands is used.
The overall code:
// Calculate long position profit-taking condition: K line crosses above the upper Bollinger band and then falls back within the Bollinger band range
crossupub = crossdown(close, ub)
longtakeprofit = crossupub and close < ub and close > lb and longCount == 1
if (longtakeprofit) {
longCount := 0
}
// Calculate long position stop-loss condition: falls below the lower Bollinger band
longstoploss = crossdown(close, lb) and longCount == 1
if (longstoploss) {
longCount := 0
}
crossdownlb = crossup(close, lb)
shorttakeprofit = crossdownlb and close > lb and close < ub and shortCount == 1
if (shorttakeprofit) {
shortCount := 0
}
shortstoploss = crossup(close, ub) and shortCount == 1
if (shortstoploss) {
shortCount := 0
}
At this point, the opening and closing conditions, profit-taking, and stop-loss conditions have been constructed, forming a complete strategy.
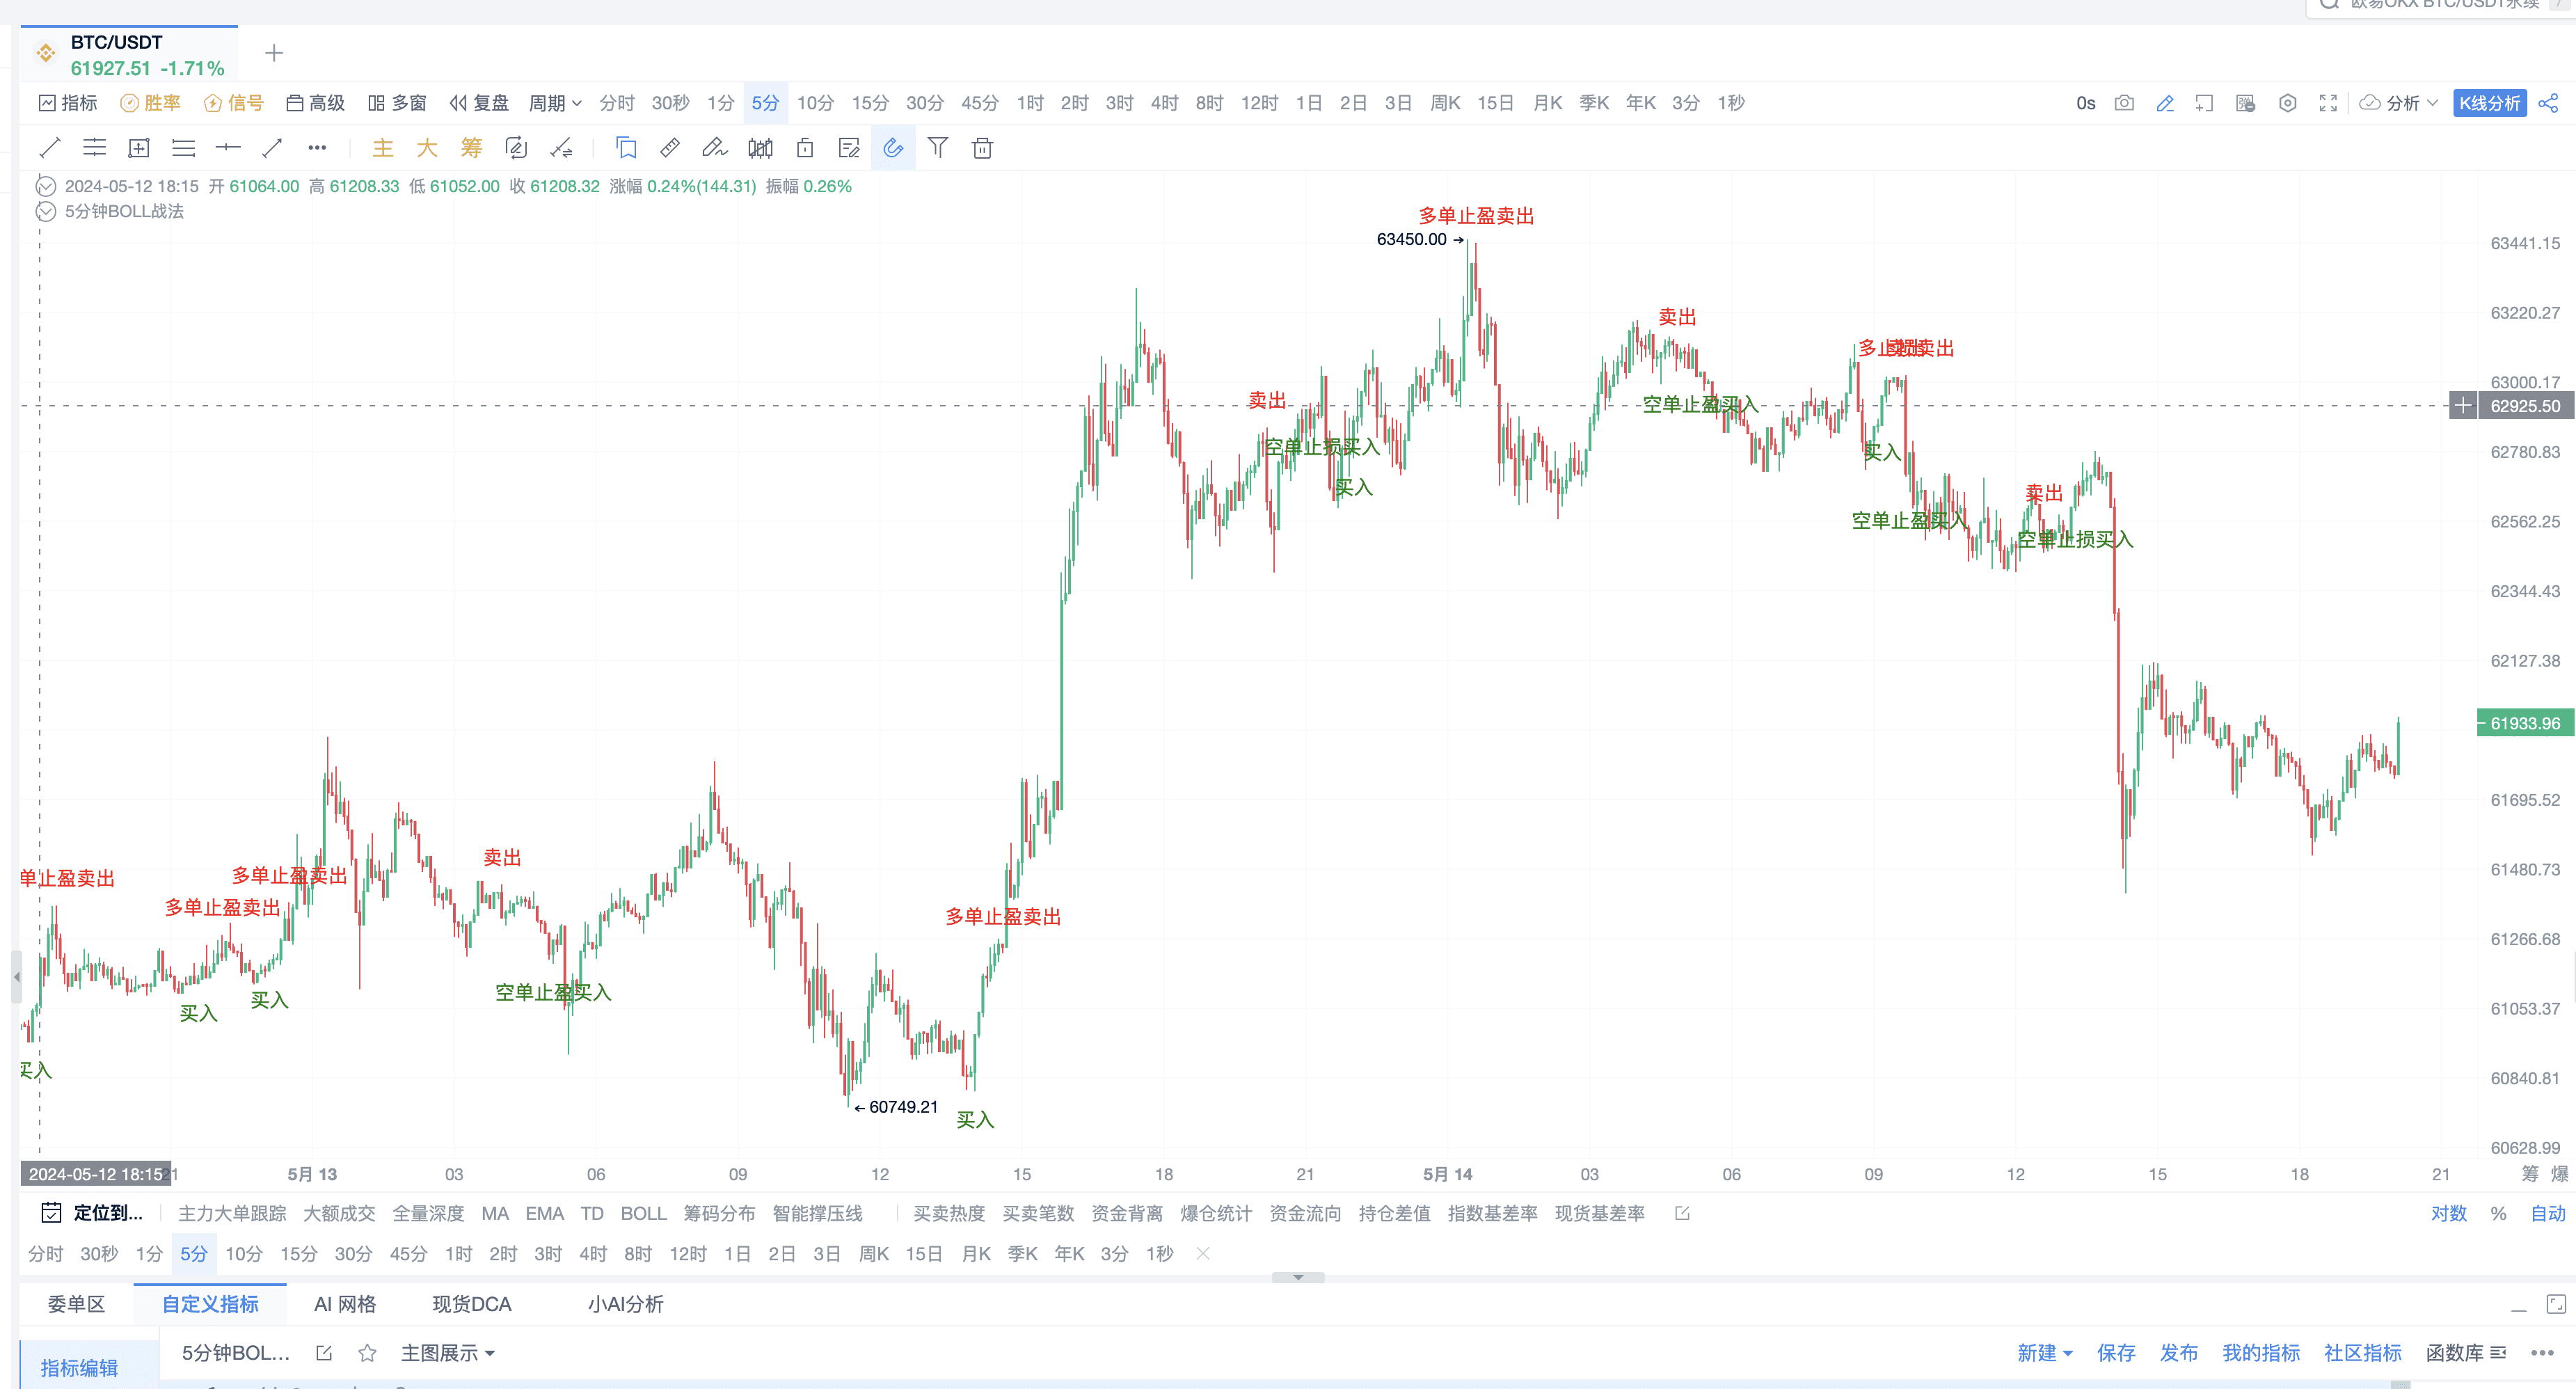
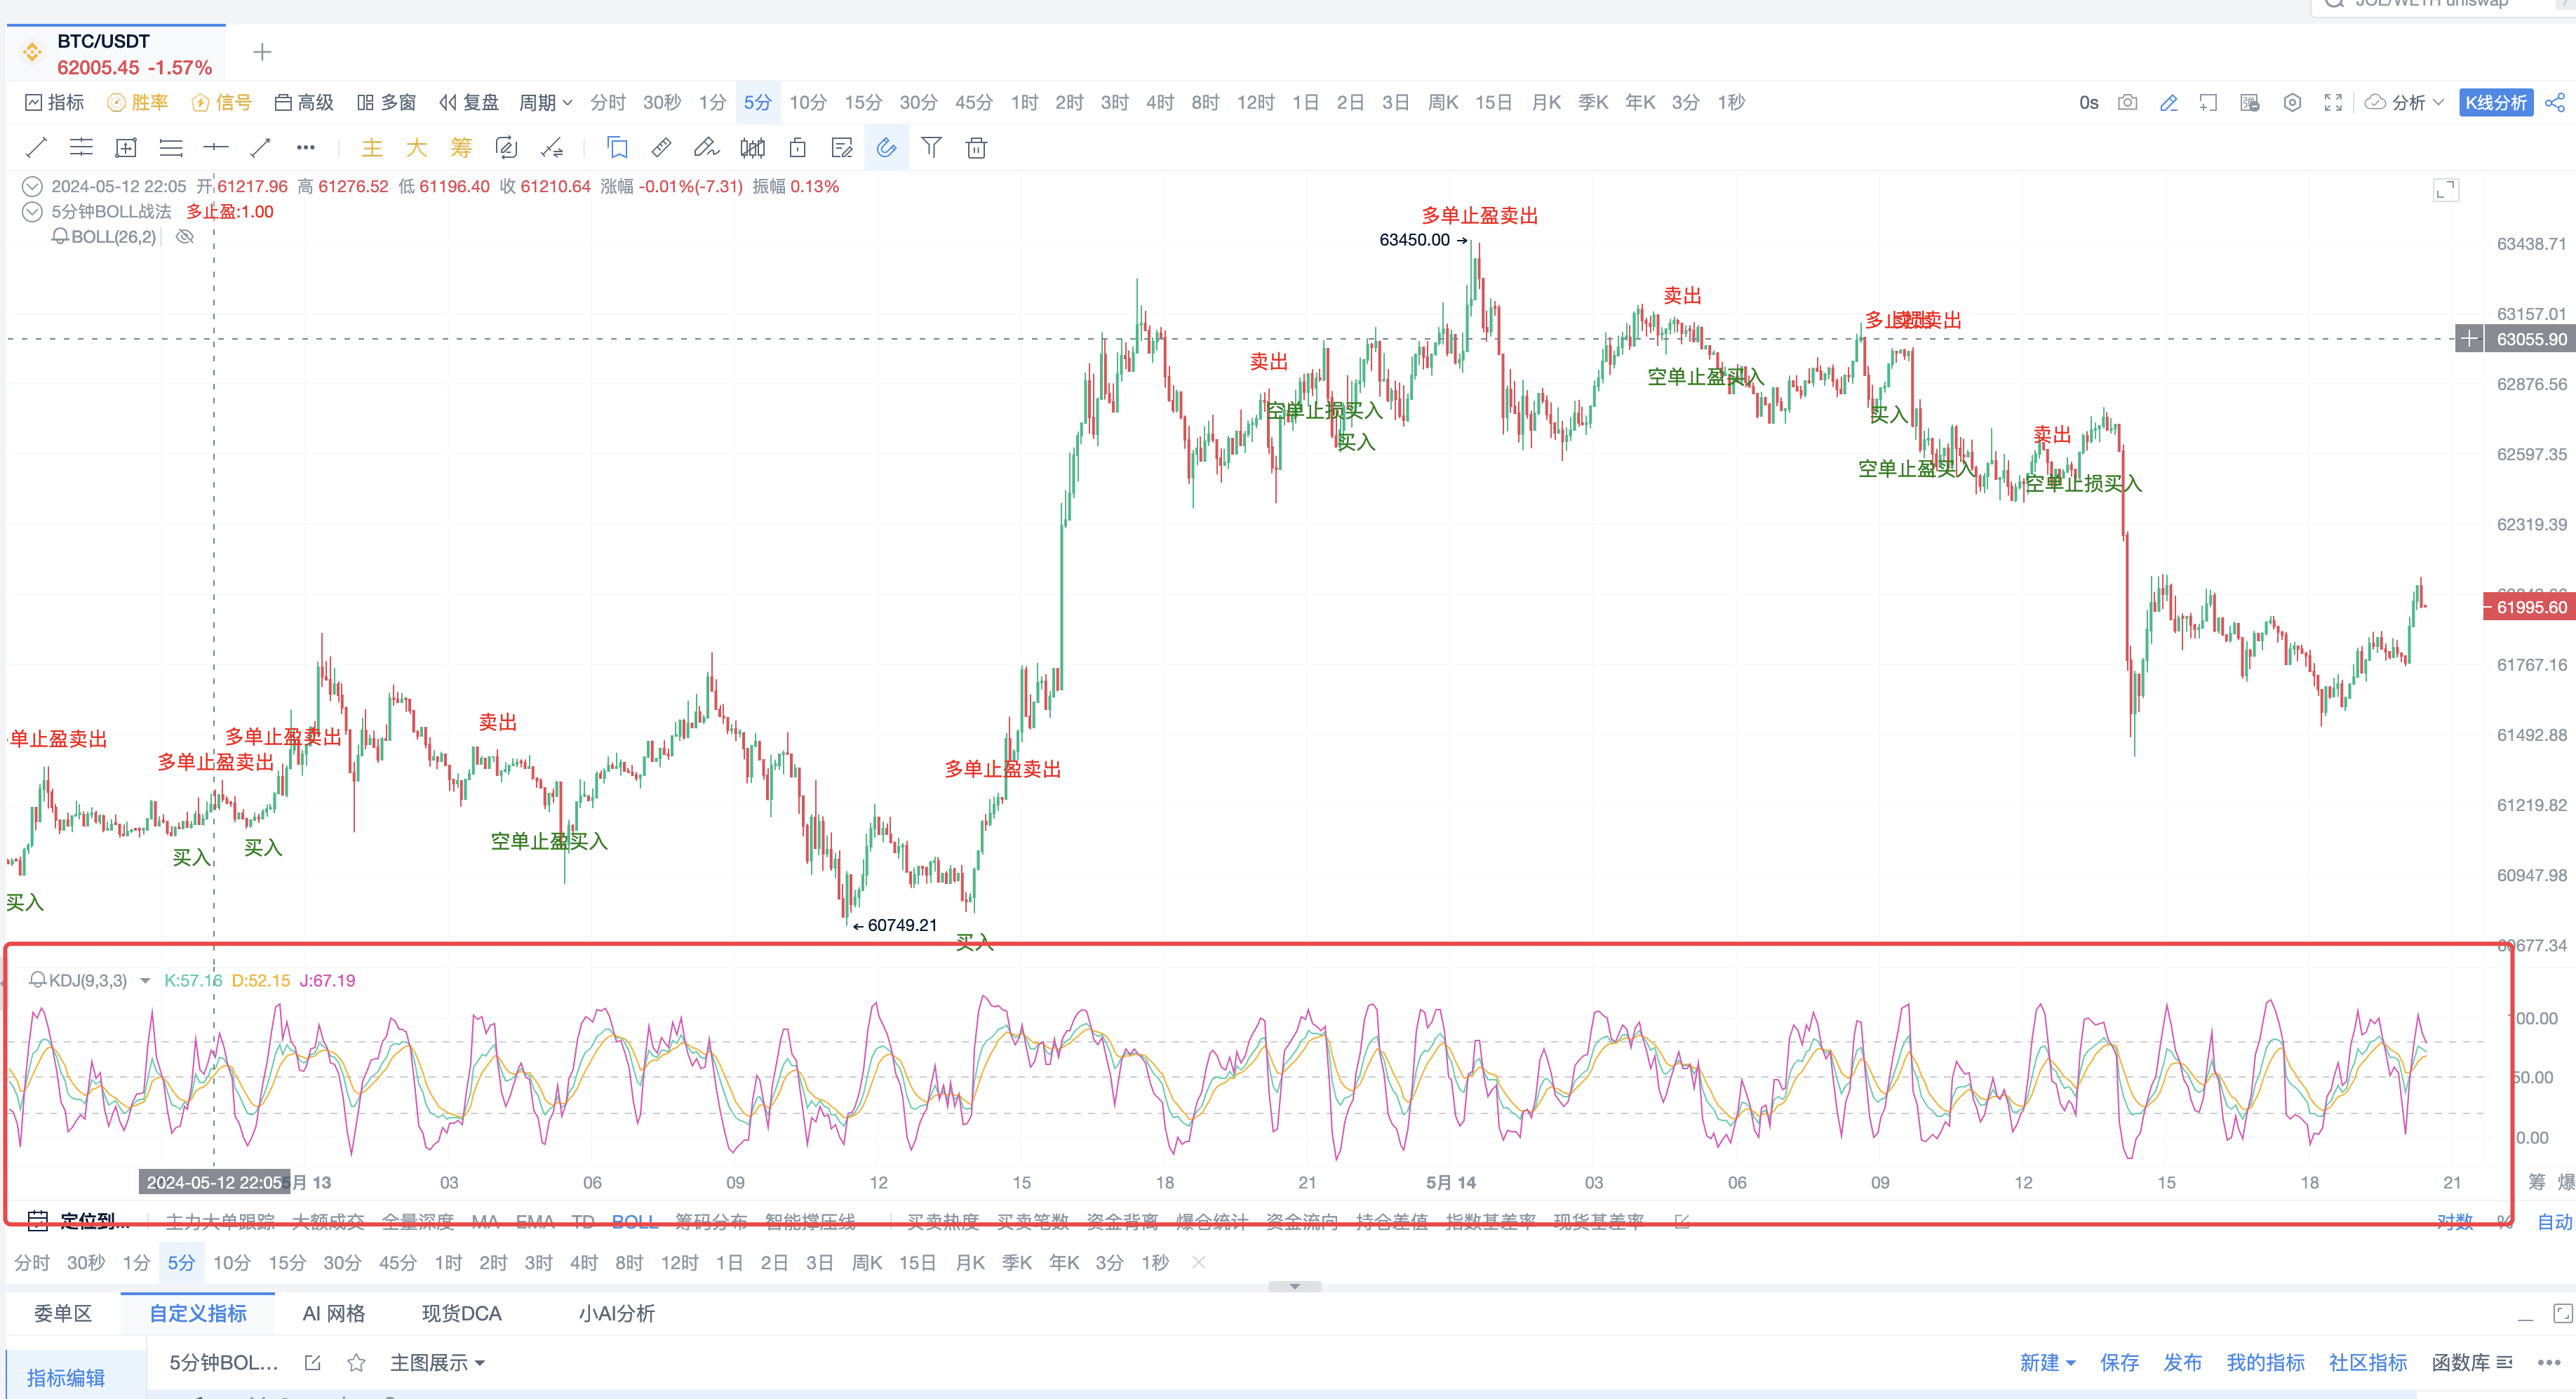
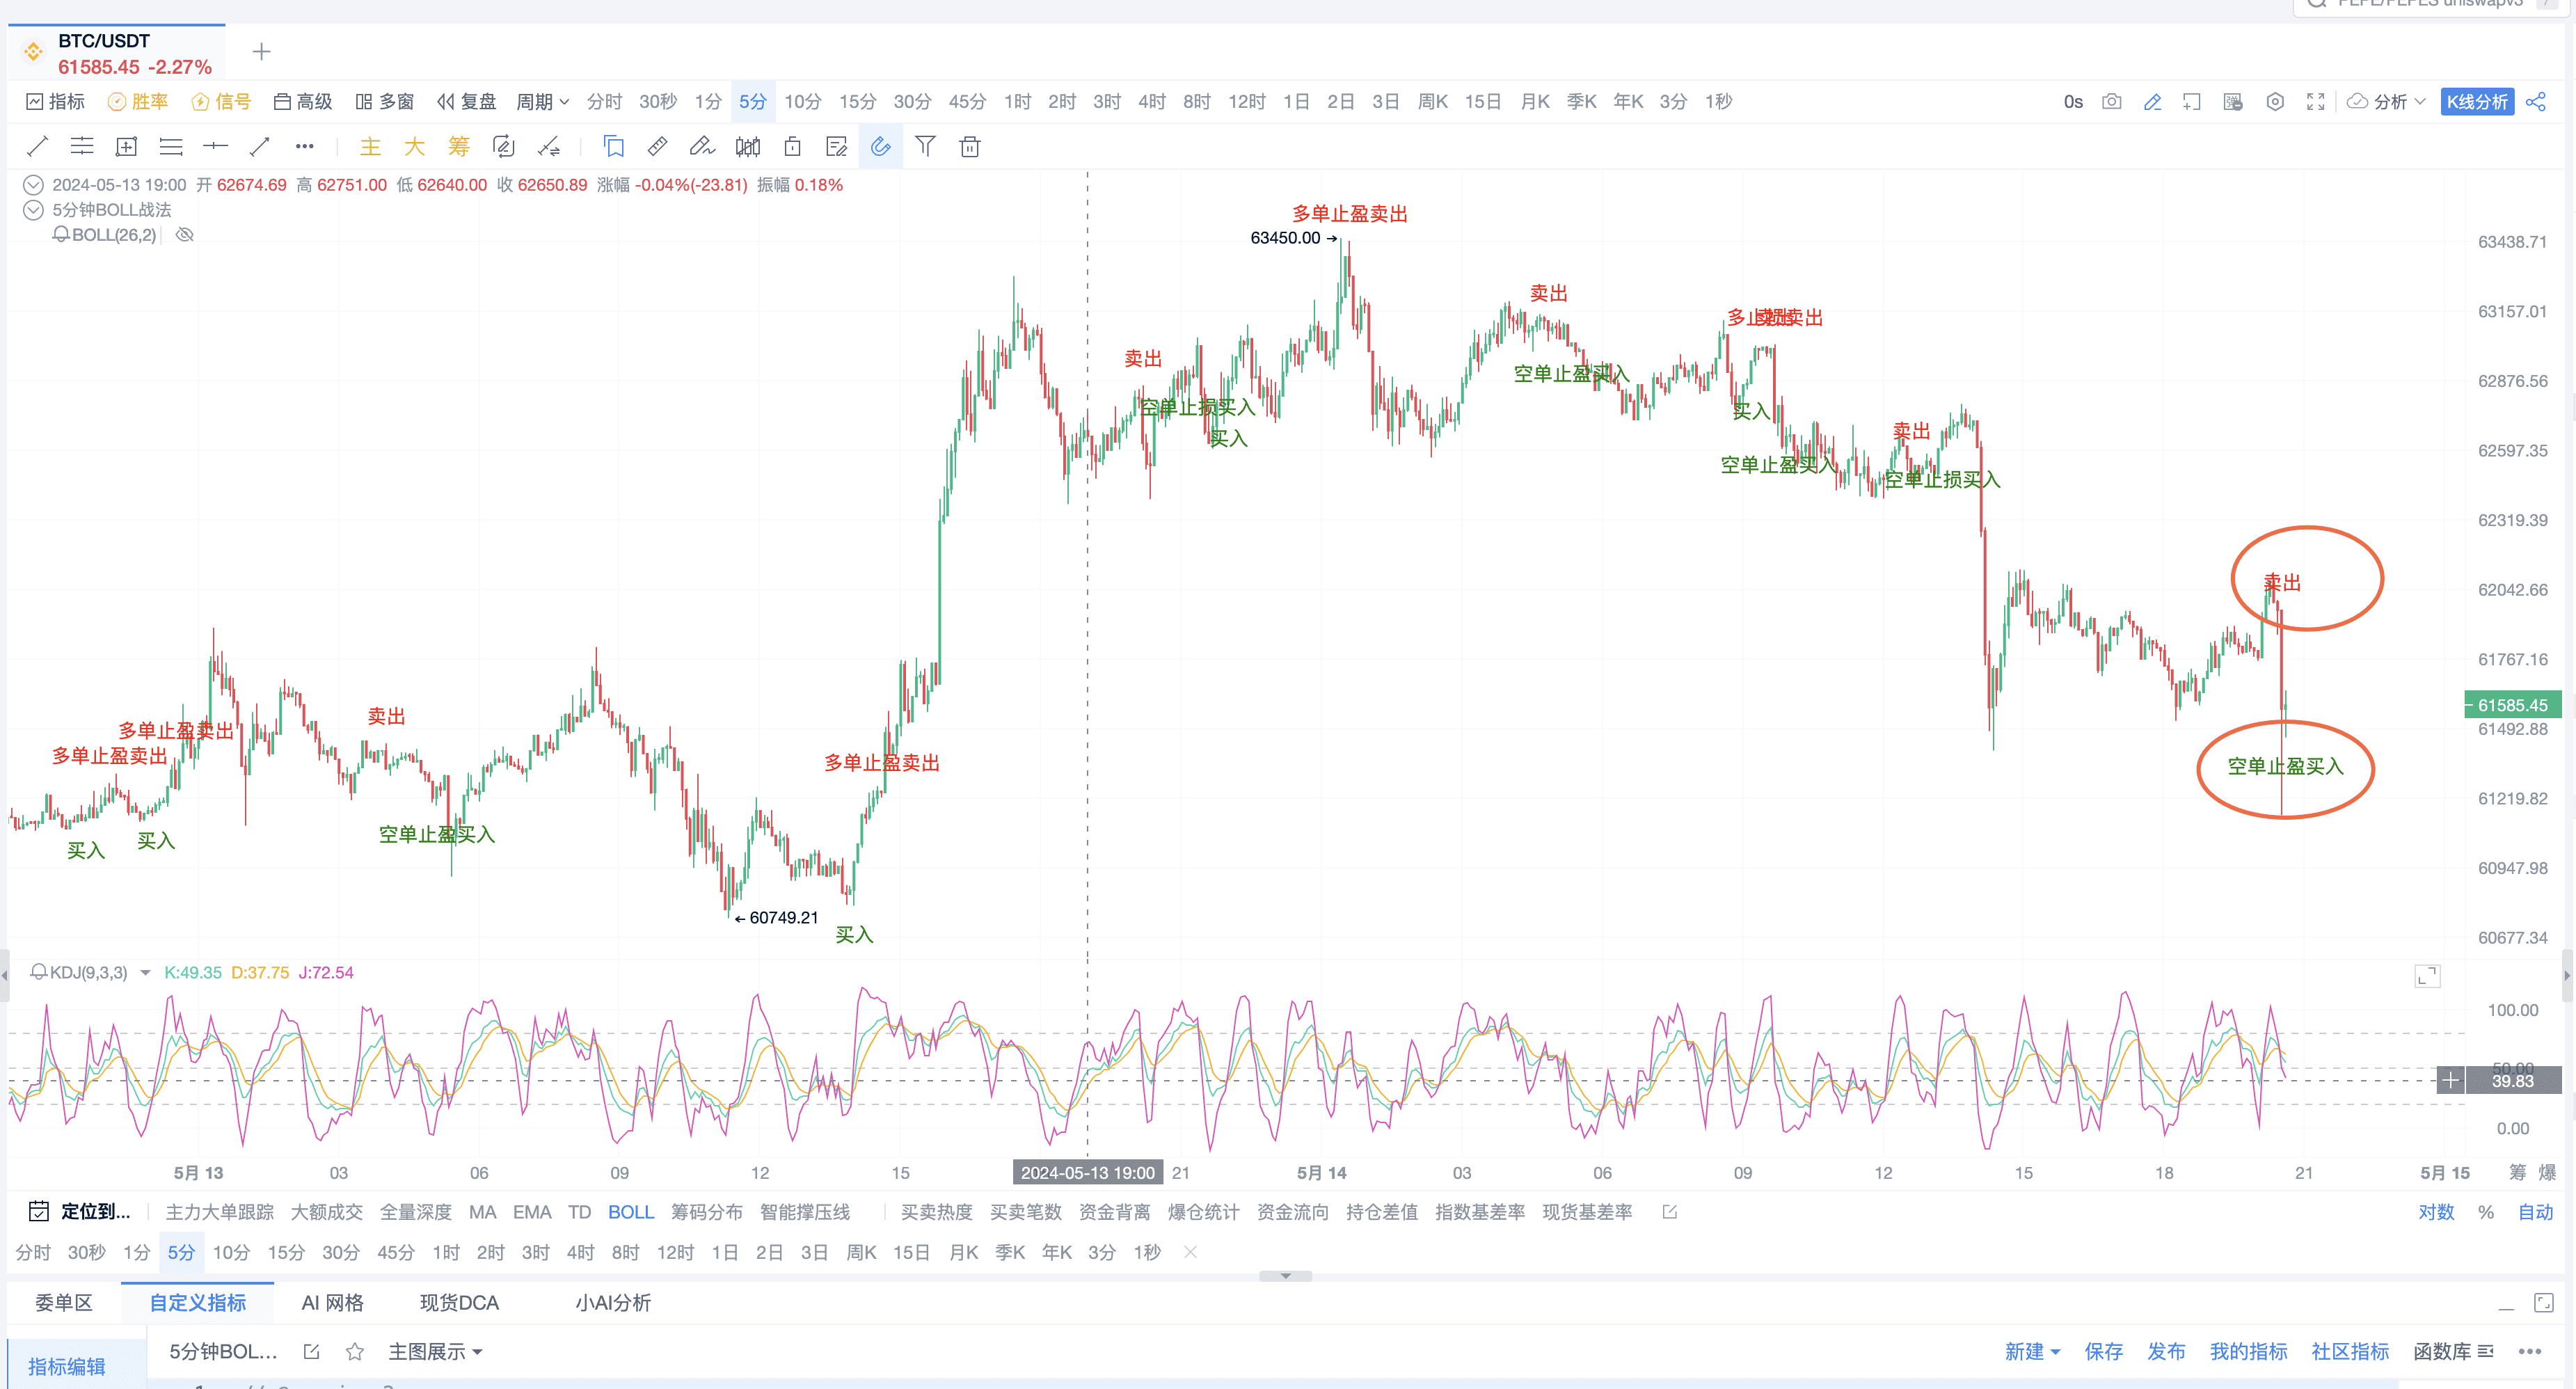
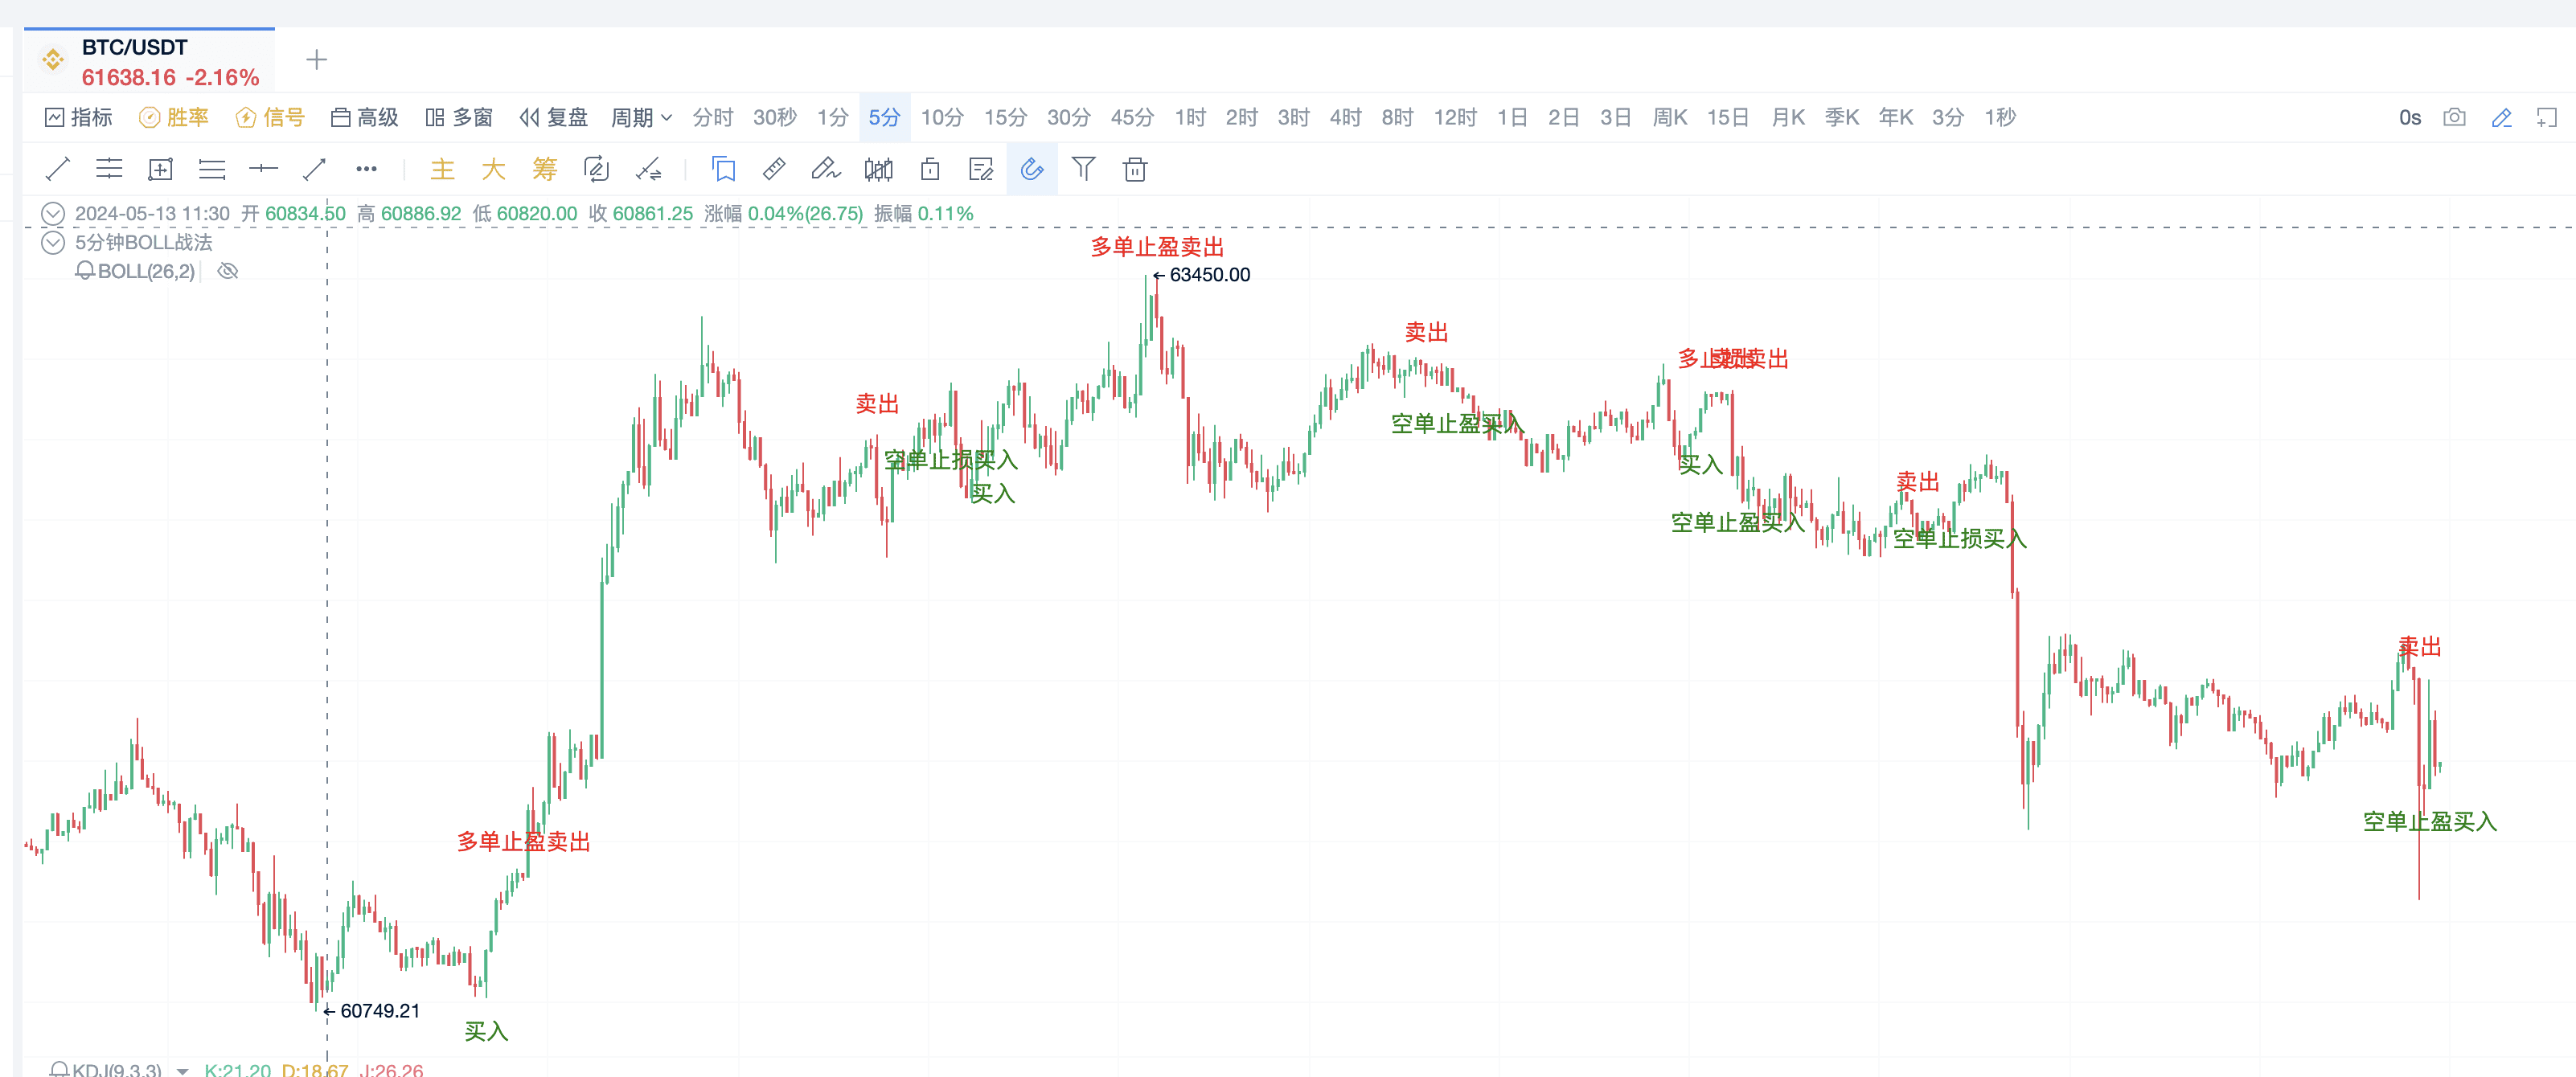
3. Display on Candlestick Chart
Next, it needs to be displayed on the candlestick chart. Adding an alert function allows for timely reminders to make trades. Adding an automatic trading function enables 24/7 flat trading.
First, we construct the code to display on the candlestick chart:
// Draw crossing of the middle band and golden/dead cross signals on the chart
plotText(buySignal, title="Crossing the middle band upwards + KDJ golden cross", text='Buy', color='green', refSeries=low, placement='bottom');
plotText(sellSignal, title="Crossing the middle band downwards + KDJ dead cross", text='Sell', color='red', refSeries=high, placement='top');
plotText(shorttakeprofit, title="Short Take Profit", text='Short position take profit buy', color='green', refSeries=low, placement='bottom');
plotText(shortstoploss, title="Short Stop Loss", text='Short position stop loss buy', color='green', refSeries=low, placement='bottom');
plotText(longtakeprofit, title="Long Take Profit", text='Long position take profit sell', color='red', refSeries=high, placement='top');
plotText(longstoploss, title="Long Stop Loss", text='Long stop loss sell', color='red', refSeries=high, placement='top');
The second step, setting alert conditions
// Set alert conditions
alertcondition(buySignal, title="Crossing the middle band upwards + KDJ golden cross", direction="buy");
alertcondition(sellSignal, title="Crossing the middle band downwards + KDJ dead cross", direction="sell");
alertcondition(shorttakeprofit, title="Short Take Profit", direction="buy");
alertcondition(shortstoploss, title="Short Stop Loss", direction="buy");
alertcondition(longtakeprofit, title="Long Take Profit", direction="sell");
alertcondition(longstoploss, title="Long Stop Loss", direction="sell");
Finally, add this code!
exitLong(longtakeprofit or longstoploss, price='market', amount=1)
exitShort(shorttakeprofit or shortstoploss, price='market', amount=1)
enterLong(buySignal, price='market', amount=1)
enterShort(sellSignal, price='market', amount=1)
Click to trade in real account
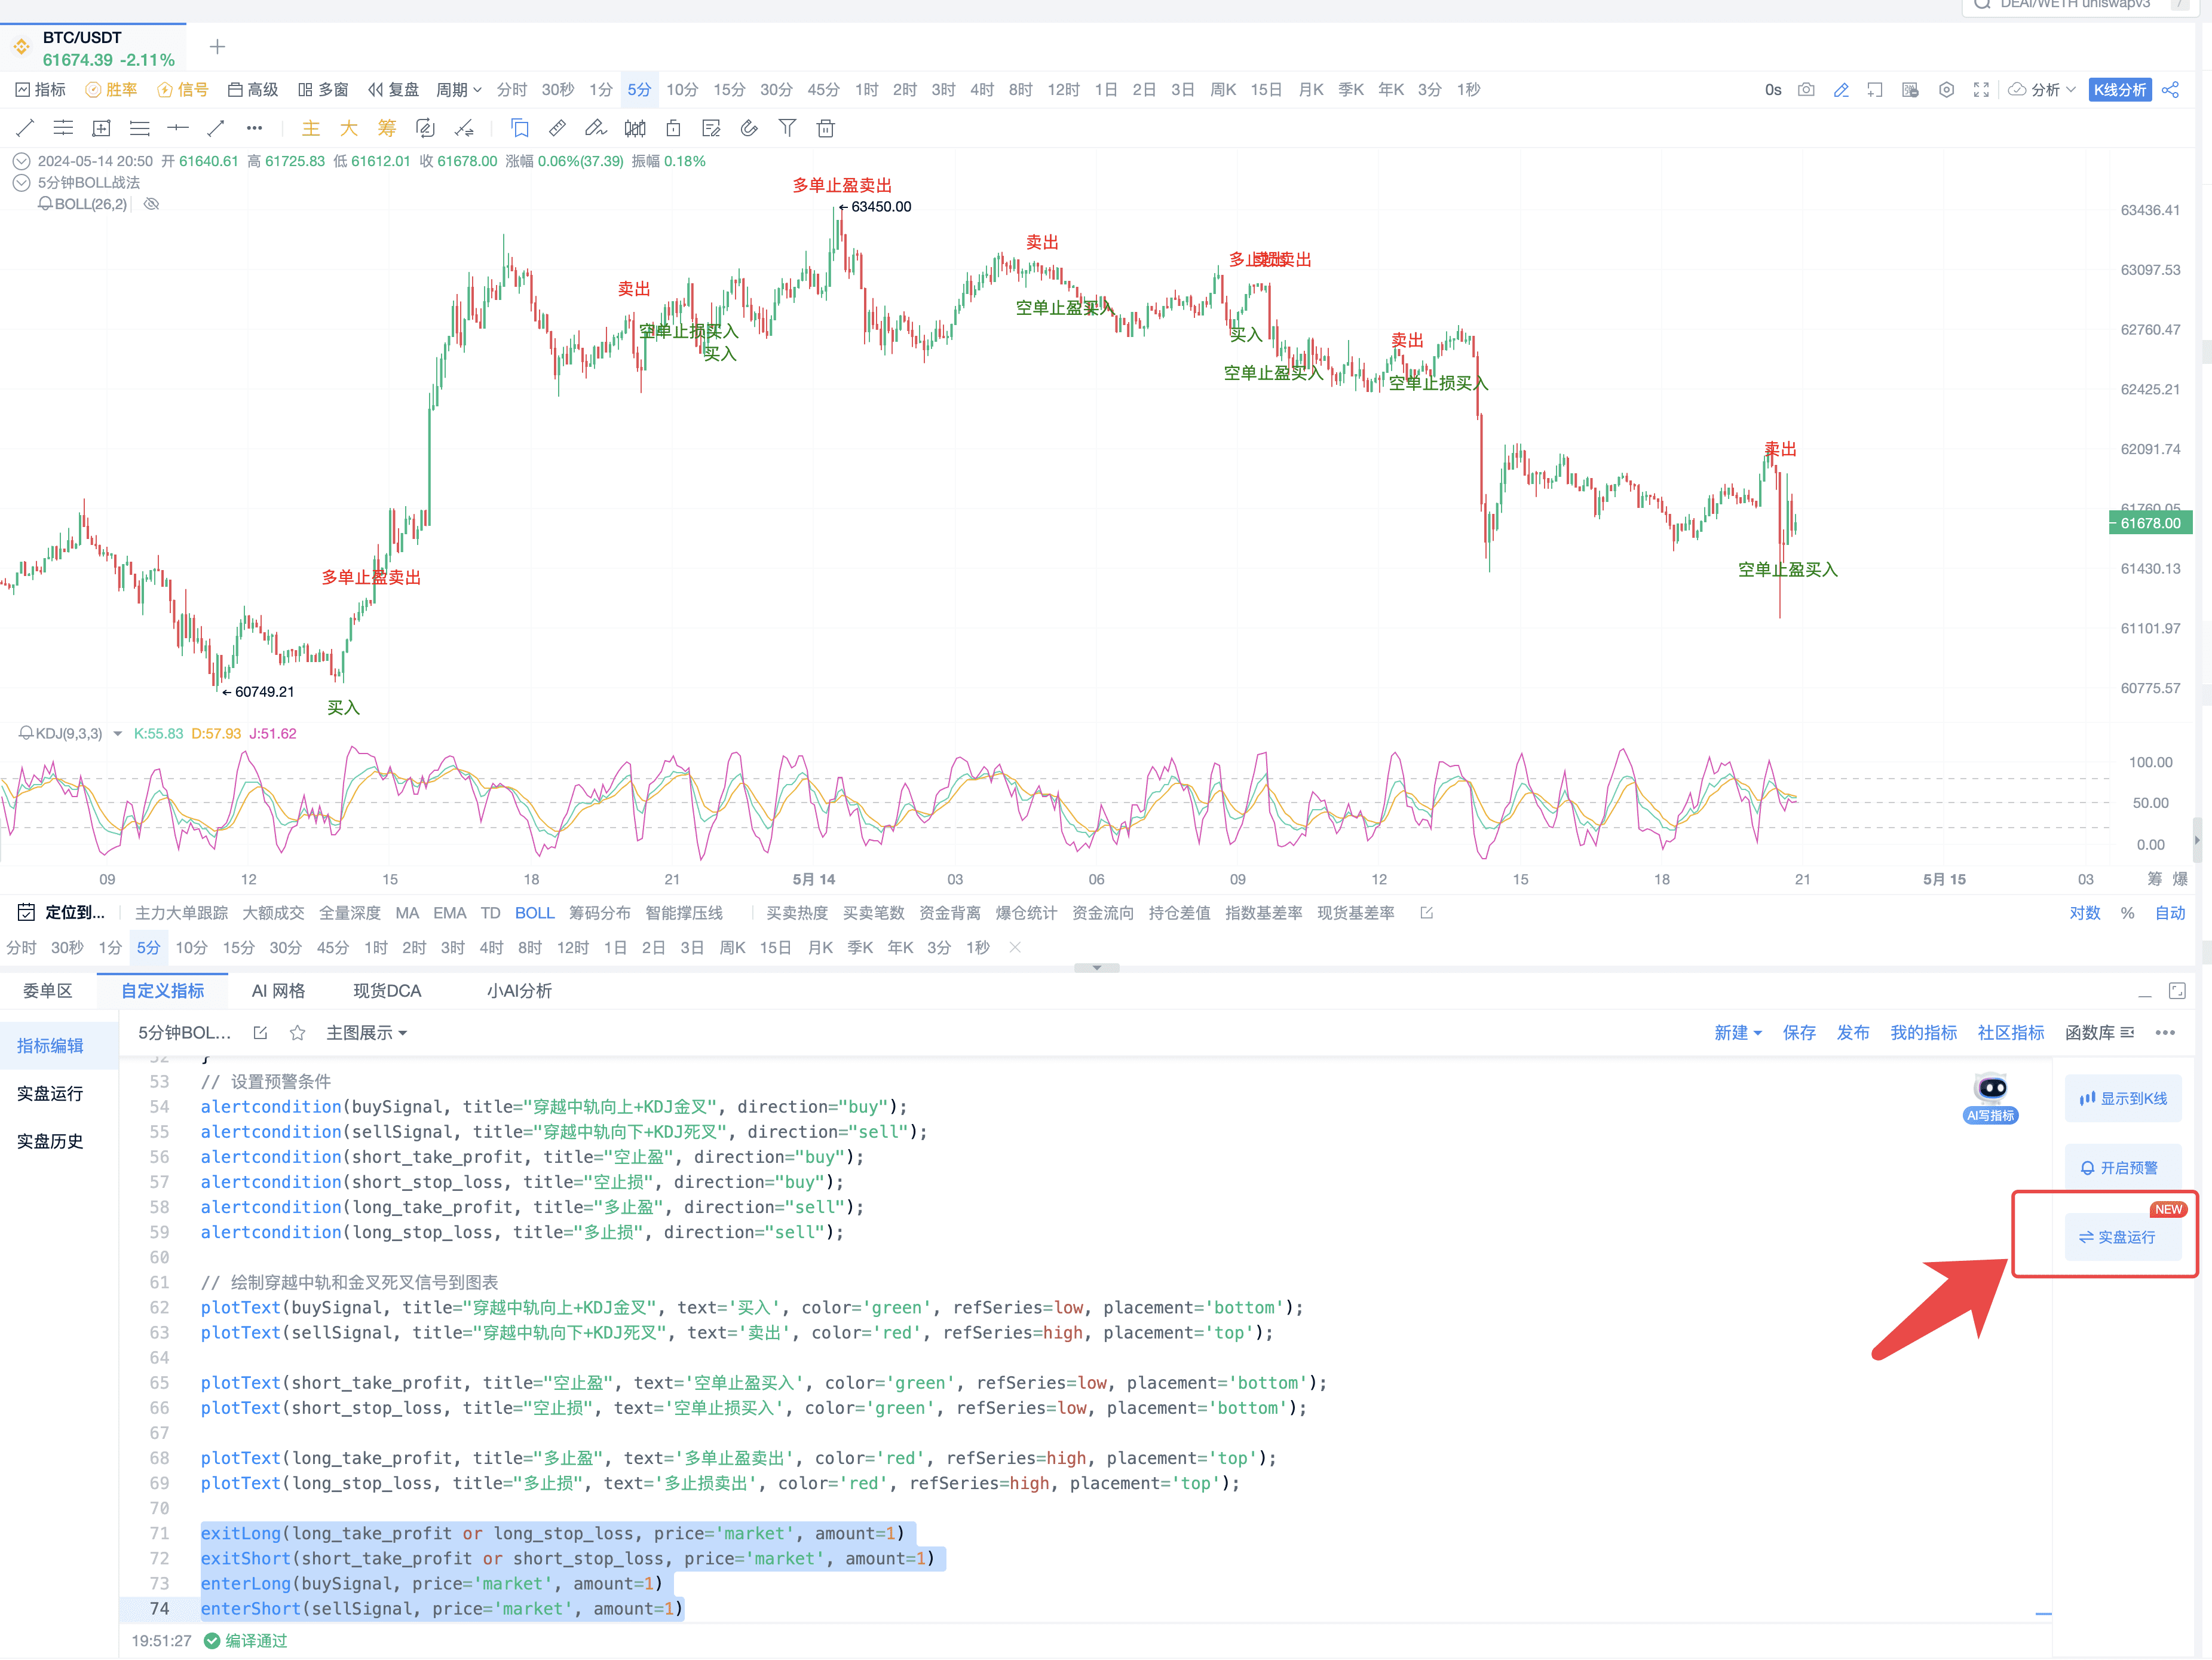
You can trade directly on the PC software client. Normally, all you need to do is research strategies, review signals, and adjust strategy models. Leave the trivial work of trading operations to the software and focus on meaningful tasks.
4. Complete Code
// @version=2
// Define Bollinger Bands indicator parameters
[boll, ub, lb] = boll(close, 20, 2);
// Define KDJ indicator parameters
[k, d, j] = kdj(close, 9, 3, 3, 'smma');
var longCount = 0;
var shortCount = 0;
// Calculate the crossing of the Bollinger Bands middle band
crossBollUp = crossup(close, boll);
crossBollDown = crossdown(close, boll);
// Calculate KDJ golden cross and dead cross situations
kdjGoldenCross = crossup(k, d);
kdjDeadCross = crossdown(k, d);
buySignal = kdjGoldenCross and crossBollUp and k < 50 and longCount == 0
sellSignal = crossBollDown and kdjDeadCross and k > 50 and shortCount == 0
if (buySignal) {
longCount := 1
}
if (sellSignal) {
shortCount := 1
}
// Calculate long position profit-taking condition: K line crosses above the upper Bollinger band and then falls back within the Bollinger band range
crossupub = crossdown(close, ub)
longtakeprofit = crossupub and close < ub and close > lb and longCount == 1
if (longtakeprofit) {
longCount := 0
}
// Calculate long position stop-loss condition: falls below the lower Bollinger band
longstoploss = crossdown(close, lb) and longCount == 1
if (longstoploss) {
longCount := 0
}
crossdownlb = crossup(close, lb)
shorttakeprofit = crossdownlb and close > lb and close < ub and shortCount == 1
if (shorttakeprofit) {
shortCount := 0
}
shortstoploss = crossup(close, ub) and shortCount == 1
if (shortstoploss) {
shortCount := 0
}
// Set alert conditions
alertcondition(buySignal, title="Crossing the middle band upwards + KDJ golden cross", direction="buy");
alertcondition(sellSignal, title="Crossing the middle band downwards + KDJ dead cross", direction="sell");
alertcondition(shorttakeprofit, title="Short Take Profit", direction="buy");
alertcondition(shortstoploss, title="Short Stop Loss", direction="buy"); ```
alertcondition(longtakeprofit, title="Long Take Profit", direction="sell");
alertcondition(longstoploss, title="Long Stop Loss", direction="sell");
// Plot crossing the middle band and golden/dead cross signals on the chart
plotText(buySignal, title="Crossing the middle band upwards + KDJ golden cross", text='Buy', color='green', refSeries=low, placement='bottom');
plotText(sellSignal, title="Crossing the middle band downwards + KDJ dead cross", text='Sell', color='red', refSeries=high, placement='top');
plotText(shorttakeprofit, title="Short Take Profit", text='Short position take profit buy', color='green', refSeries=low, placement='bottom');
plotText(shortstoploss, title="Short Stop Loss", text='Short position stop loss buy', color='green', refSeries=low, placement='bottom');
plotText(longtakeprofit, title="Long Take Profit", text='Long position take profit sell', color='red', refSeries=high, placement='top');
plotText(longstoploss, title="Long Stop Loss", text='Long stop loss sell', color='red', refSeries=high, placement='top');
exitLong(longtakeprofit or longstoploss, price='market', amount=1)
exitShort(shorttakeprofit or shortstoploss, price='market', amount=1)
enterLong(buySignal, price='market', amount=1)
enterShort(sellSignal, price='market', amount=1)
PRO members and signal alert members are premium tools tailored for lazy friends, and custom indicators can help any AICoin user plan their trades and trade their plans. For more custom indicator strategy displays and multiple alert reminders, feel free to open a signal alert/PRO version K-line for a limited free trial of the custom indicator membership. Click the link below to open and experience: https://aicoin.com/en/vip/chartpro
Recommended Reading
For more live content, please follow the AICoin "News/Information-Live Review" section, and feel free to download the AICoin PC client
免责声明:本文章仅代表作者个人观点,不代表本平台的立场和观点。本文章仅供信息分享,不构成对任何人的任何投资建议。用户与作者之间的任何争议,与本平台无关。如网页中刊载的文章或图片涉及侵权,请提供相关的权利证明和身份证明发送邮件到support@aicoin.com,本平台相关工作人员将会进行核查。


