This article is only a personal market view and does not constitute investment advice. If you operate according to this, you are responsible for your own gains and losses.
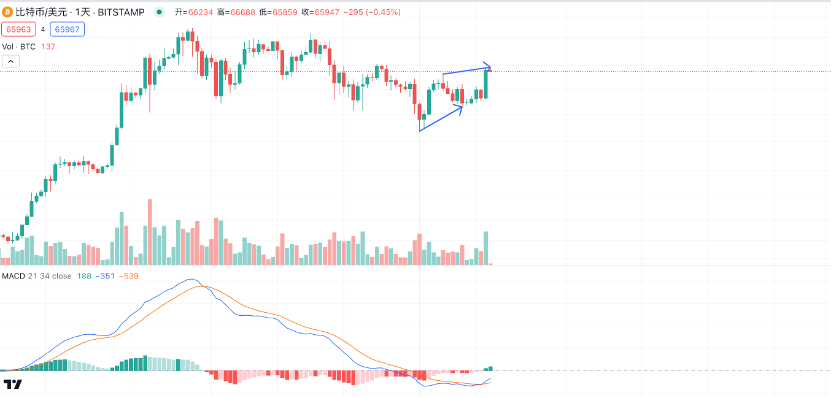
In the article on Monday, some indicators and signals that need to be verified were proposed. From the current perspective, all these indicators have issued positive bullish signals. Looking at the daily level, yesterday's large volume bullish candle directly broke through the pressure of all moving averages and is currently standing above 65,500. This is the resonance position of the 60-day moving average + Fibonacci support, and also the short-term support position.
- Moving averages form a "Golden Spider" pattern
In the chart, it can be seen that the 5-day moving average crossed above the 10 and 20-day moving averages at the same point, which is commonly known as the "Golden Spider" pattern, a typical bullish signal. When the crossover occurs, the longer the bullish candle and the higher the trading volume, the more effective it is.

- Breaking through the previous rebound high, and MACD golden cross
Since May 1st, the trend has formed higher highs and higher lows, breaking the nearly 2-month downtrend, and both MACD and KDJ have returned to a bullish state, indicating a bullish trend.

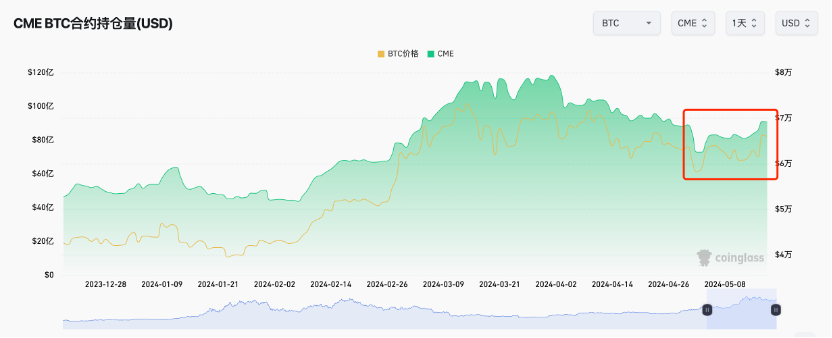
- Increase in open interest
The open interest of CME contracts has increased, which is also a positive signal.

- Macro data cooperation
Last night's CPI data and Powell's clear statement of no interest rate hike on the 14th are both positive signals at the macro level. The 14th is also a Fibonacci turning point window, which currently seems to be in line with it. The macro level has become the catalyst for the market explosion.
- Re-entry of ETFs
In recent days, ETFs have returned to a net inflow state, and the inflow scale increased significantly yesterday, which is also a positive bullish signal.

In summary, all the factors proposed in the article on Monday have been realized and point to a bullish trend. We should be optimistic about the upcoming market, having endured the worst times. In the short term, it remains to be seen whether it can hold near 65,500, and it is best to consolidate and build a foundation for the next wave of upward movement.
The only downside is that the trend of ETH is still weak and unbearable. From the trend perspective, the ETF approval at the end of May seems unlikely, and we can only wait for new hotspots related to ETH to drive the market.
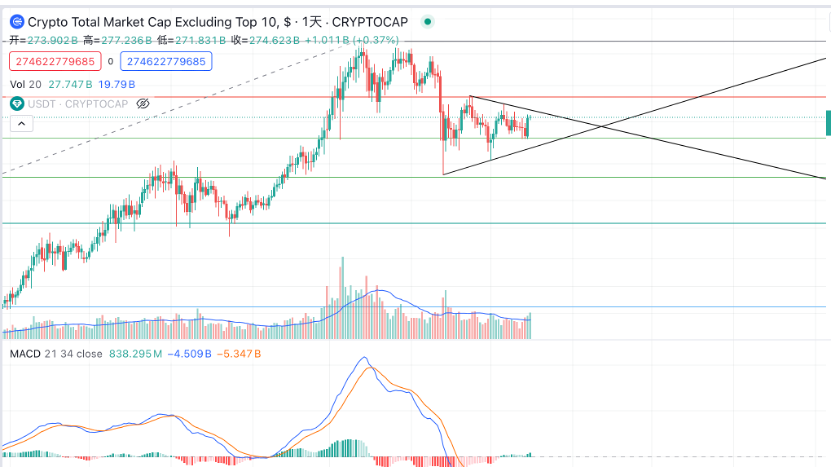
As for the performance of altcoins, refer to the chart below (total market value of coins outside the top 10). Since April 13th, the bottom has been rising, and the overall performance of altcoin market value is actually stronger than BTC. This may contradict some intuitive feelings of many, mainly because the issuance of altcoins this year has increased sharply, dispersing the funds of altcoins, leading to a significant divergence in the trend of altcoins, especially with a large amount of funds concentrated in the MEME sector. However, the current candlestick trend shows a triangular consolidation state, and it is close to the upper boundary of the triangle. If it breaks through subsequently, the overall market of altcoins may be on the way.

Follow me and make the most of trend profits with minimal operations.

免责声明:本文章仅代表作者个人观点,不代表本平台的立场和观点。本文章仅供信息分享,不构成对任何人的任何投资建议。用户与作者之间的任何争议,与本平台无关。如网页中刊载的文章或图片涉及侵权,请提供相关的权利证明和身份证明发送邮件到support@aicoin.com,本平台相关工作人员将会进行核查。


