On the afternoon of April 29th, AICoin researchers conducted a live graphic and text sharing session titled "Halving Effect? Middle East Situation? - Comprehensive Strategy for Turbulent Markets (with Membership Giveaway)" in the AICoin PC-end - Group Chat - Live. Below is a summary of the live content.
I. Several Factors Affecting Market Turbulence Recently
1. Halving Event
The halving event in the cryptocurrency market may create short-term profit opportunities for traders, but it also reduces miners' rewards, increasing their economic pressure, which may lead to miners selling Bitcoin to maintain operations, causing market fluctuations.
From the block data perspective, after block height 840,000, block rewards decreased, but block income increased.
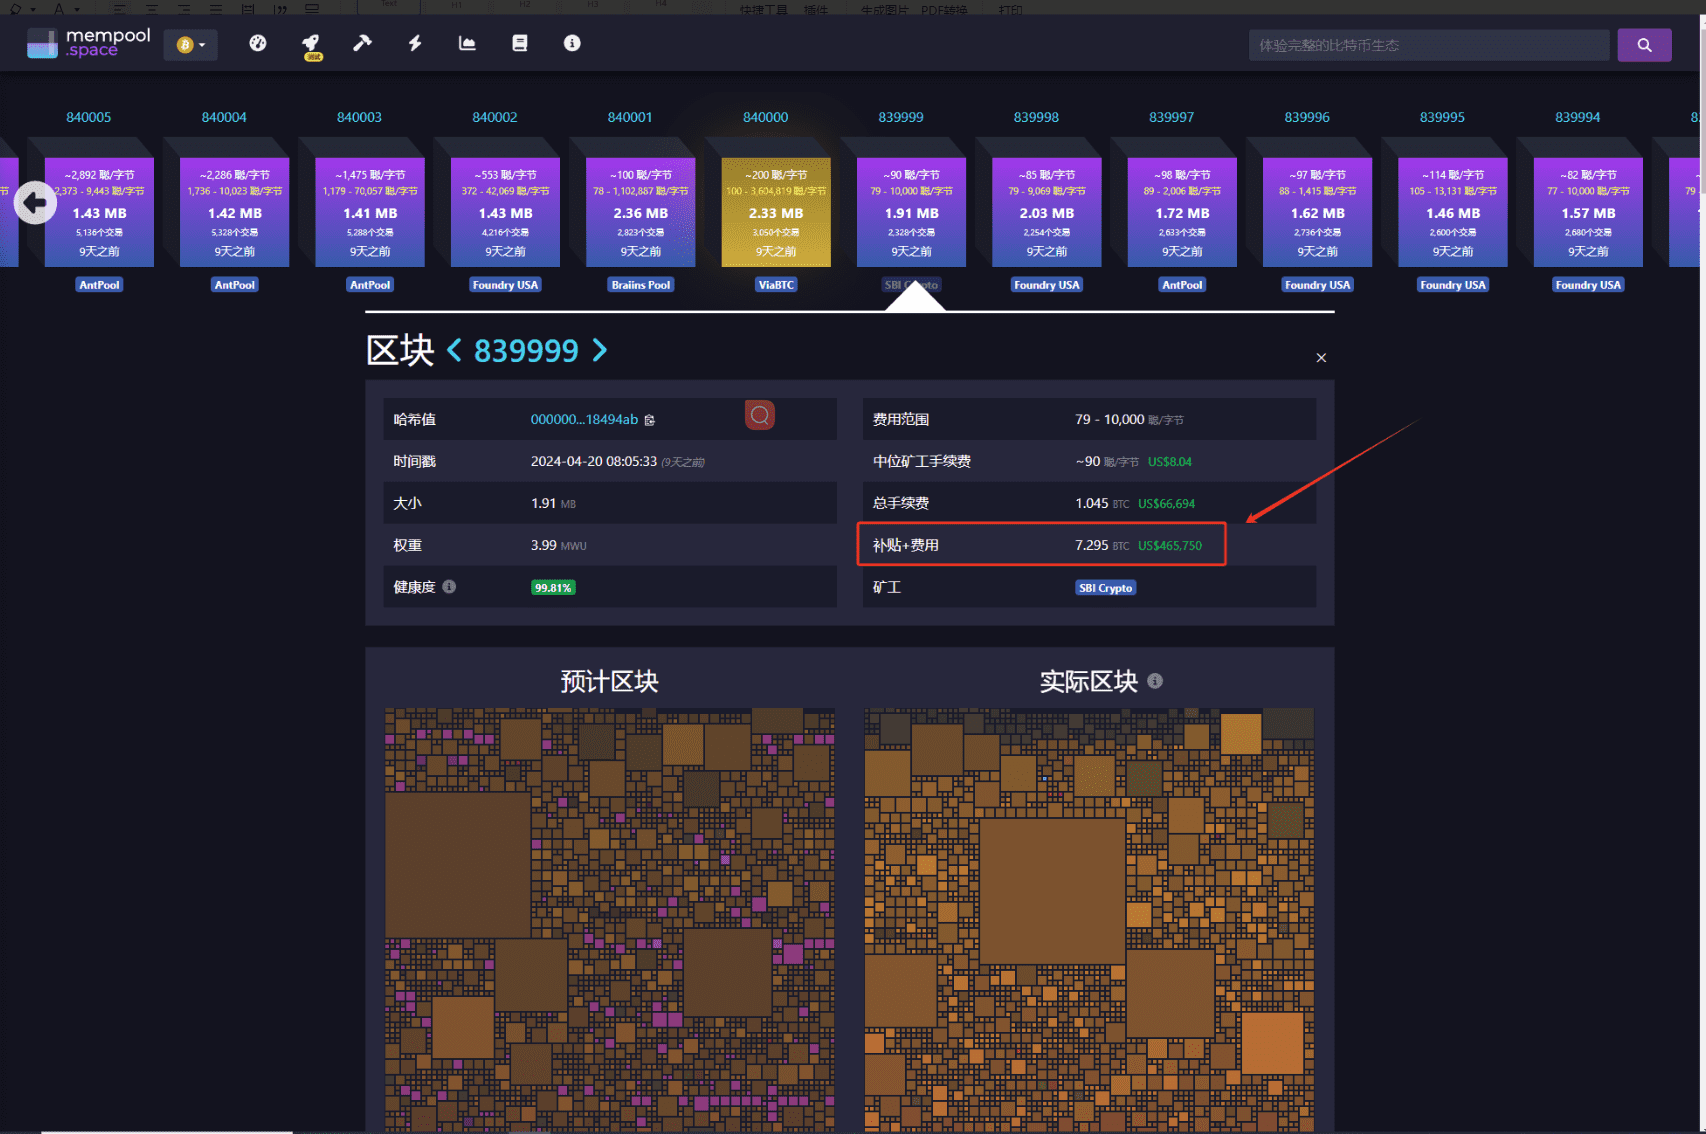
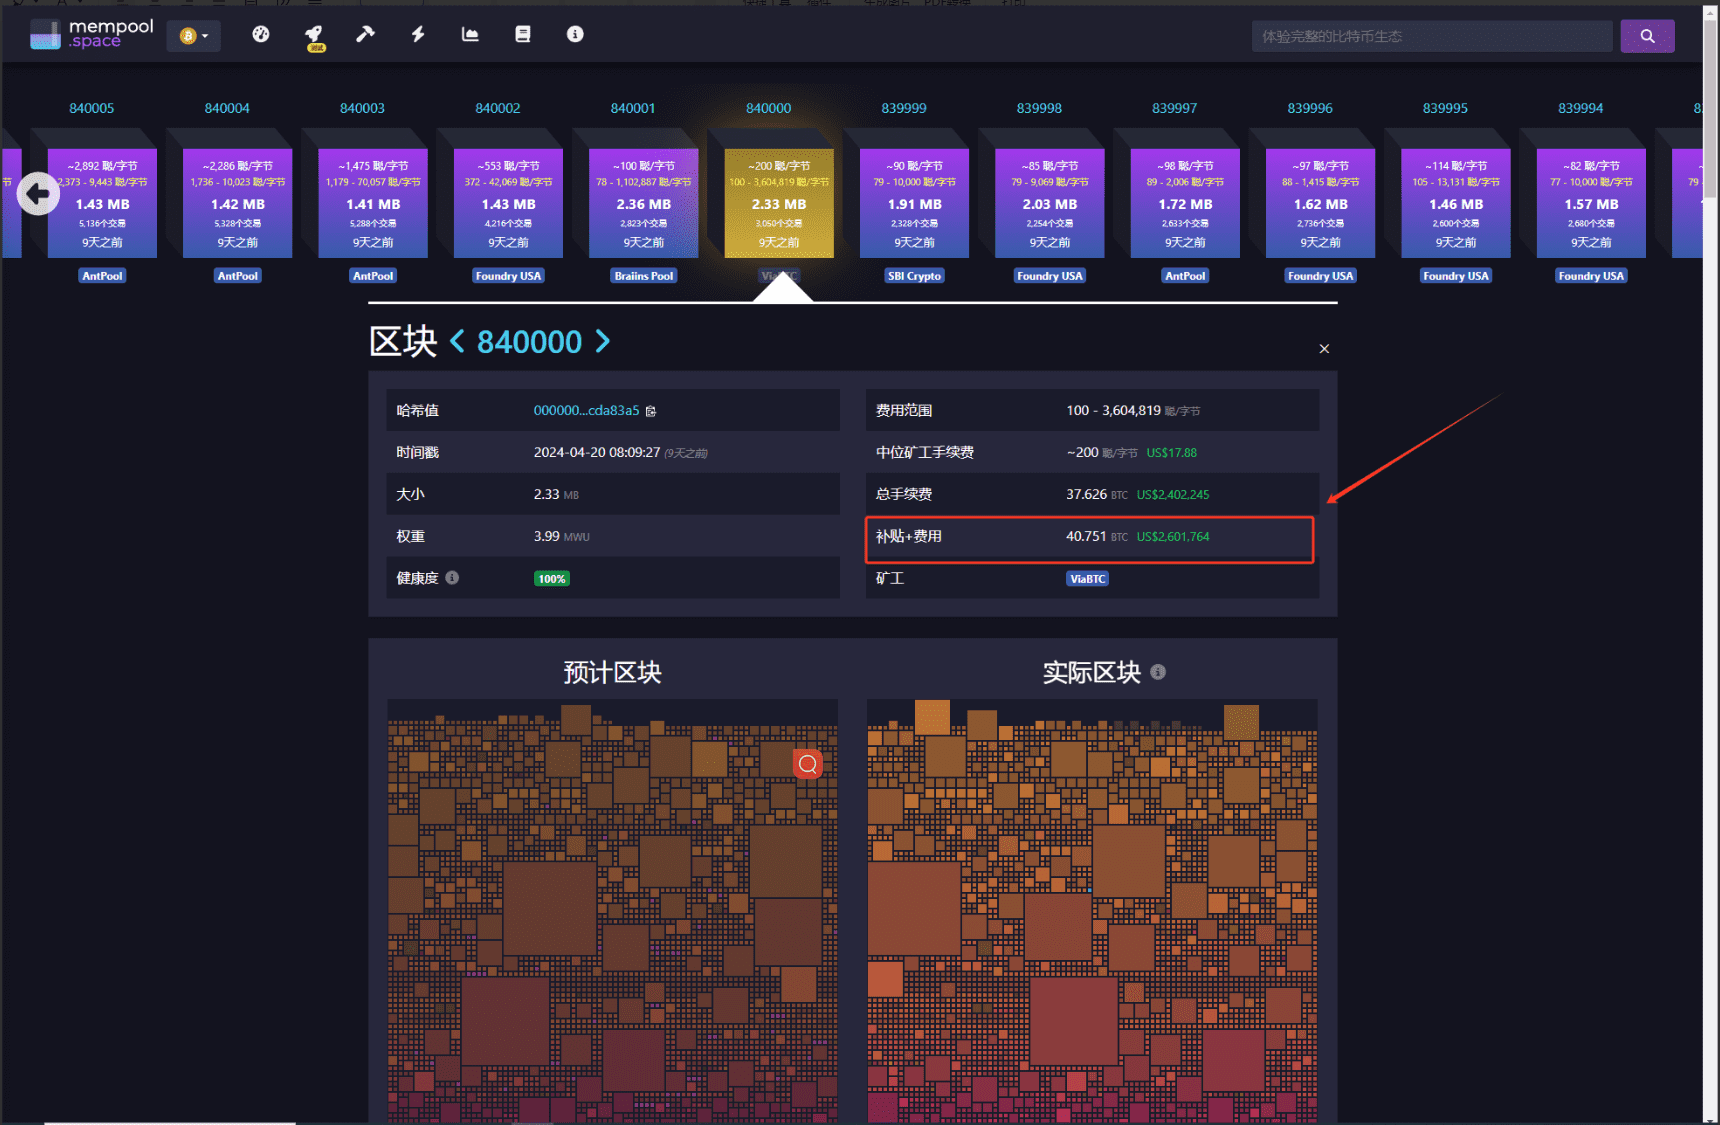
Consideration should be given to the Rune event, which may cause a surge in transaction fees, indirectly increasing miners' overall income.
However, the halving events in the previous 16 and 22 years did lead to price declines. Recently, JPMorgan Chase and Goldman Sachs have indicated that the halving market has been digested, and the Rune heat seems to have subsided. The market is always full of surprises, and first-hand news and market alerts are particularly important in turbulent markets.
2. Geopolitical Uncertainty
The situation in the Middle East has always been an important factor influencing international politics and the economy. The region is not only a major global oil producer but also a convergence of military and political interests of multiple countries. Therefore, the stability of the Middle East directly affects the global market, especially oil prices and stock market performance, thereby affecting the cryptocurrency market.
Recently, tensions between Iran and Israel have reached new heights. In retaliation for the attack on its embassy in Syria, Iran conducted a large-scale airstrike on Israel. The main market reactions to this include:
(1) Increased Risk Aversion Sentiment: In times of war or geopolitical tension, investors often seek safer investment channels, reducing their holdings of high-risk assets. Cryptocurrencies and the stock market, as higher-risk investment areas, are therefore subject to selling pressure.
(2) Flow of Funds into Safe-Haven Assets: Traditional safe-haven assets such as gold are usually favored in such periods. In contrast, although Bitcoin is considered by some as "digital gold," in such extreme uncertainty, investors may still tend towards more traditional safe assets in the short term.
(3) Intensified Short-Term Price Volatility: As mentioned, the price of Bitcoin experienced significant fluctuations after the event, reflecting the market's instability in response to sudden events.
In summary, the uncertainty in the Middle East has brought significant short-term impacts to the global market and may reshape investors' long-term views on different asset classes.
In this situation, investors need to pay special attention to international political developments and adjust their investment portfolios in a timely manner to cope with potential market fluctuations.
II. Technical Tool to Deal with Turbulence and Observe the Market - Large Orders
Large orders refer to large transactions conducted in the market by large or institutional investors.
1. Types of Trades and Usage Scenarios
(1) Opening Long Large Orders
It is usually considered an indication of market participants' expectations of future price increases, serving as a strong entry signal. When the market trend is upward, entering early can capture the maximum value growth, especially when large orders surge, this trend is usually more obvious.
(2) Opening Short Large Orders
This is a strategy adopted when expecting a market downturn, serving as a signal to exit at the peak. This strategy allows investors to profit at market highs and avoid losses from subsequent declines. A larger single profit corresponds to a successful prediction of a significant price pullback.
(3) Closing Long/Closing Short Large Orders
It is usually used as a profit-taking signal, indicating that investors should close positions or wait and lock in profits. Executing this strategy is usually based on sufficient profits in the market and observing potential reversal signals.
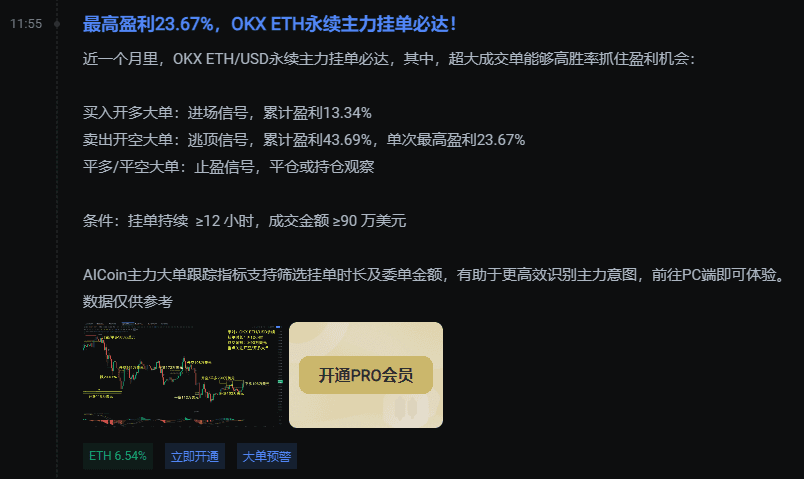
2. OKX ETH Perpetual Large Order Performance in the Past Month
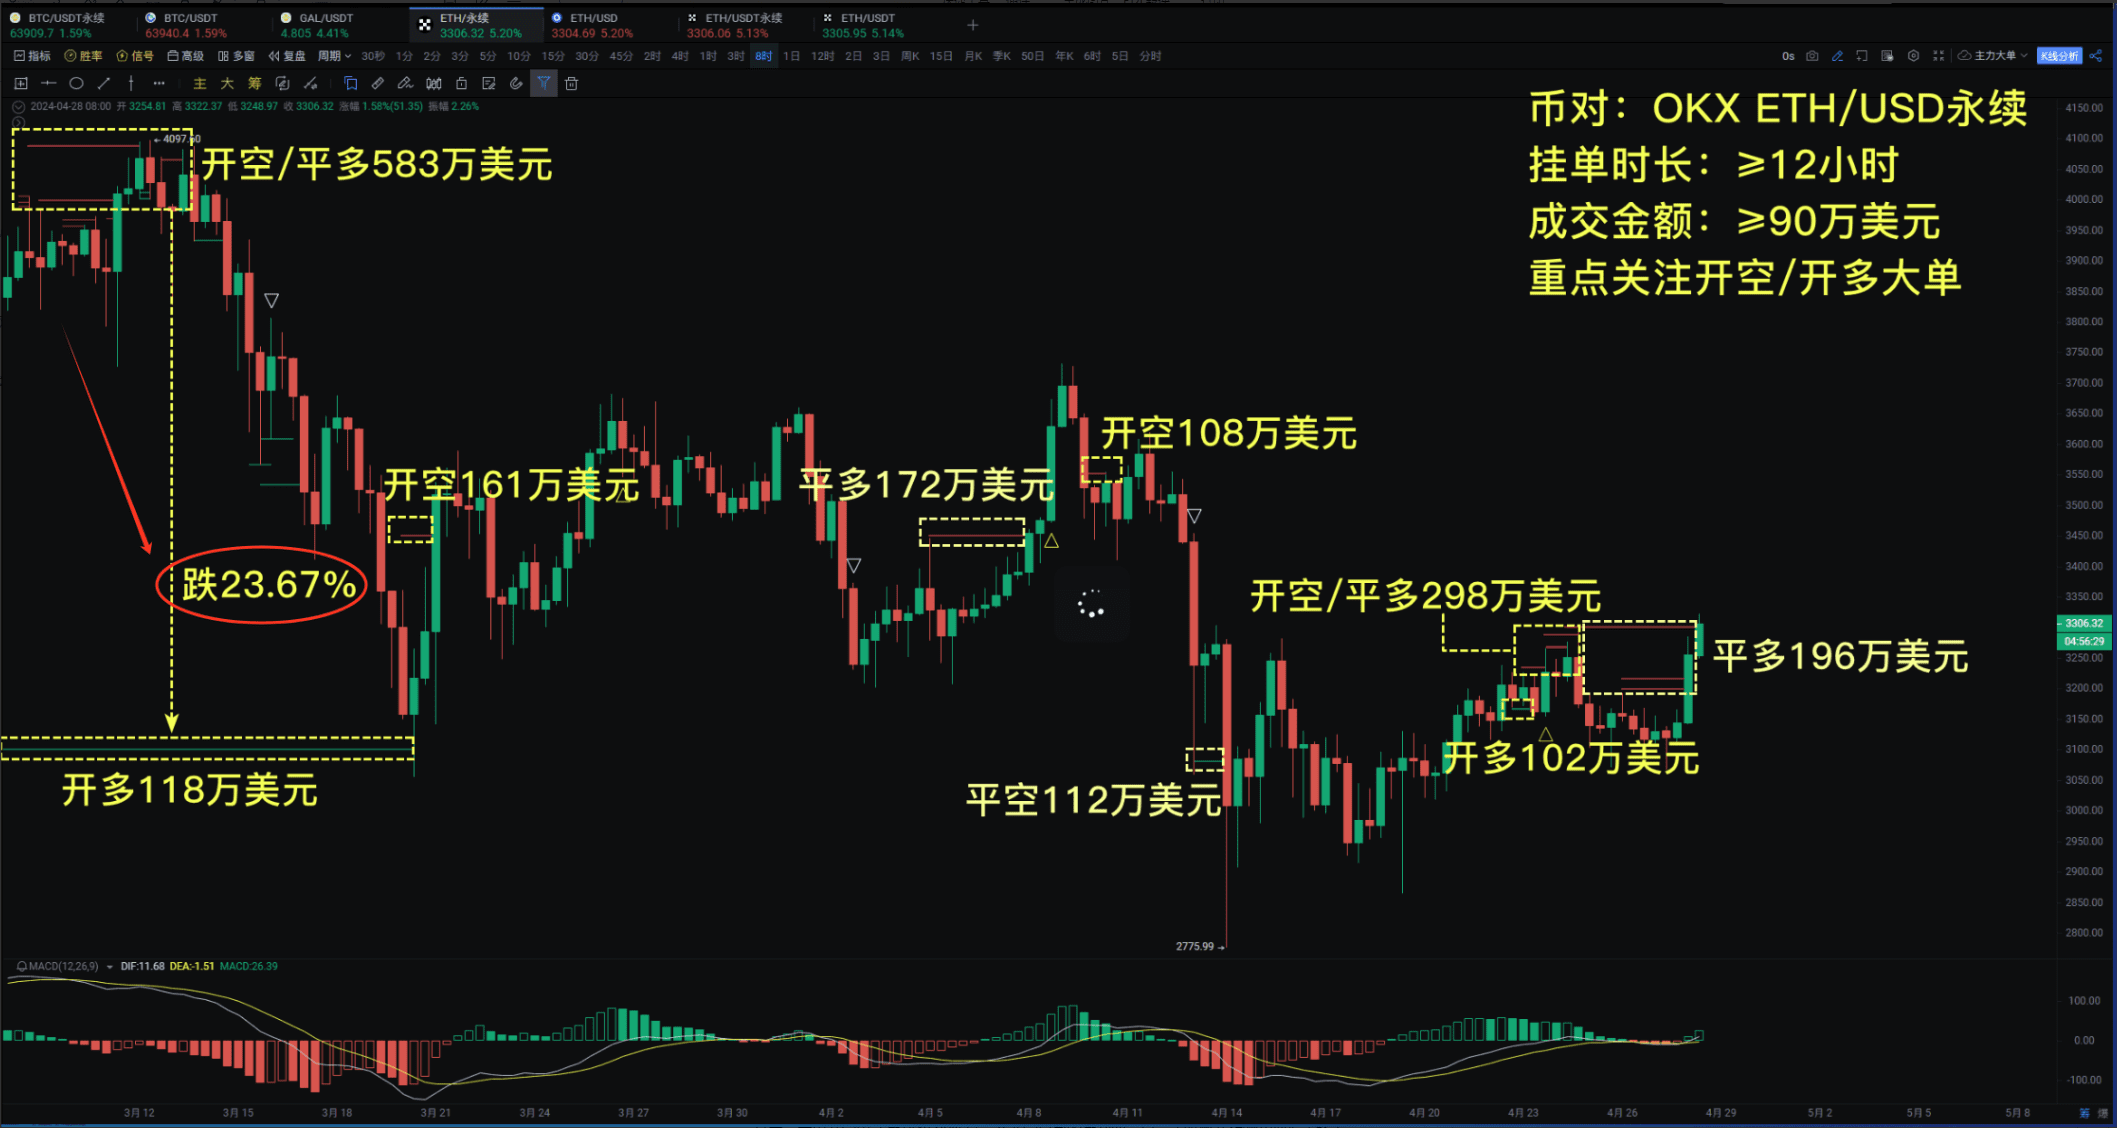
Cumulative profit from opening long positions: 13.34%;
Cumulative profit from opening short positions: 43.69%, with a single highest profit of 23.67%.
The cumulative profit of 43.69% from opening short positions is a very significant profit rate, allowing timely entry at market highs and exit before the decline, fully avoiding potential large-scale losses.
3. Criteria for Filtering Large Orders
Two important criteria - Order Duration and Amount
(1) Successful orders need to last for more than 12 hours
Longer durations of trades better reflect market depth and persistence. Brief trades may only represent momentary fluctuations in the market and lack representativeness. The 12-hour threshold ensures that trades have enough time to attract the attention of other traders and institutions in the market, thus more accurately reflecting market trends.
In addition, a long duration of orders also indicates the trader's firm belief at that price point, possibly implying important market information or analysis supporting the trade.
(2) ETH transaction amount must exceed $900,000, and BTC must exceed $10,000,000
High-value trades usually involve more experienced traders or institutions familiar with market dynamics. The participation of these traders is often based on in-depth market analysis and strong financial support. Therefore, the direction of high-value trades is often more reliable.
In addition, large-value trades have a greater impact on market prices, attracting the attention and reactions of other market participants, forming clearer market trends.
In summary, the large order tracking tool helps users identify dominant forces and their trends in the market by filtering specific trade conditions such as time and amount. This filtering function can reduce market turbulence noise, allowing traders to focus more on trades that lead the market.
III. Technical Tool to Deal with Turbulence and Observe the Market - Signal Alert System
Signal alerts allow us to respond to market changes at any time. In sudden market shifts, a reliable signal alert system can help us adjust strategies in a timely manner and avoid unnecessary losses.
1. The Most Simple and Effective Signal Indicator - RSI, i.e., Relative Strength Index
RSI reflects market strength and weakness by the ups and downs over a certain period.
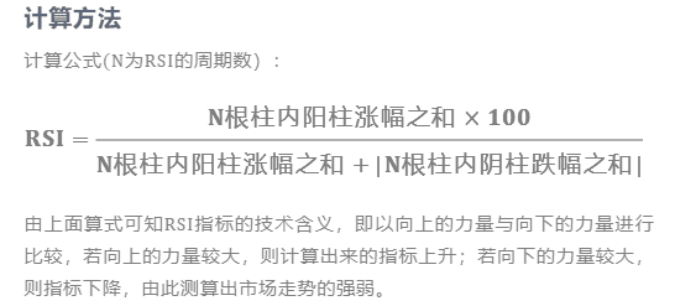
The recommended parameter settings are 6, 12, 24, corresponding to short-term, medium-term, and long-term RSI, respectively.
The basic rules of RSI are to observe overbought or oversold conditions in the short-term market. The shorter the period, the higher the sensitivity; the longer the period, the more stable the trend but with reduced sensitivity.
(1) Classic Usage 1 - Overbought/Oversold Trading Method
The recommended parameters are set at 6-14-24, and an hourly cycle is recommended.
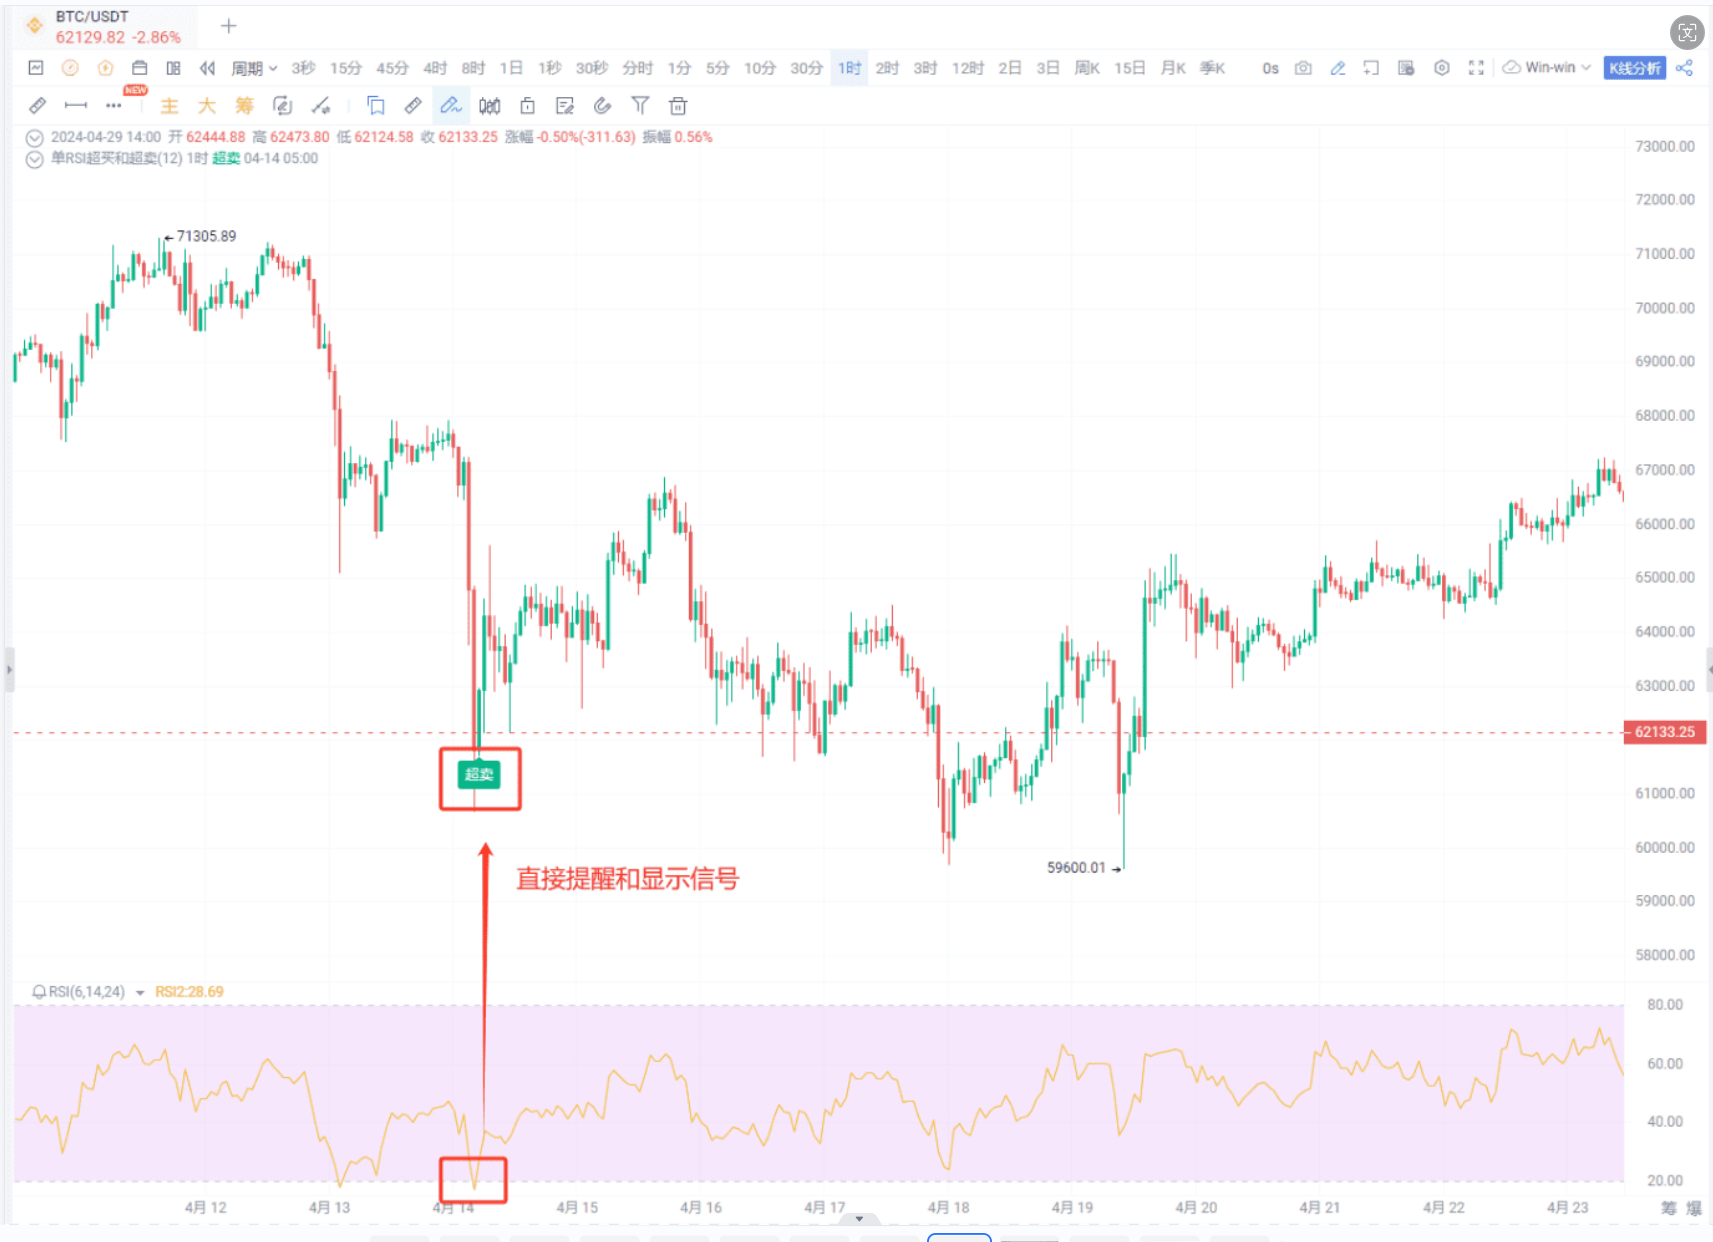
Oversold: RSI below 20, suitable for buying; Overbought: RSI above 80, suitable for selling; For example:
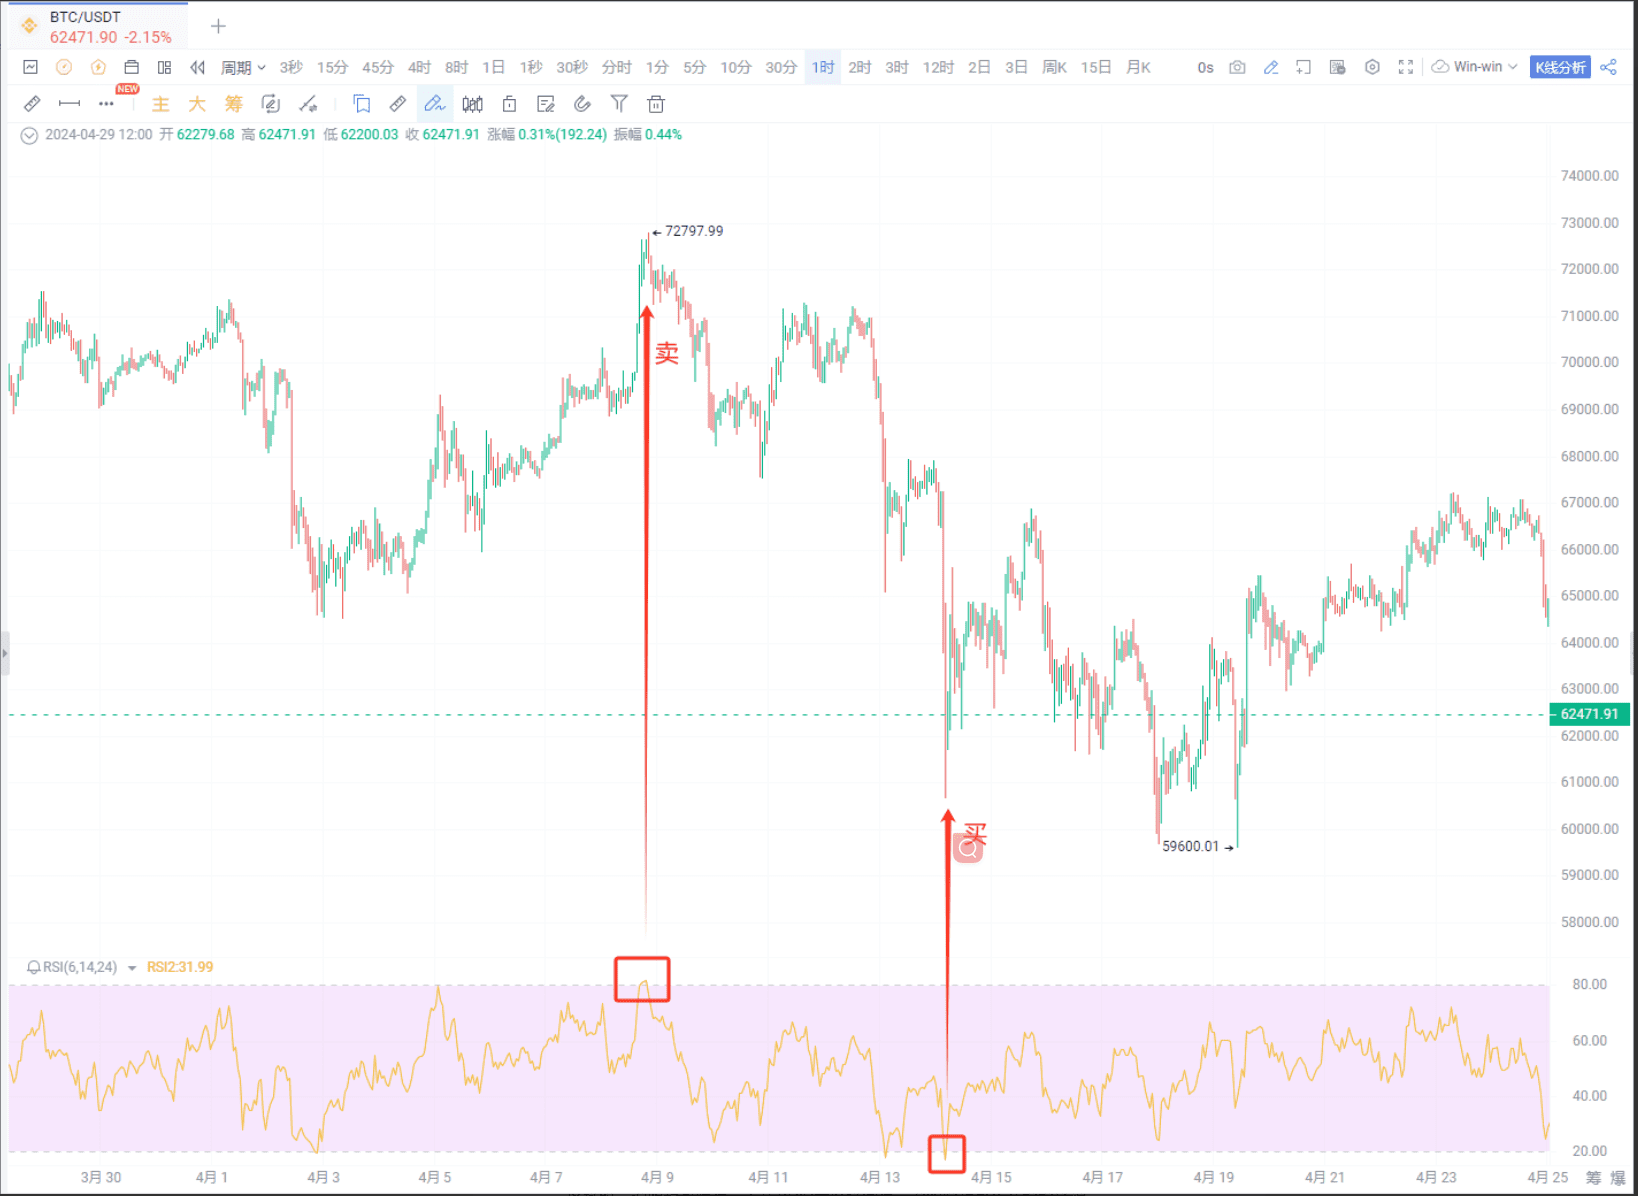
It is important to note that overbought and oversold conditions are important references for short-term trend judgments. Just breaking through the overbought/oversold area indicates a strong trend. If the price falls back from the overbought/oversold area, it indicates that the original trend is slowly weakening.
(2) Classic Usage 2 - Golden Cross/Death Cross Trading Method
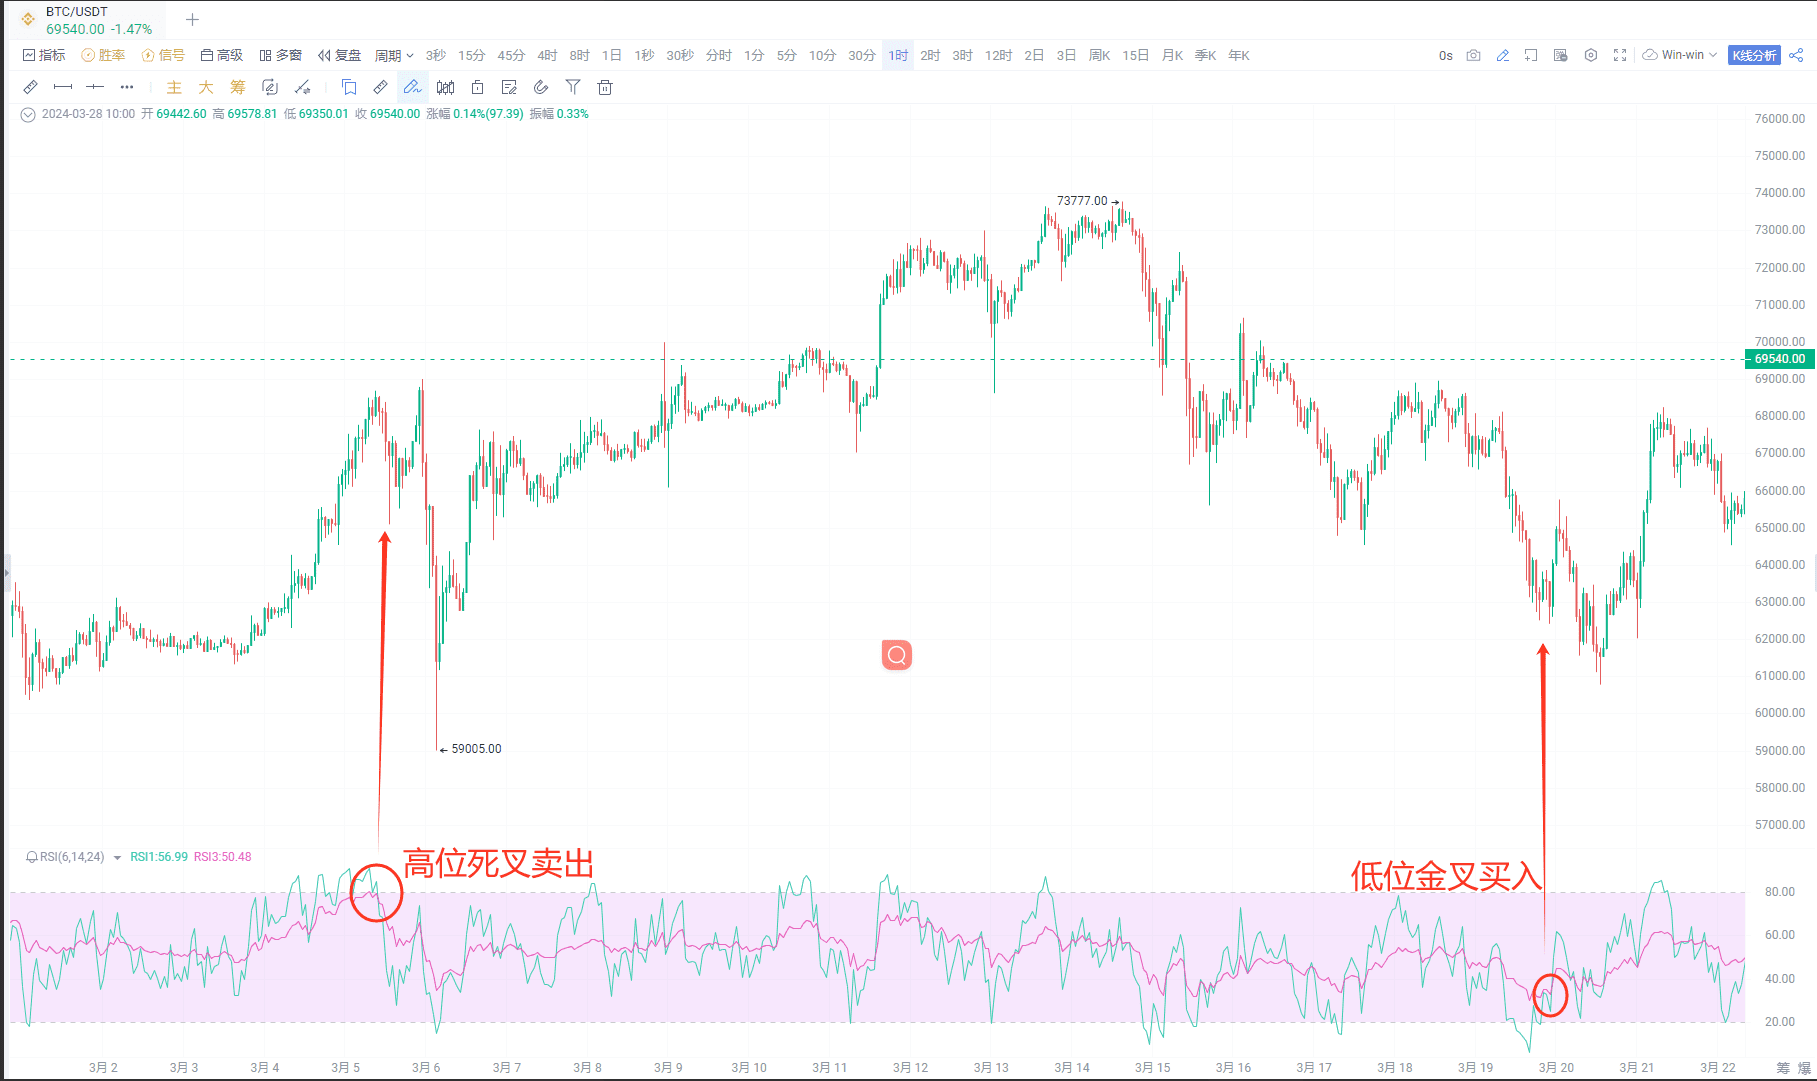
The parameters are set at 6-14-24;
Buy signal: Short-term RSI crosses above long-term RSI, indicating a golden cross signal;
Sell signal: Short-term RSI crosses below long-term RSI, indicating a death cross signal.
(3) Considerations for Using RSI
1) The RSI indicator may become dull above 90 or below 10, with little significance in judgment.
2) RSI's judgment is not significant in the 40-60 range.
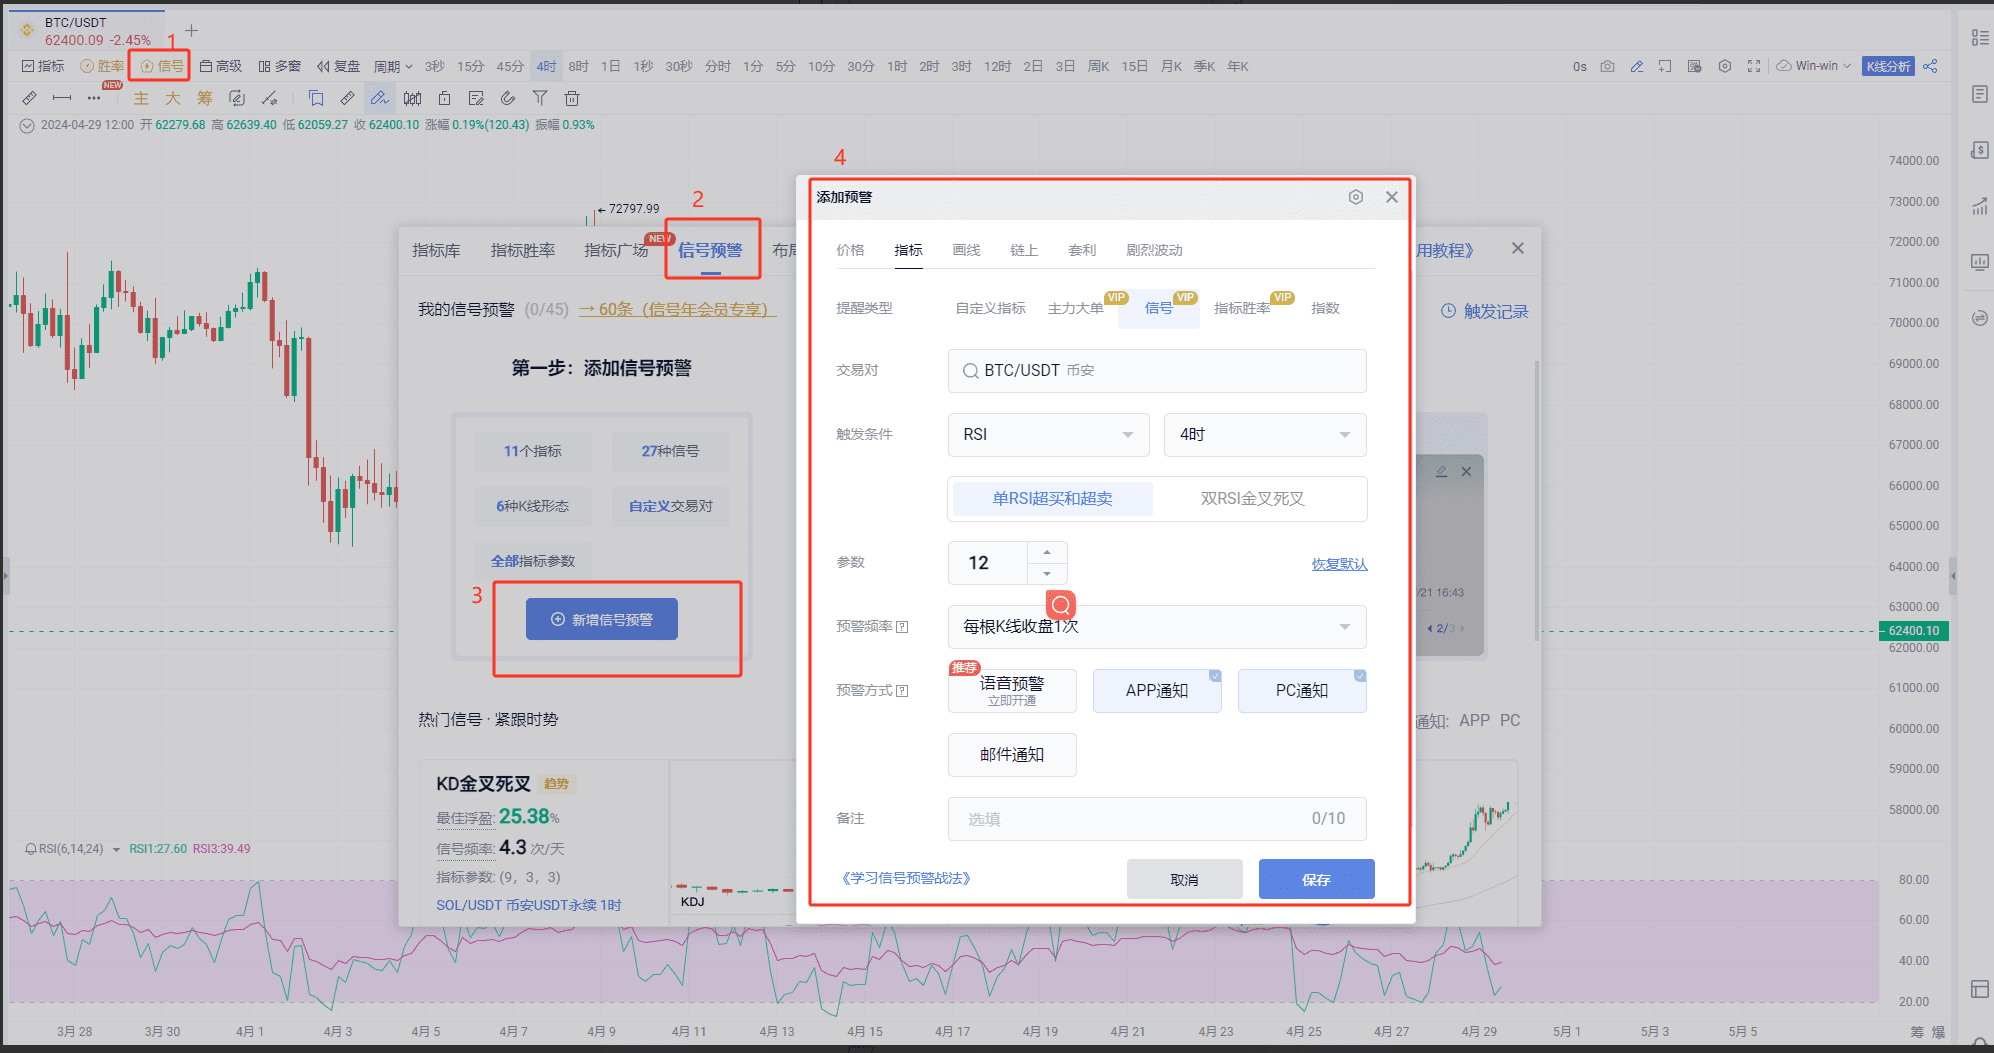
(4) Setting RSI Signal Alerts
IV. Analysis by Xiao A
Xiao A can help interpret candlestick charts. Xiao A analysis uses machine learning algorithms to identify chart patterns, predict market trends, and provide support for trading decisions.
Advantages of AI-based analysis: Compared to traditional analysis tools, Xiao A analysis can process large amounts of data faster and more accurately, discovering patterns that human analysts may overlook.
1. Application 1: Xiao A's Quick News Interpretation
For example: TIA's trading volume surged in the morning of the 29th.
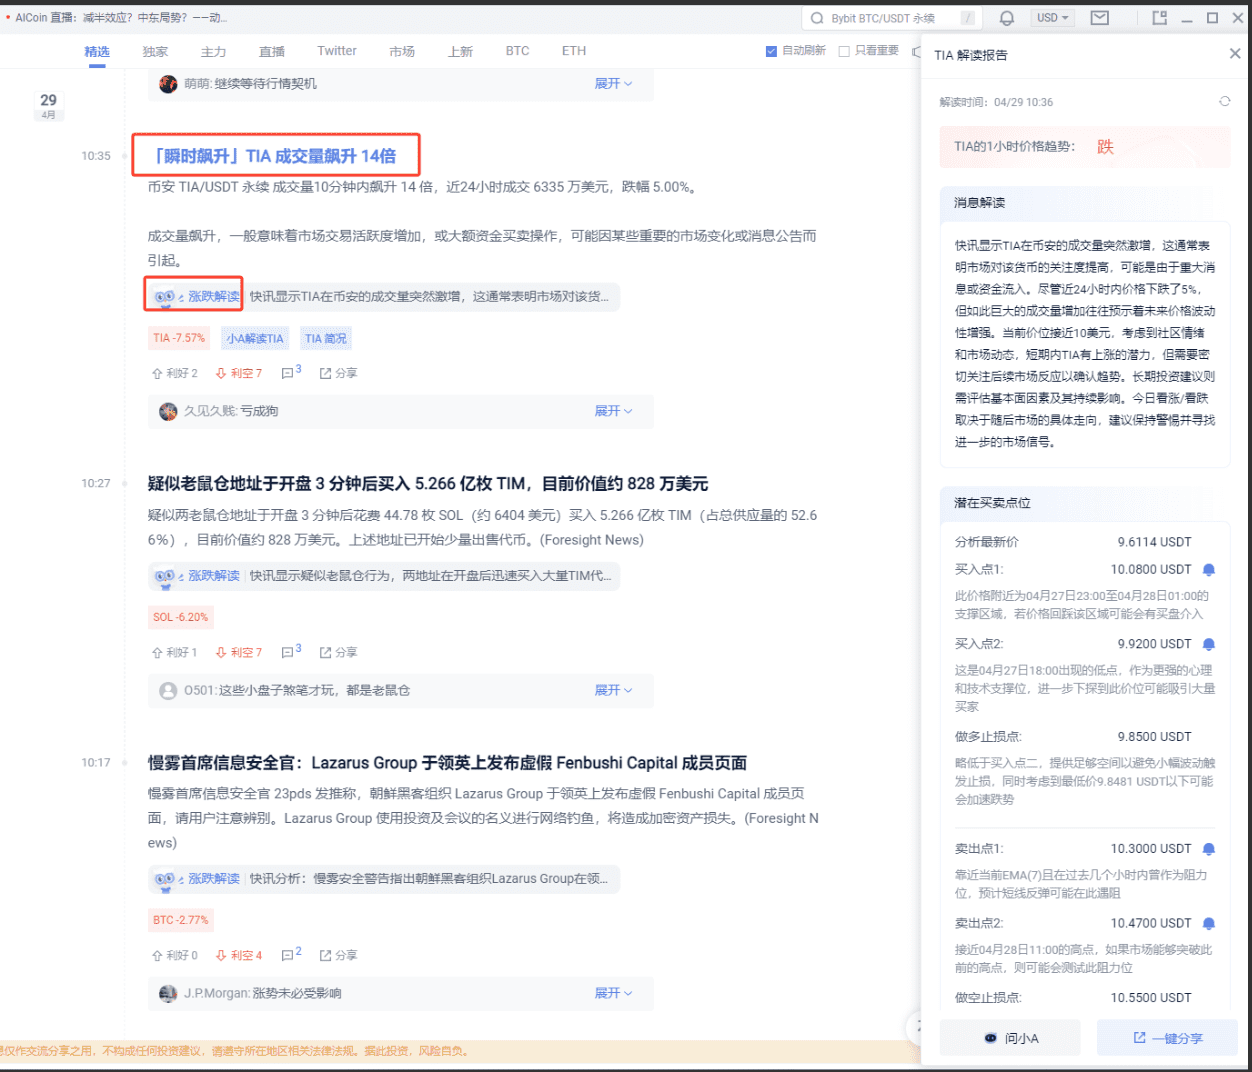
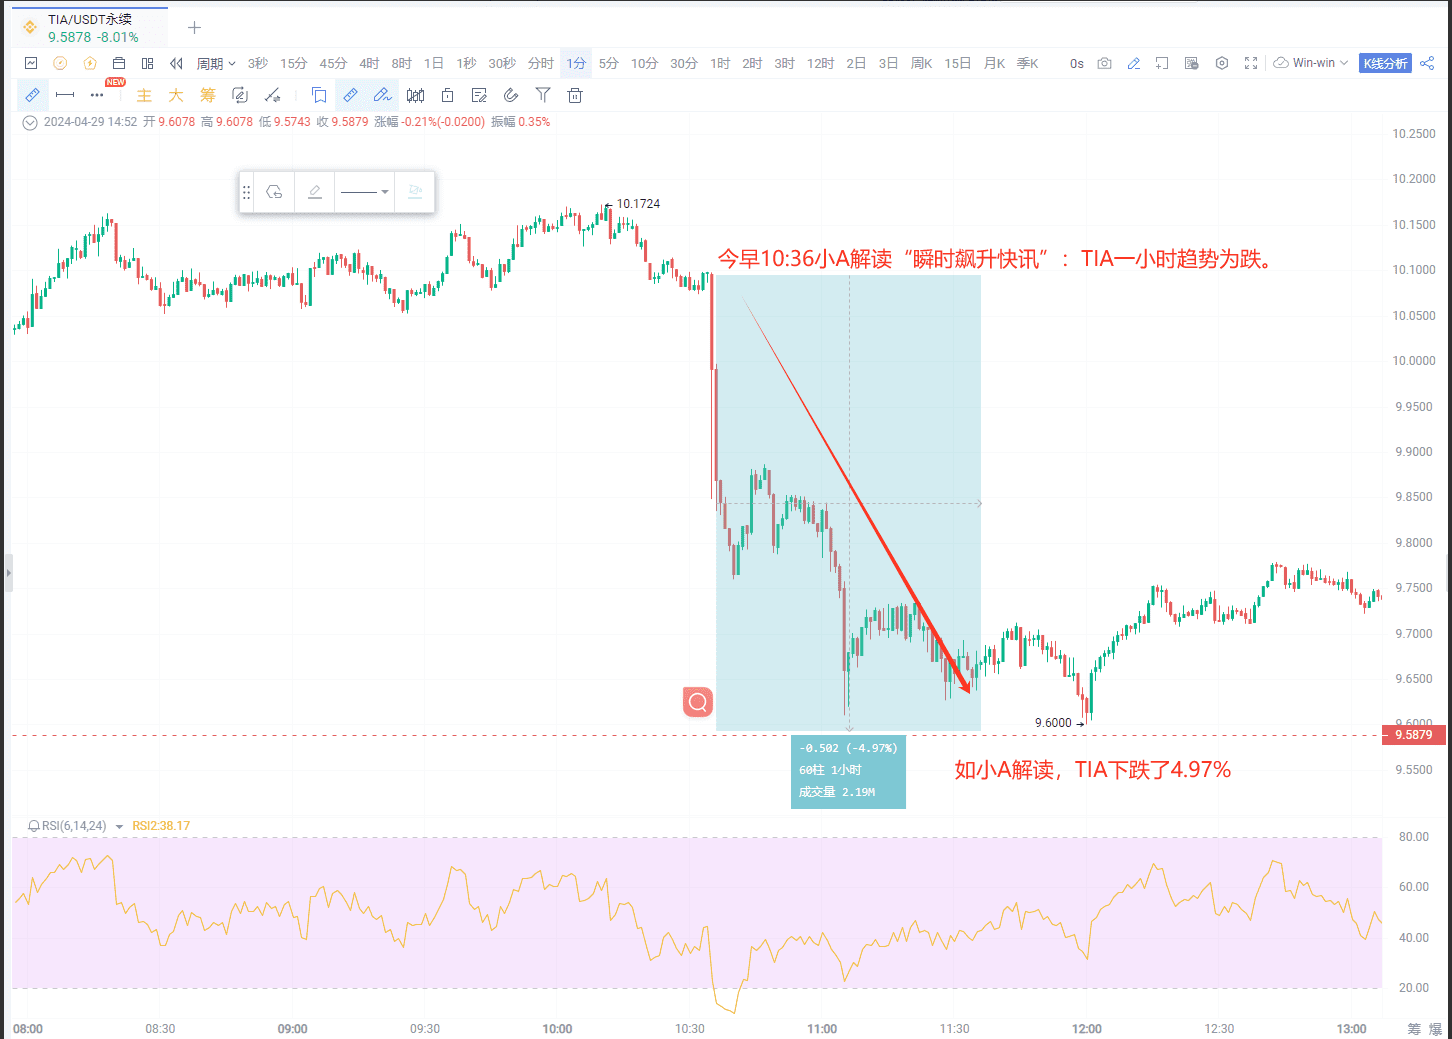
In addition to providing guidance on positions, Xiao A also objectively evaluates and analyzes timely news for reference, supplementing information that users may usually overlook, for a comprehensive reference.
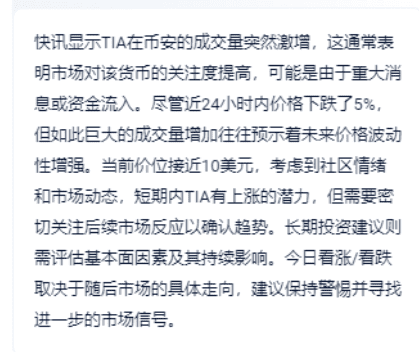
The market's attention to this currency has increased, and the underlying reasons could be significant news or large fund inflows.
2. Application 2: Xiao A Refines Useful Information from Quick News, Clear Interpretation of Coin Dynamics
Let Xiao A interpret ETH:
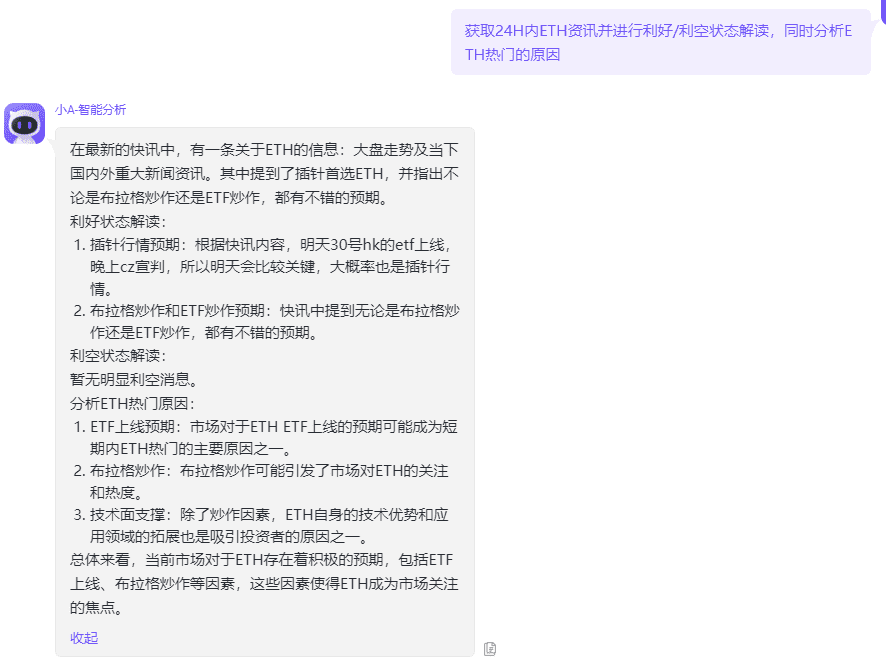
You can use your own methods to cross-verify Xiao A's interpretation from multiple dimensions.
V. Conclusion
When integrating these tools into your trading strategy, remember that no tool is 100% accurate. Therefore, the best practice is to use a combination of tools and always maintain risk management measures.
The PRO version supports chip distribution, display of large orders, AI-written indicators, Xiao A analysis, and more. You can click the link to learn more and experience it: https://aicoin.app/en/vip/chartpro
Recommended Reading
For more live content, please follow AICoin's "News/Information - Live Review" section, and feel free to download AICoin PC-end
免责声明:本文章仅代表作者个人观点,不代表本平台的立场和观点。本文章仅供信息分享,不构成对任何人的任何投资建议。用户与作者之间的任何争议,与本平台无关。如网页中刊载的文章或图片涉及侵权,请提供相关的权利证明和身份证明发送邮件到support@aicoin.com,本平台相关工作人员将会进行核查。


