On the afternoon of April 24th, AICoin researchers conducted a live graphic and text sharing session titled "Exploring the TD Golden Partner in the Halving Market Situation (with Membership Giveaway)" in the AICoin PC-end Group Chat Live. Below is a summary of the live content.
I. Objectives and Uses of the TD Strategy
It can predict potential reversal points in the market trend and provide trading signal prompts based on technical analysis for the best timing to buy or sell. By combining the left-side trading and right-side trading mindset, it allows everyone to maximize profits and minimize risks in the investment process.
II. TD Nine-Turn Classic Tactics
1. Core Strategy
Used to identify potential market tops and bottoms and grasp market trends.
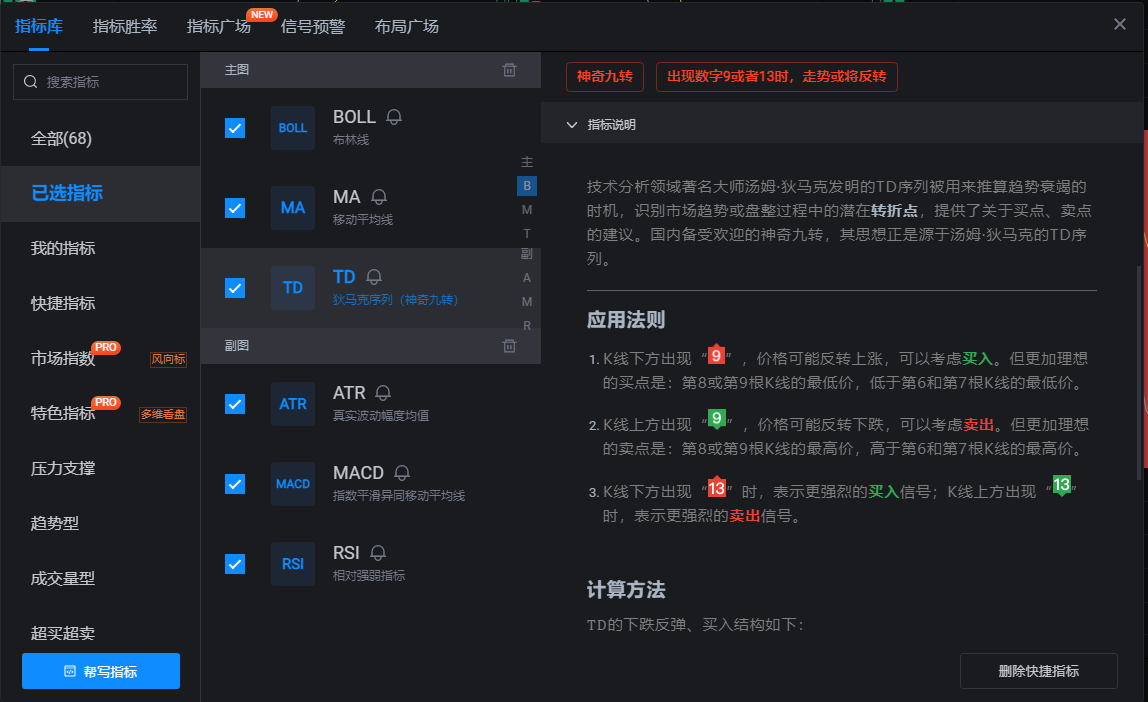
2. Conditions for Buying when TD is Formed
(1) When the closing price of one candlestick is lower than the closing price of the previous 4 candlesticks, triggering a buy structure and starting the count; (2) When 9 consecutive candlesticks have closing prices lower than the closing prices of their respective previous 4 candlesticks, it forms a TD buy structure. (During this process, if any candlestick does not meet the condition, the count needs to be restarted)
3. Conditions for Selling when TD is Formed
(1) When the closing price of one candlestick is higher than the closing price of the previous 4 candlesticks, triggering a sell structure and starting the count; (2) When 9 consecutive candlesticks have closing prices higher than the closing prices of their respective previous 4 candlesticks, it forms a TD sell structure. (During this process, if any candlestick does not meet the condition, the count needs to be restarted)
4. Special Cases
If it reaches 13, it becomes a reinforced buy/sell structure.
5. Scope and Defects
The TD indicator is only suitable for oscillating markets of indices and individual stocks, weak bull markets, and weak bear markets. When stock prices or indices are in a major bear market or bull market, the directional nature of the magical nine-turn indicator is not very clear. At this time, it should be combined with market sentiment, fundamentals, and other indicators to assess the current trend.
III. TD Nine-Turn Advanced Tactics
1. Composition of Indicators
(1) Dynamic trend line: includes long-term and short-term moving averages to identify market trends. (2) Momentum indicators: combined use of RSI and MACD to detect the strength and direction of market momentum.
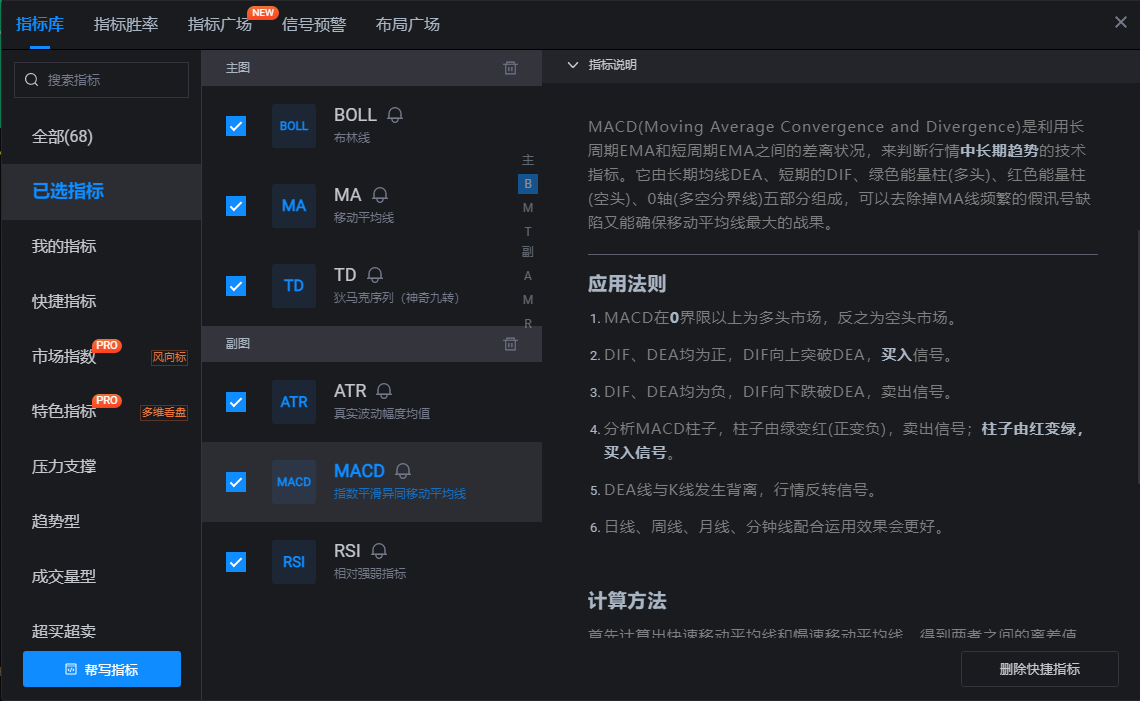
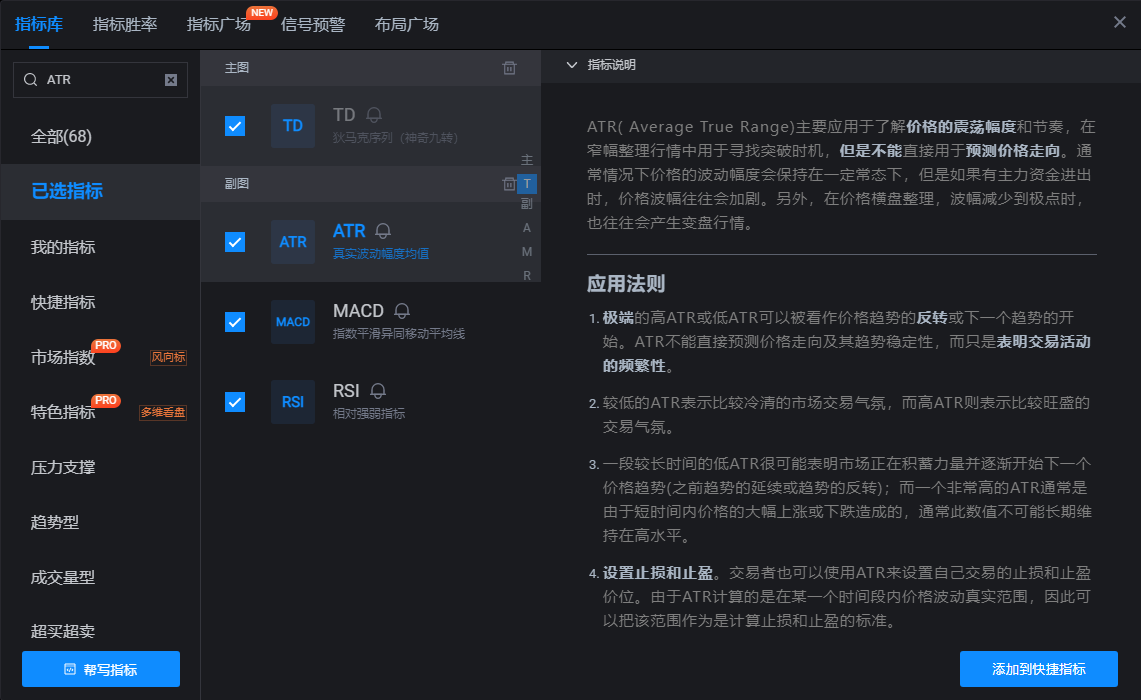
(3) Volatility indicators: use ATR or Bollinger Bands to measure market volatility and assist in trading decisions.
IV. Operational Logic of TD Nine-Turn Advanced Tactics
For example: using the TD indicator to determine the selling point in an upward trend, and using other indicators to determine the buying point. Trading signal generation (TD): when the TD Sequential completes a complete buying or selling cycle (such as 13-9-9) and is consistent with support/resistance levels, a buying or selling signal is issued.
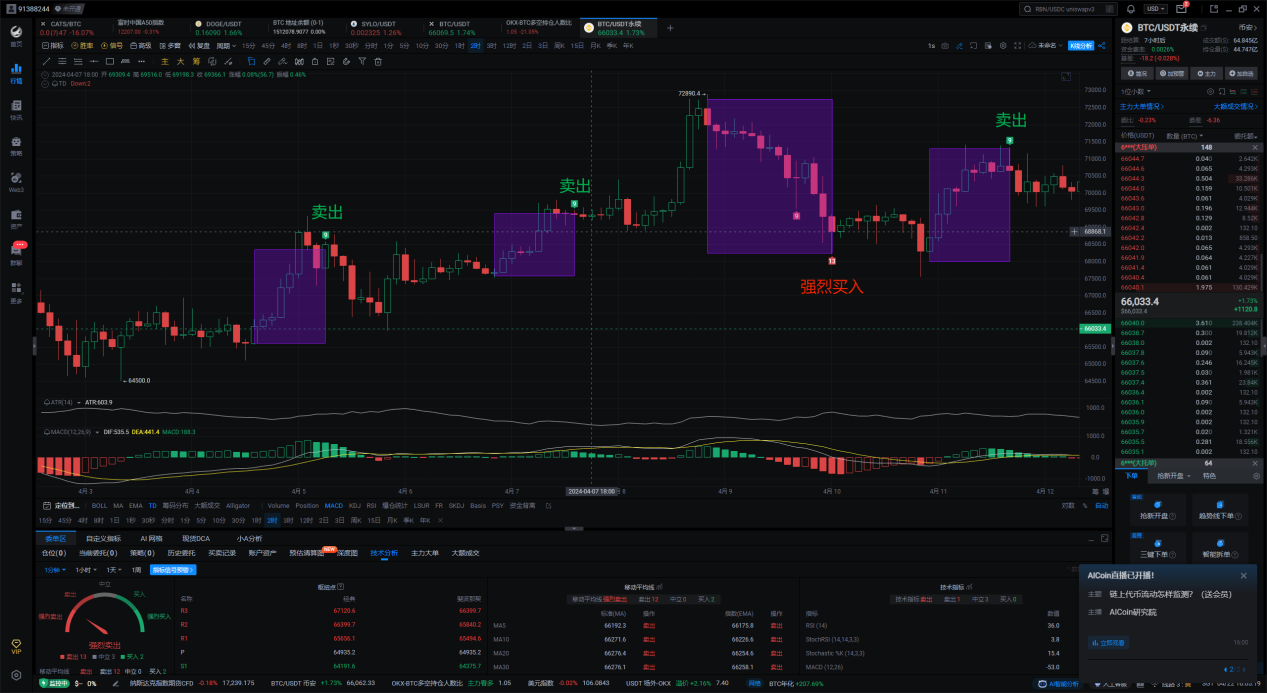
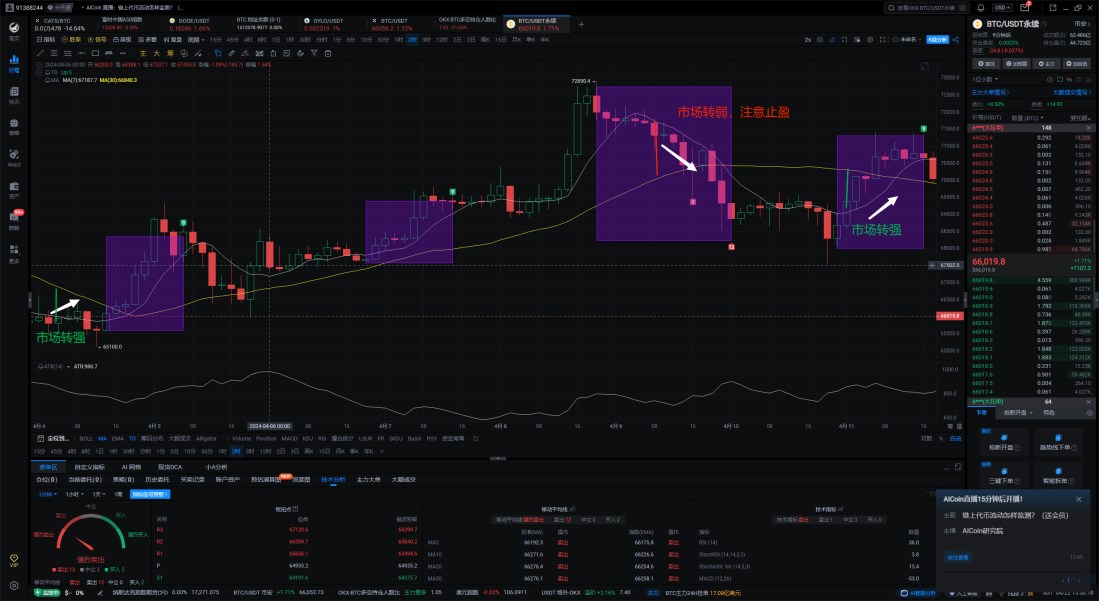
1. Trend Identification Method (MA): Set the time to 2 hours to avoid the influence of market sentiment
Rule: MA(7) crossing above MA(30) indicates an upward trend, while MA(7) crossing below MA(30) indicates a downward trend. Specific adjustments can be made for medium to long-term trades based on the position and slope of the moving averages.
2. Overbought/Oversold Method (RSI, MACD)
RSI or MACD confirms overbought or oversold conditions. Using them individually or in combination can improve the accuracy of buying points. At this time, we focus on the significant increase in the TD indicator (from 22:00 on April 10th to 16:00 on April 11th).
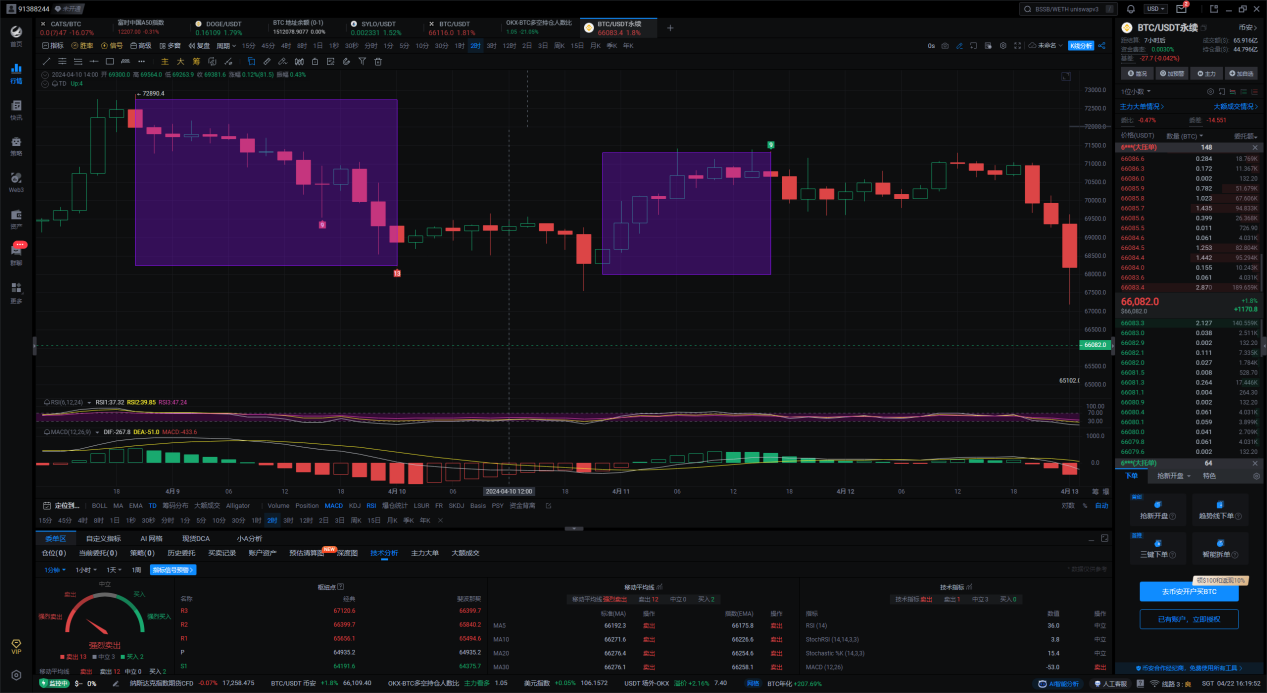
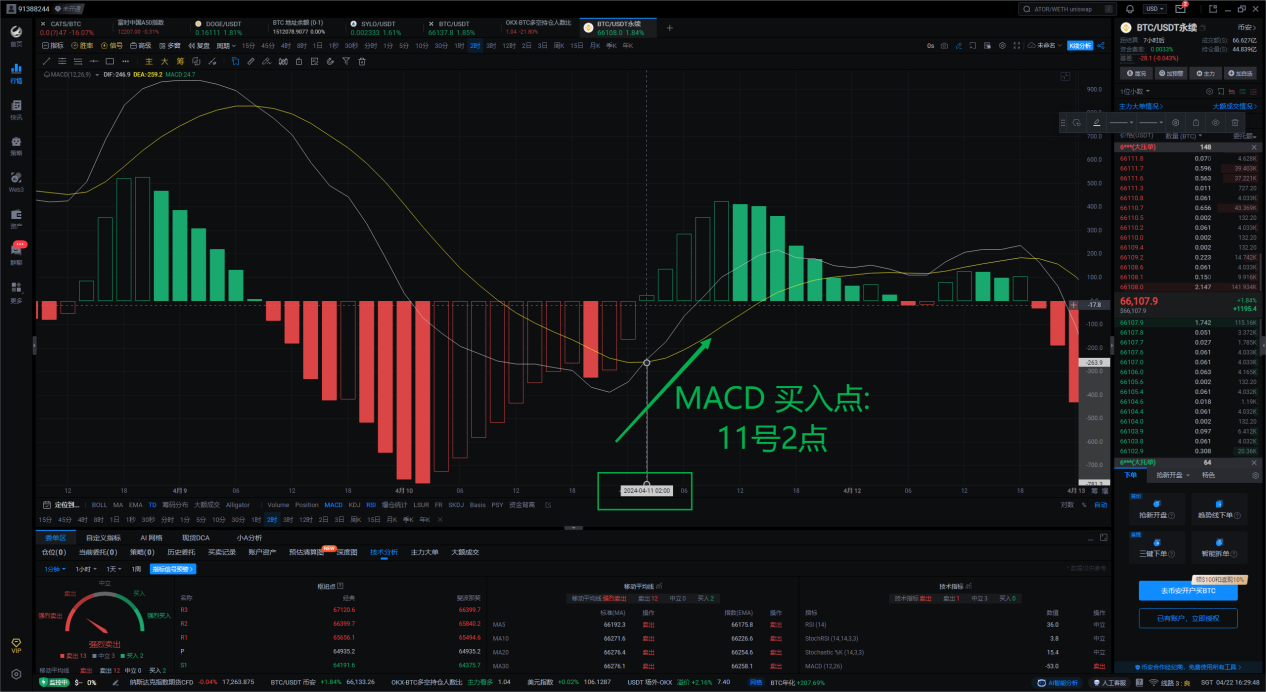
MACD Divergence Method: Rule: DIF crossing below DEF in an upward trend indicates a buy signal, while DIF crossing above DEF in a downward trend indicates a sell signal.
RSI Divergence Method: Rule: Crossing above 30 in an upward trend indicates a buy signal, while crossing below 70 in a downward trend indicates a sell signal.
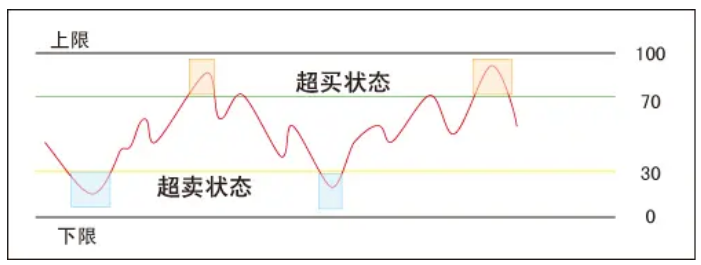
At this time, RSI falls into the oversold area, rebounds back above 30%, and forms another downward trend without falling back into the oversold area, followed by a surge above the recent high point on the 10th at 22:00.
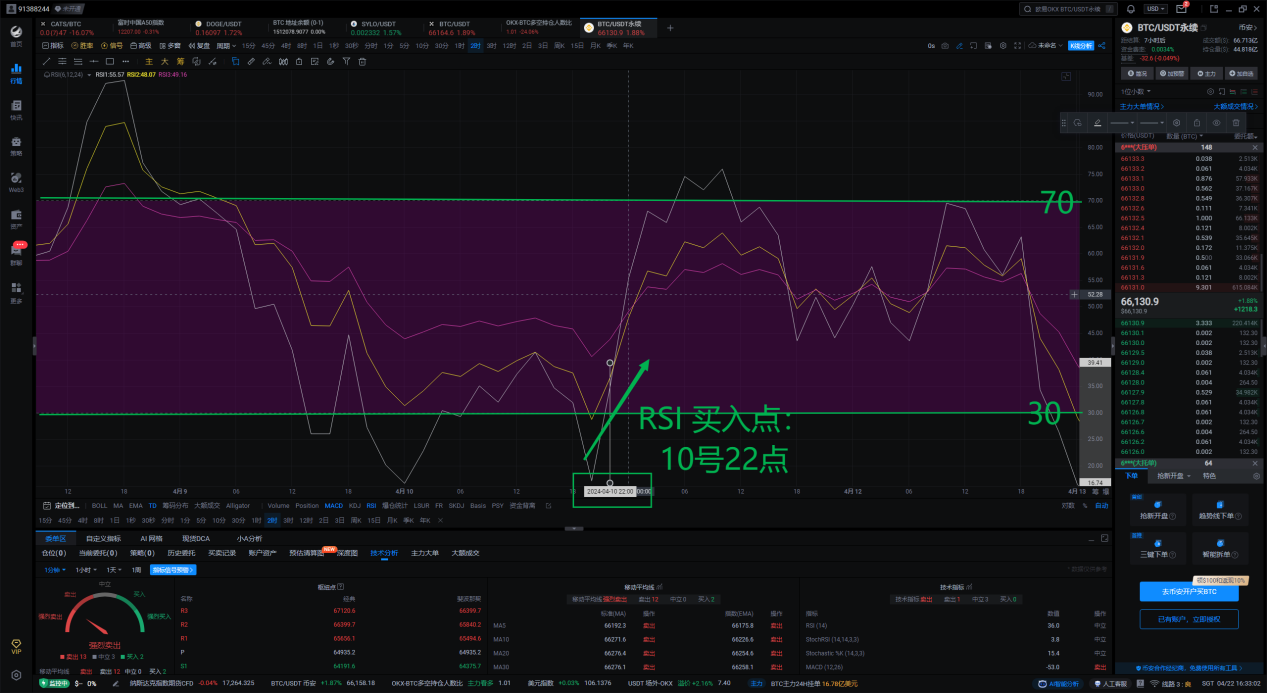
By opening the custom indicator subgraph, it can be determined that the buying points are RSI: 22:00 on the 10th and MACD: 2:00 on the 11th. The accuracy of the buying points at this time is RSI > MACD.
3. Summary of RSI and MACD Win Rates
Difference: The MACD indicator tends to judge the trend of the market, while the RSI indicator judges the highs and lows, pullbacks and rebounds, continuations, and reversals within the market trend. Sometimes they may also give conflicting indications. For example, RSI may show a reading persistently above 70, indicating that the security is overbought. But MACD may indicate that the buying momentum of the security is still increasing, generally following the signal of the MACD indicator.
4. Combining MACD with TD
(1) Combining TD Sequential with MACD divergence: in a trending market, combining MACD divergence can provide more accurate reversal signals. (2) TD Sequential performs well in oscillating markets and during counter-trend pullbacks, especially when combined with MACD divergence.
5. Choosing Profit-Taking and Stop-Loss Points
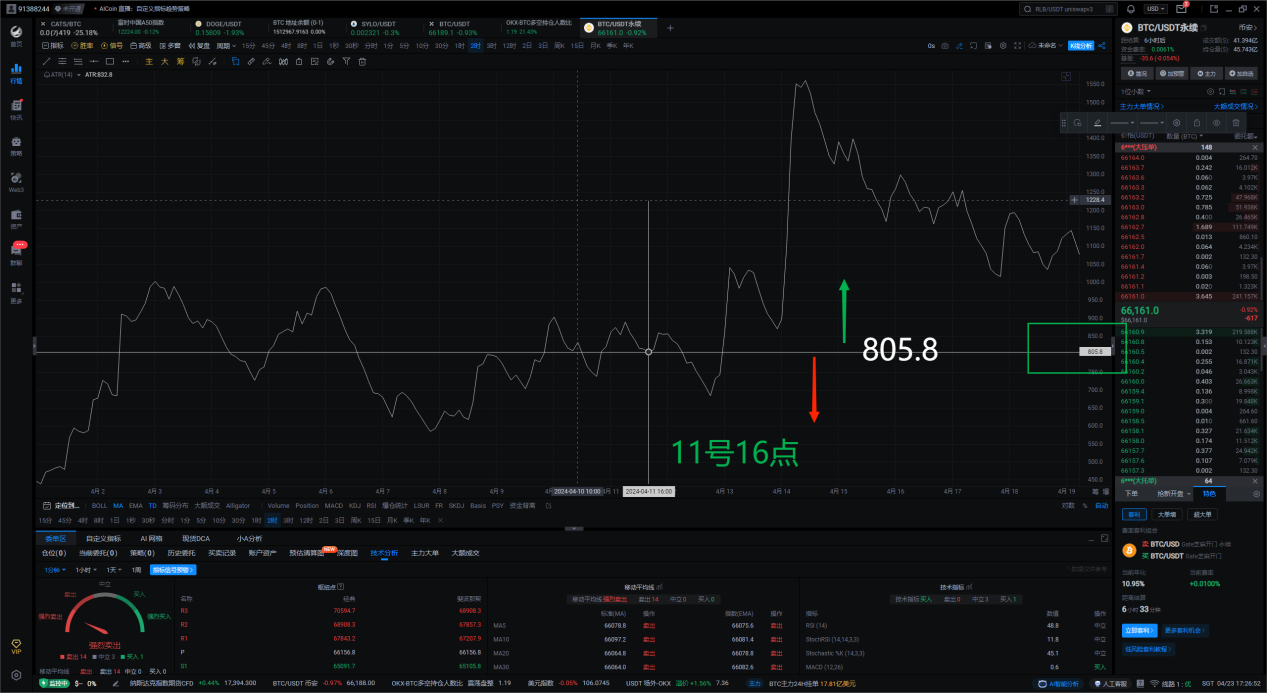
Entry and exit method (ATR): combine ATR to set reasonable stop-loss and target prices.
(1) Setting profit-taking: for long positions, the profit-taking point can be set as "purchase price + (2 x ATR value)." For short positions, it can be set as "selling price - (2 x ATR value)." (2) Setting stop-loss: for long positions, the stop-loss can be set at "purchase price - (1 x ATR value)." For short positions, it can be set at the position of "selling price + (1 x ATR value)."
This method is suitable for defining clear entry points (such as the first closed bar chart after confirming TD 9) and exit points (such as reaching the preset support/resistance levels or TD cancellation signals).
For example, around the time of the TD signal issuance, the profit-taking and stop-loss operations are based on the ATR (805.8) at that time:
V. Conclusion
Backtesting this indicator on historical data, the TD Nine-Turn indicator, when combined with related MA/MACD/RSI/ATR indicators in oscillating markets, helps determine buying and selling points. At the same time, in major bull and bear markets, parameters can be adjusted (such as moving average periods, RSI and MACD settings, etc.) to achieve the best trading results.
PRO members and Signal Alert members are premium tools tailored for lazy friends. Custom indicators can help any AICoin user to plan their trades and trade their plans. If you want to see more custom indicator strategy demonstrations and multiple alert reminders, feel free to subscribe to Signal Alert/PRO K-line, both of which offer a limited-time free trial of the custom indicator membership. Click the link below to subscribe and experience: https://aicoin.app/en/vip/chartpro
Recommended Reading
For more live content, please follow AICoin's "News/Information-Live Review" section, and feel free to download AICoin PC-end
免责声明:本文章仅代表作者个人观点,不代表本平台的立场和观点。本文章仅供信息分享,不构成对任何人的任何投资建议。用户与作者之间的任何争议,与本平台无关。如网页中刊载的文章或图片涉及侵权,请提供相关的权利证明和身份证明发送邮件到support@aicoin.com,本平台相关工作人员将会进行核查。


