On the evening of April 23, AICoin researchers conducted a live graphic and textual sharing of the "Custom Indicator Trend Strategy (with Membership)" in the AICoin PC-end Group Chat Live. Below is a summary of the live content.
I. EMA Custom Indicator Strategy
1. Strategy Effect
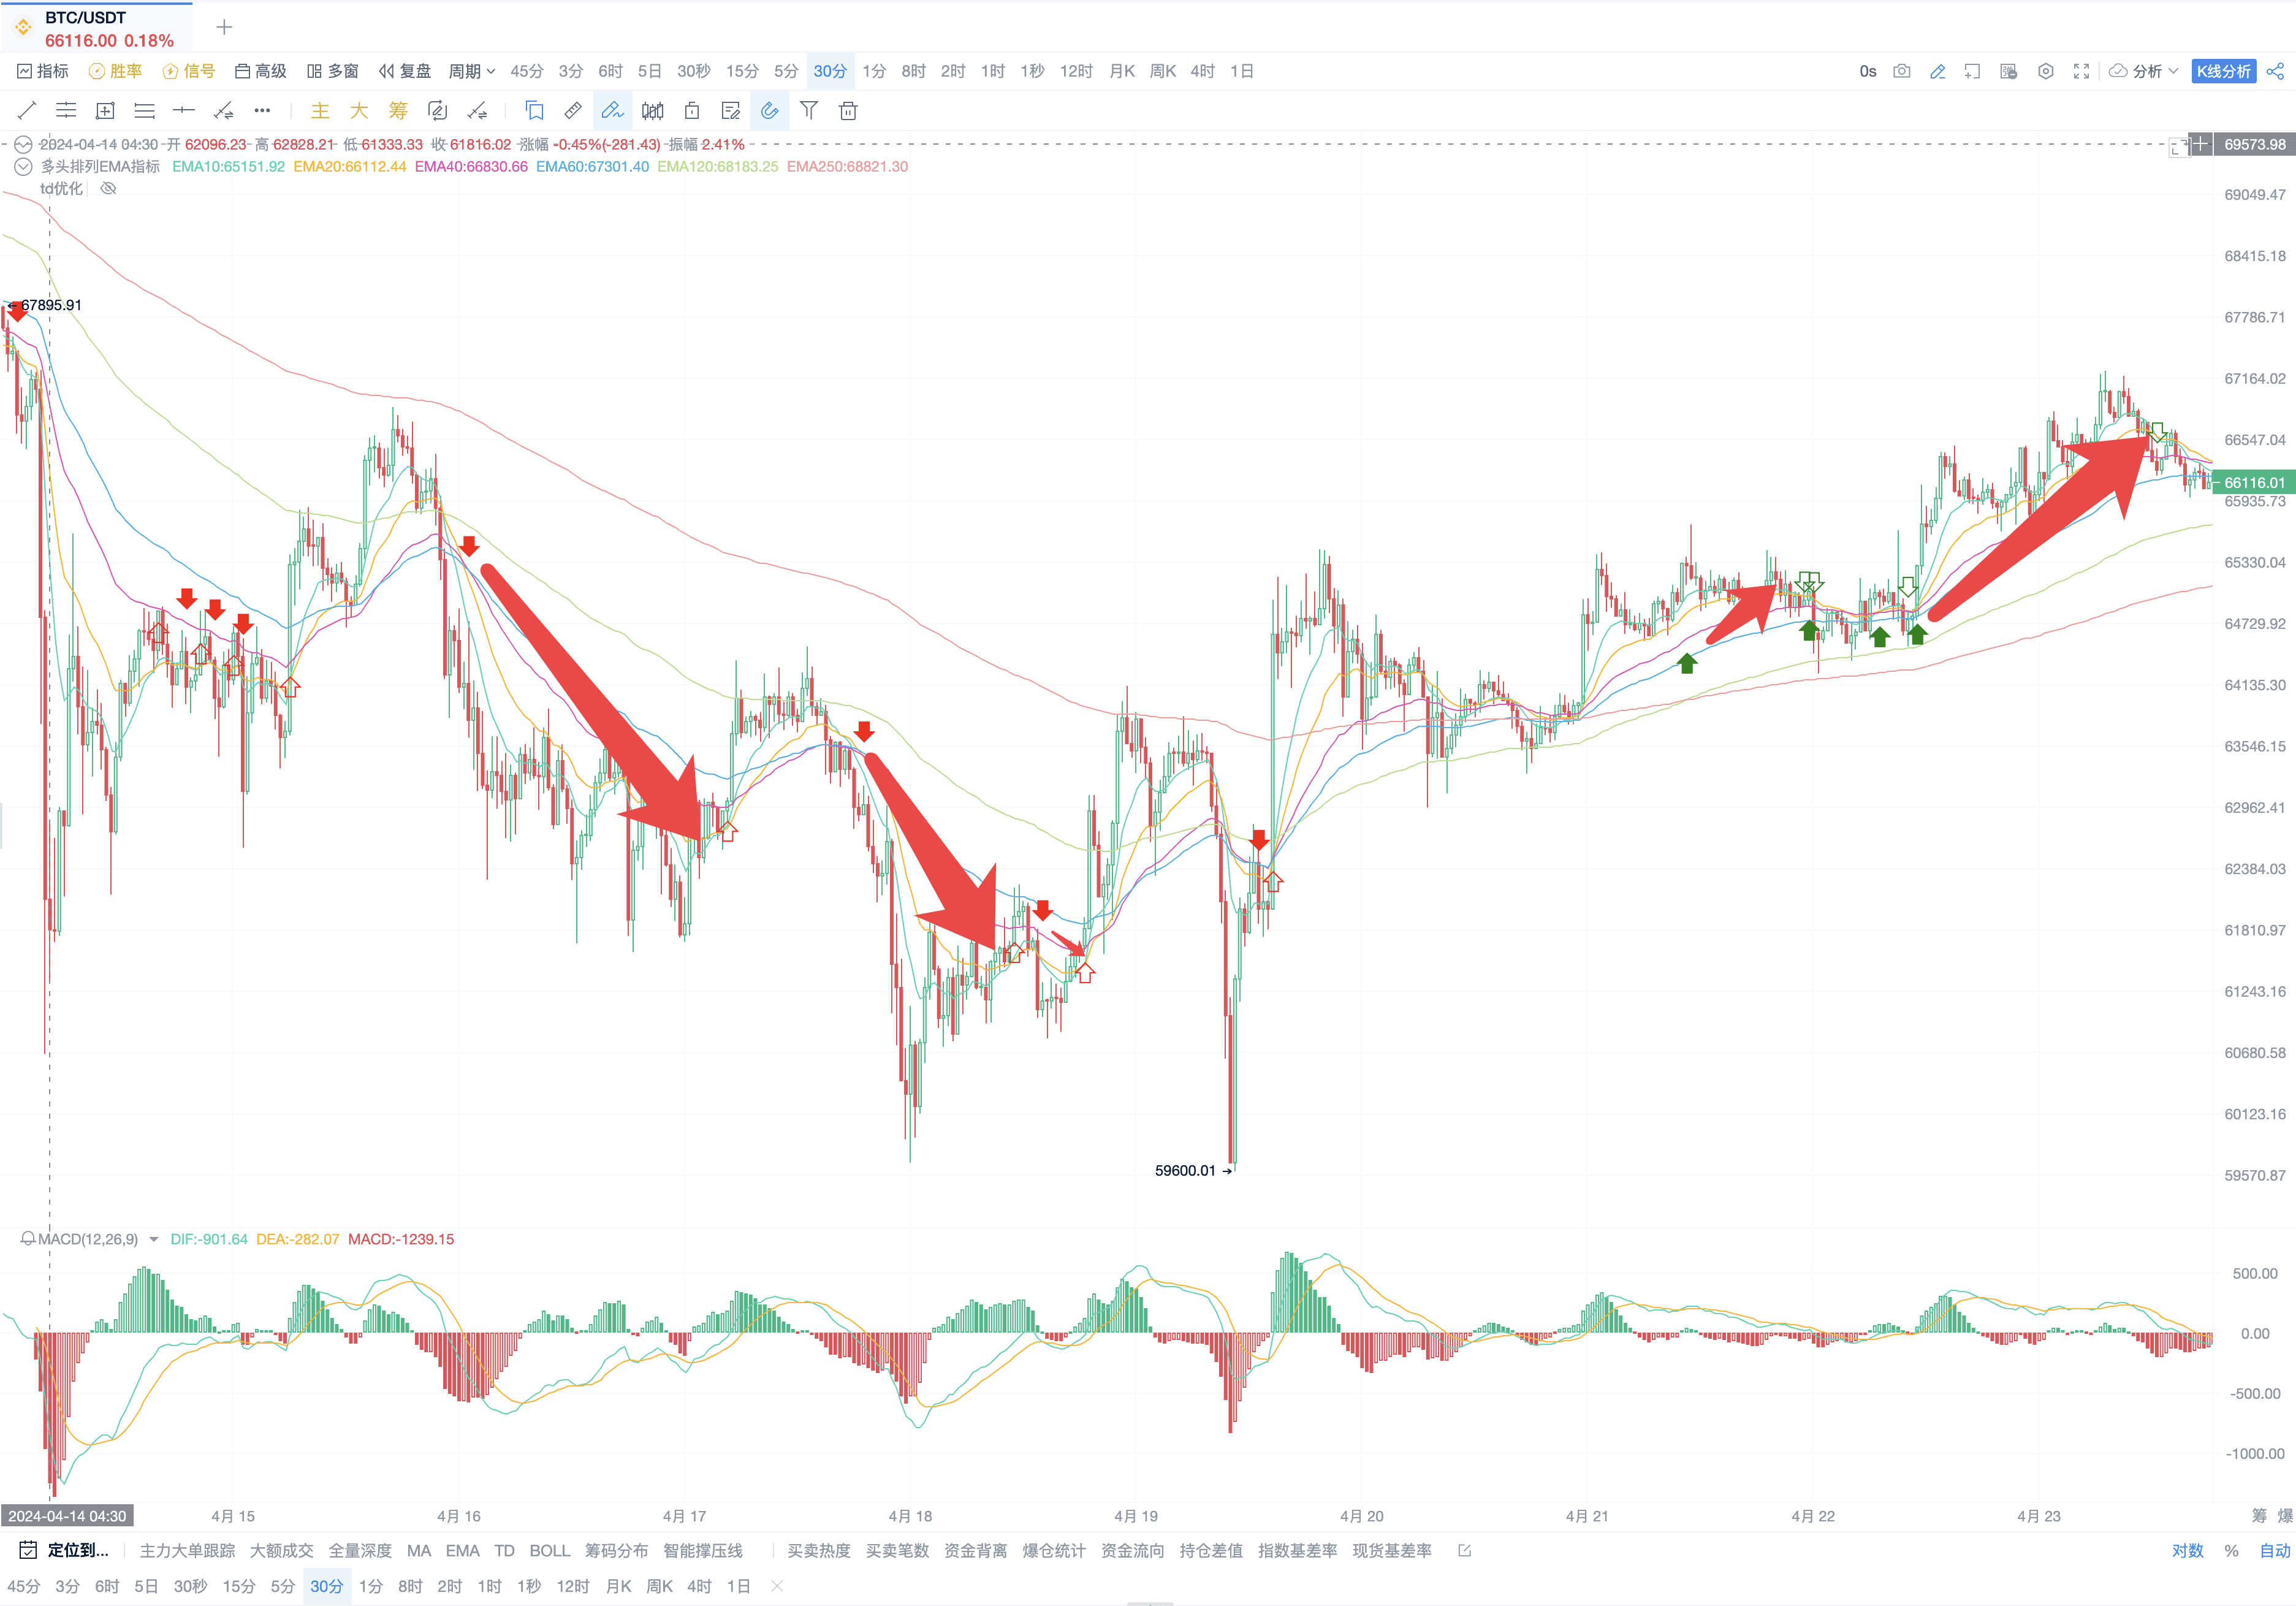
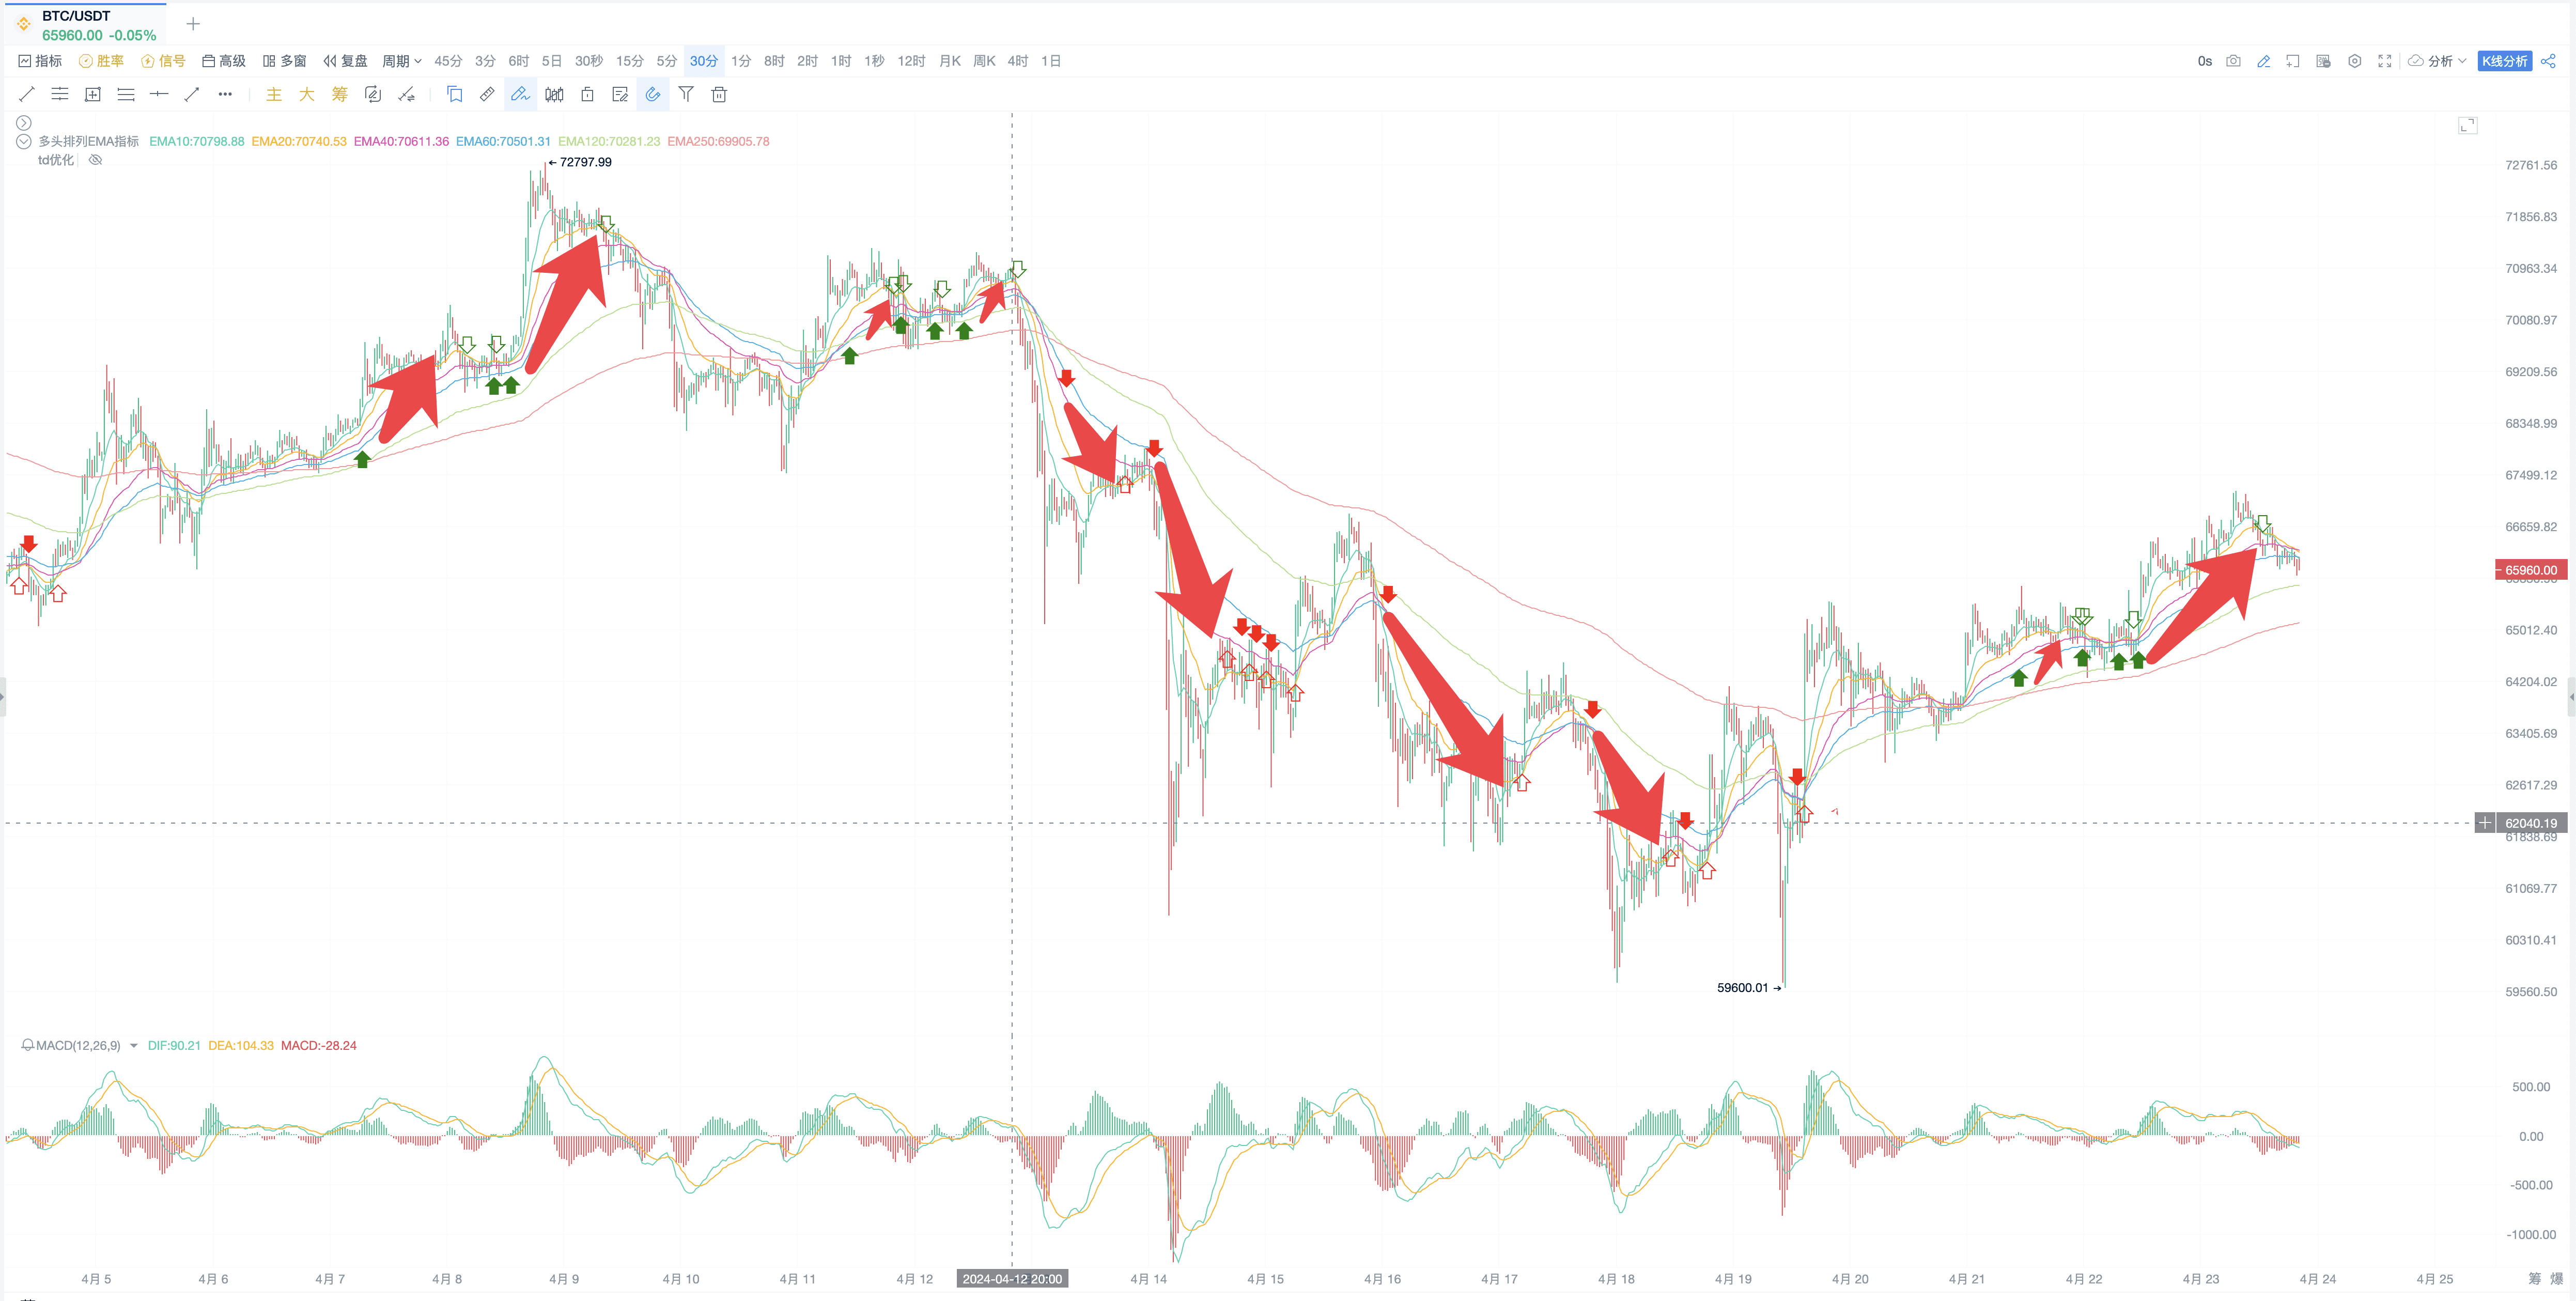
This strategy can perfectly capture the direction and trend of the currency.
2. Indicator Operation - Four Signal Groups
(1) When encountering a red downward arrow, open a short position.
(2) When encountering a red hollow upward arrow, close the short position.
(3) When encountering a green solid upward arrow, open a long position.
(4) When encountering a green hollow downward arrow, close the long position.
For spot trading, if you encounter a red arrow, you can ignore it.
By extending the time frame, it can be observed that the signal frequency is very high.
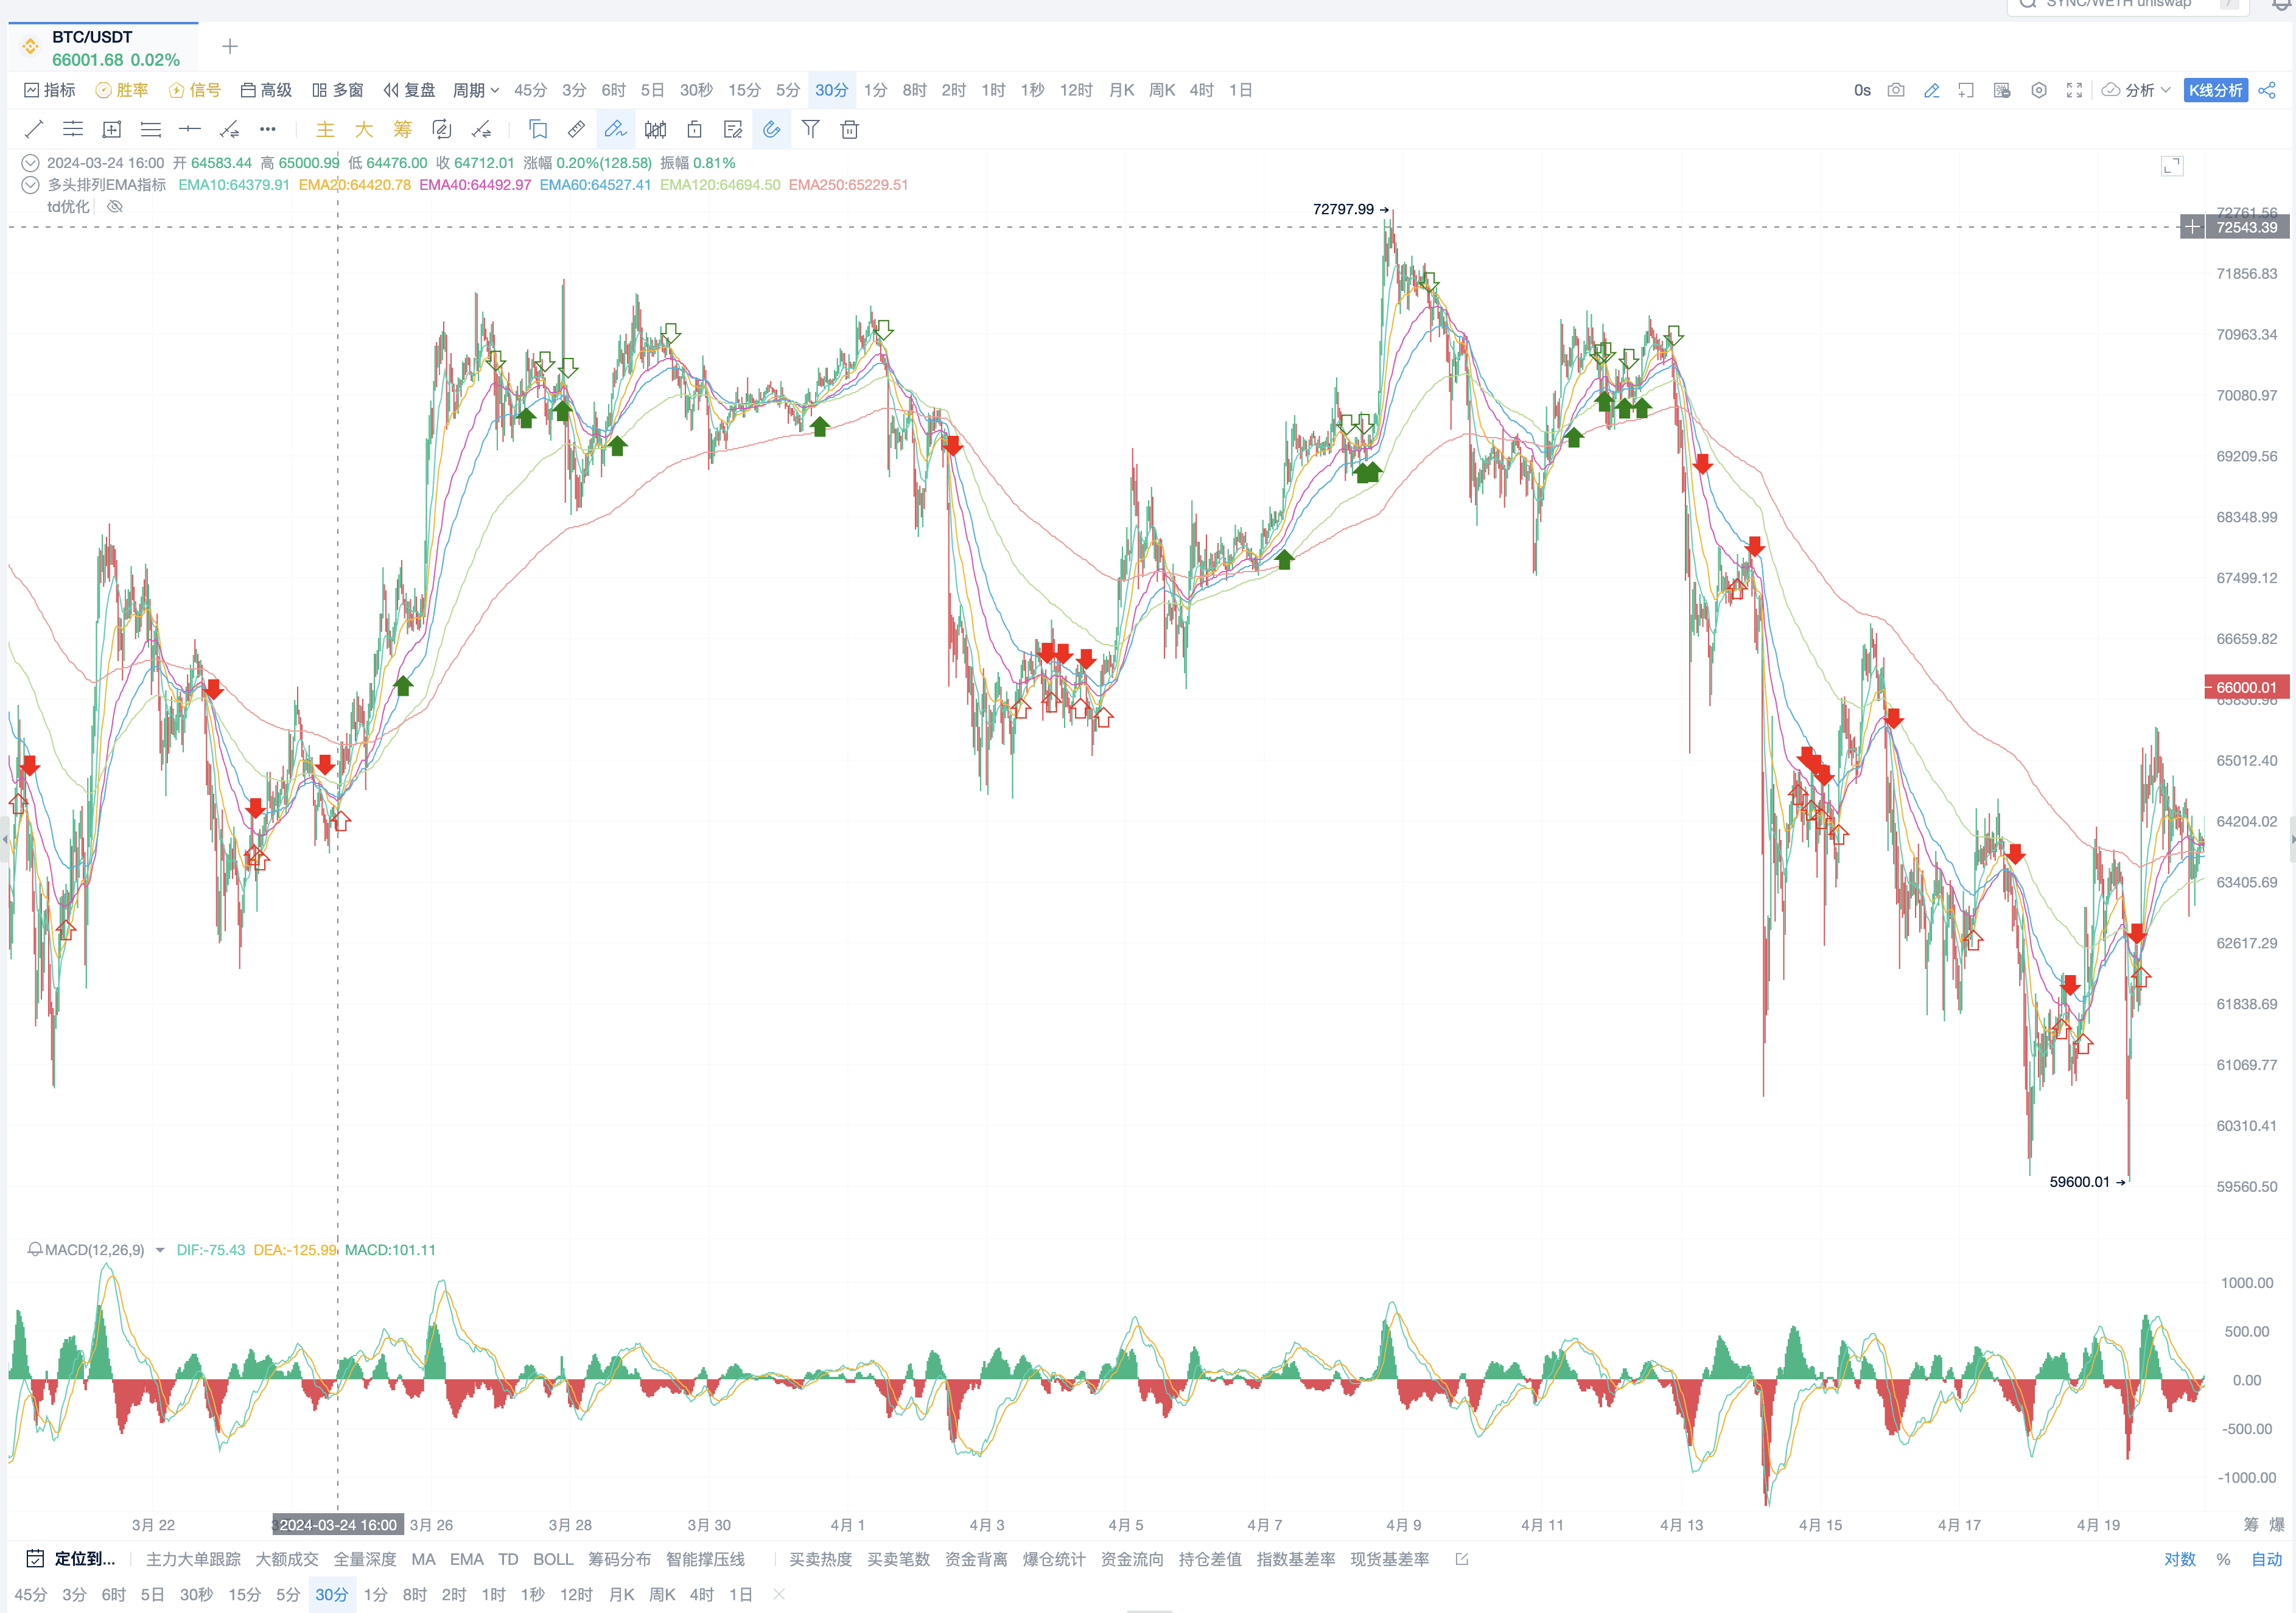
It can perfectly capture the trend market, and even in a volatile market, it can completely cover the transaction fees.
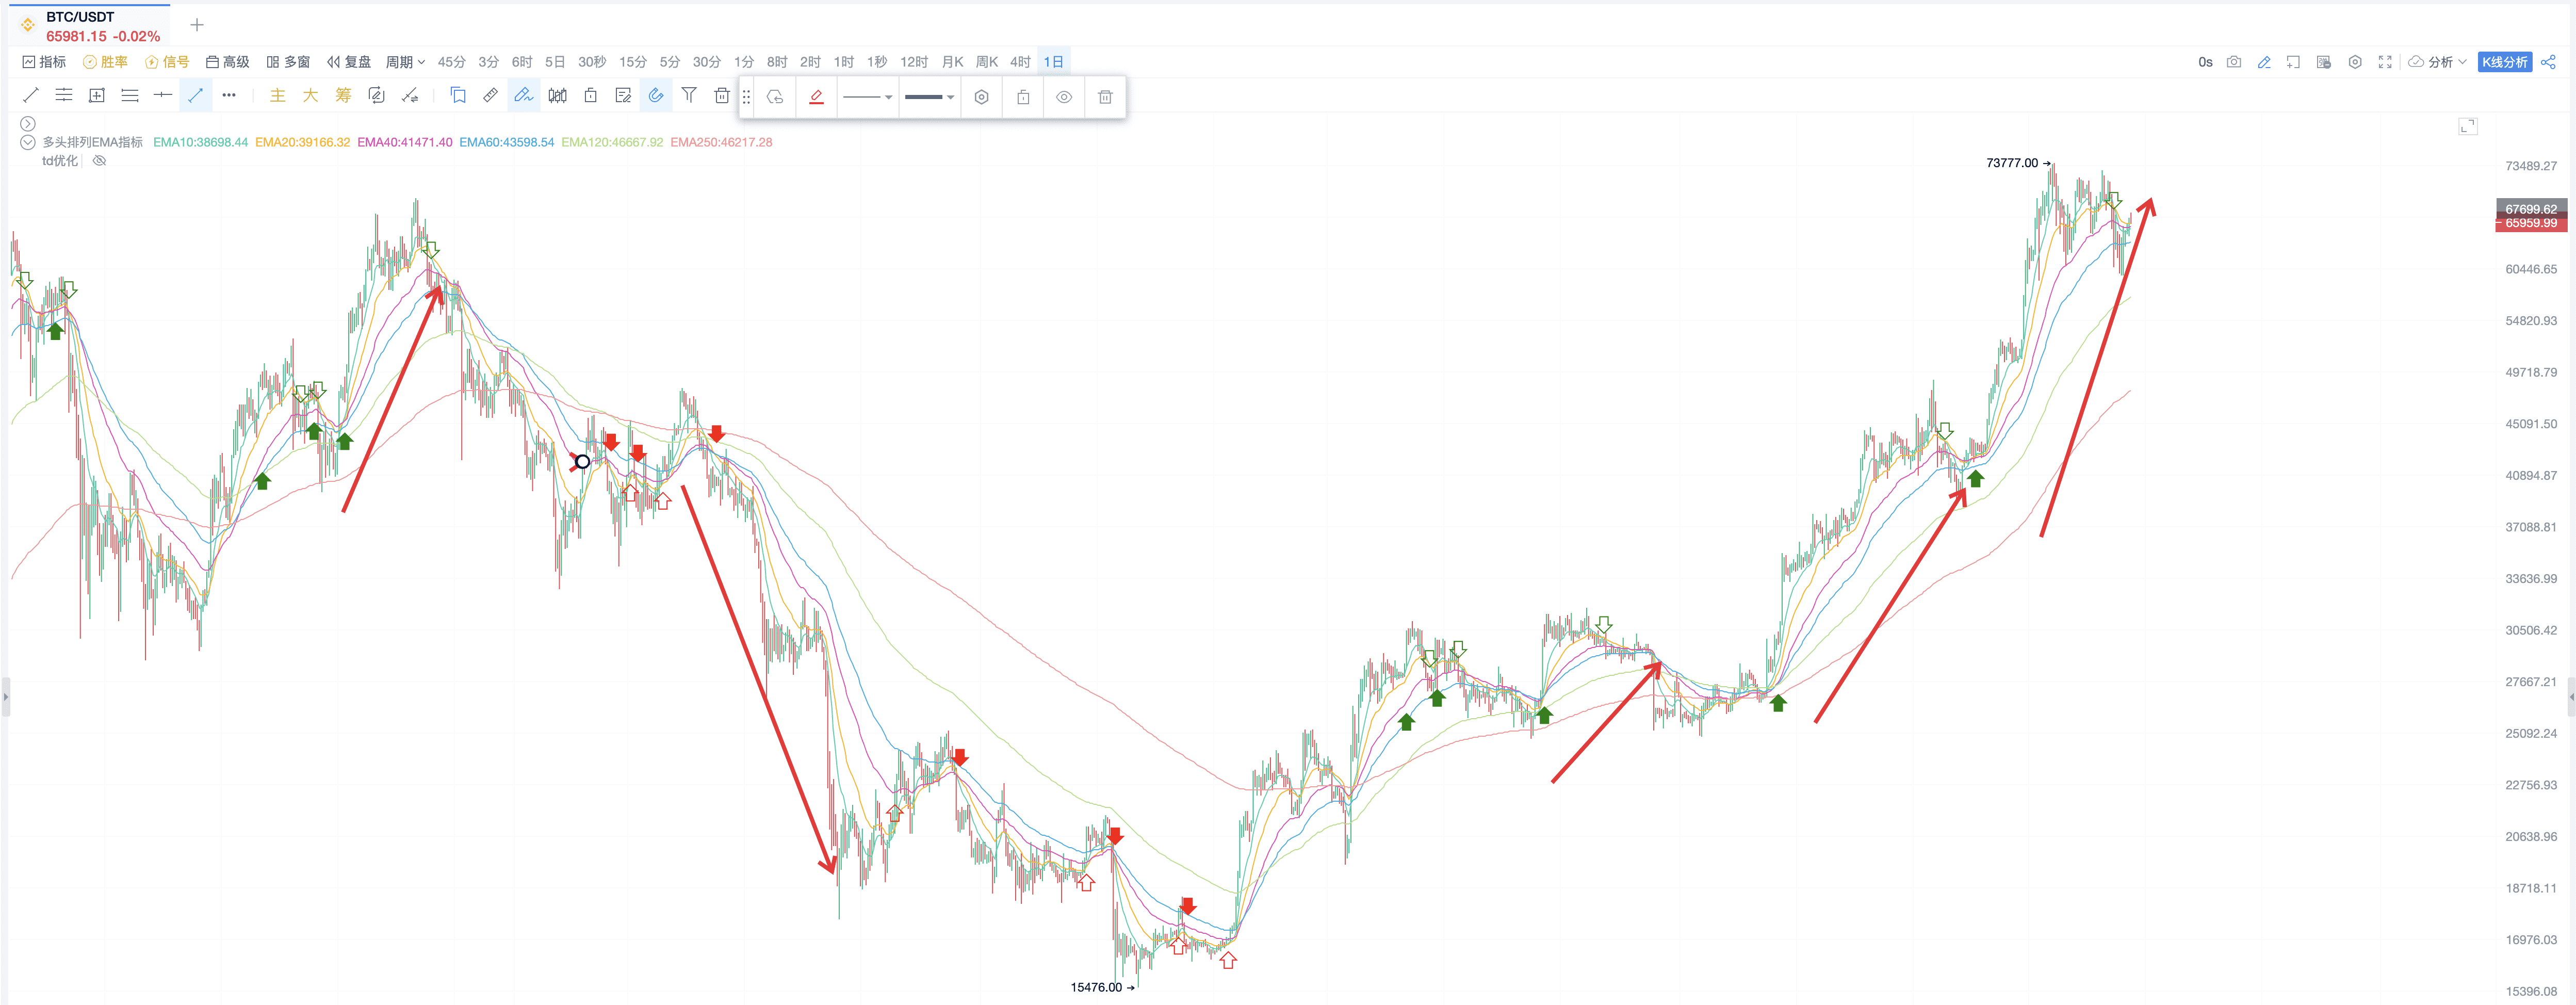
When the time frame is extended to the daily chart, it can be seen that these major trends are also perfectly captured, easily achieving profitability.
For individuals interested in high-frequency signals, after conducting extensive backtesting, the performance of BTC is very good in the 30-minute time frame.
II. Indicator Construction Method
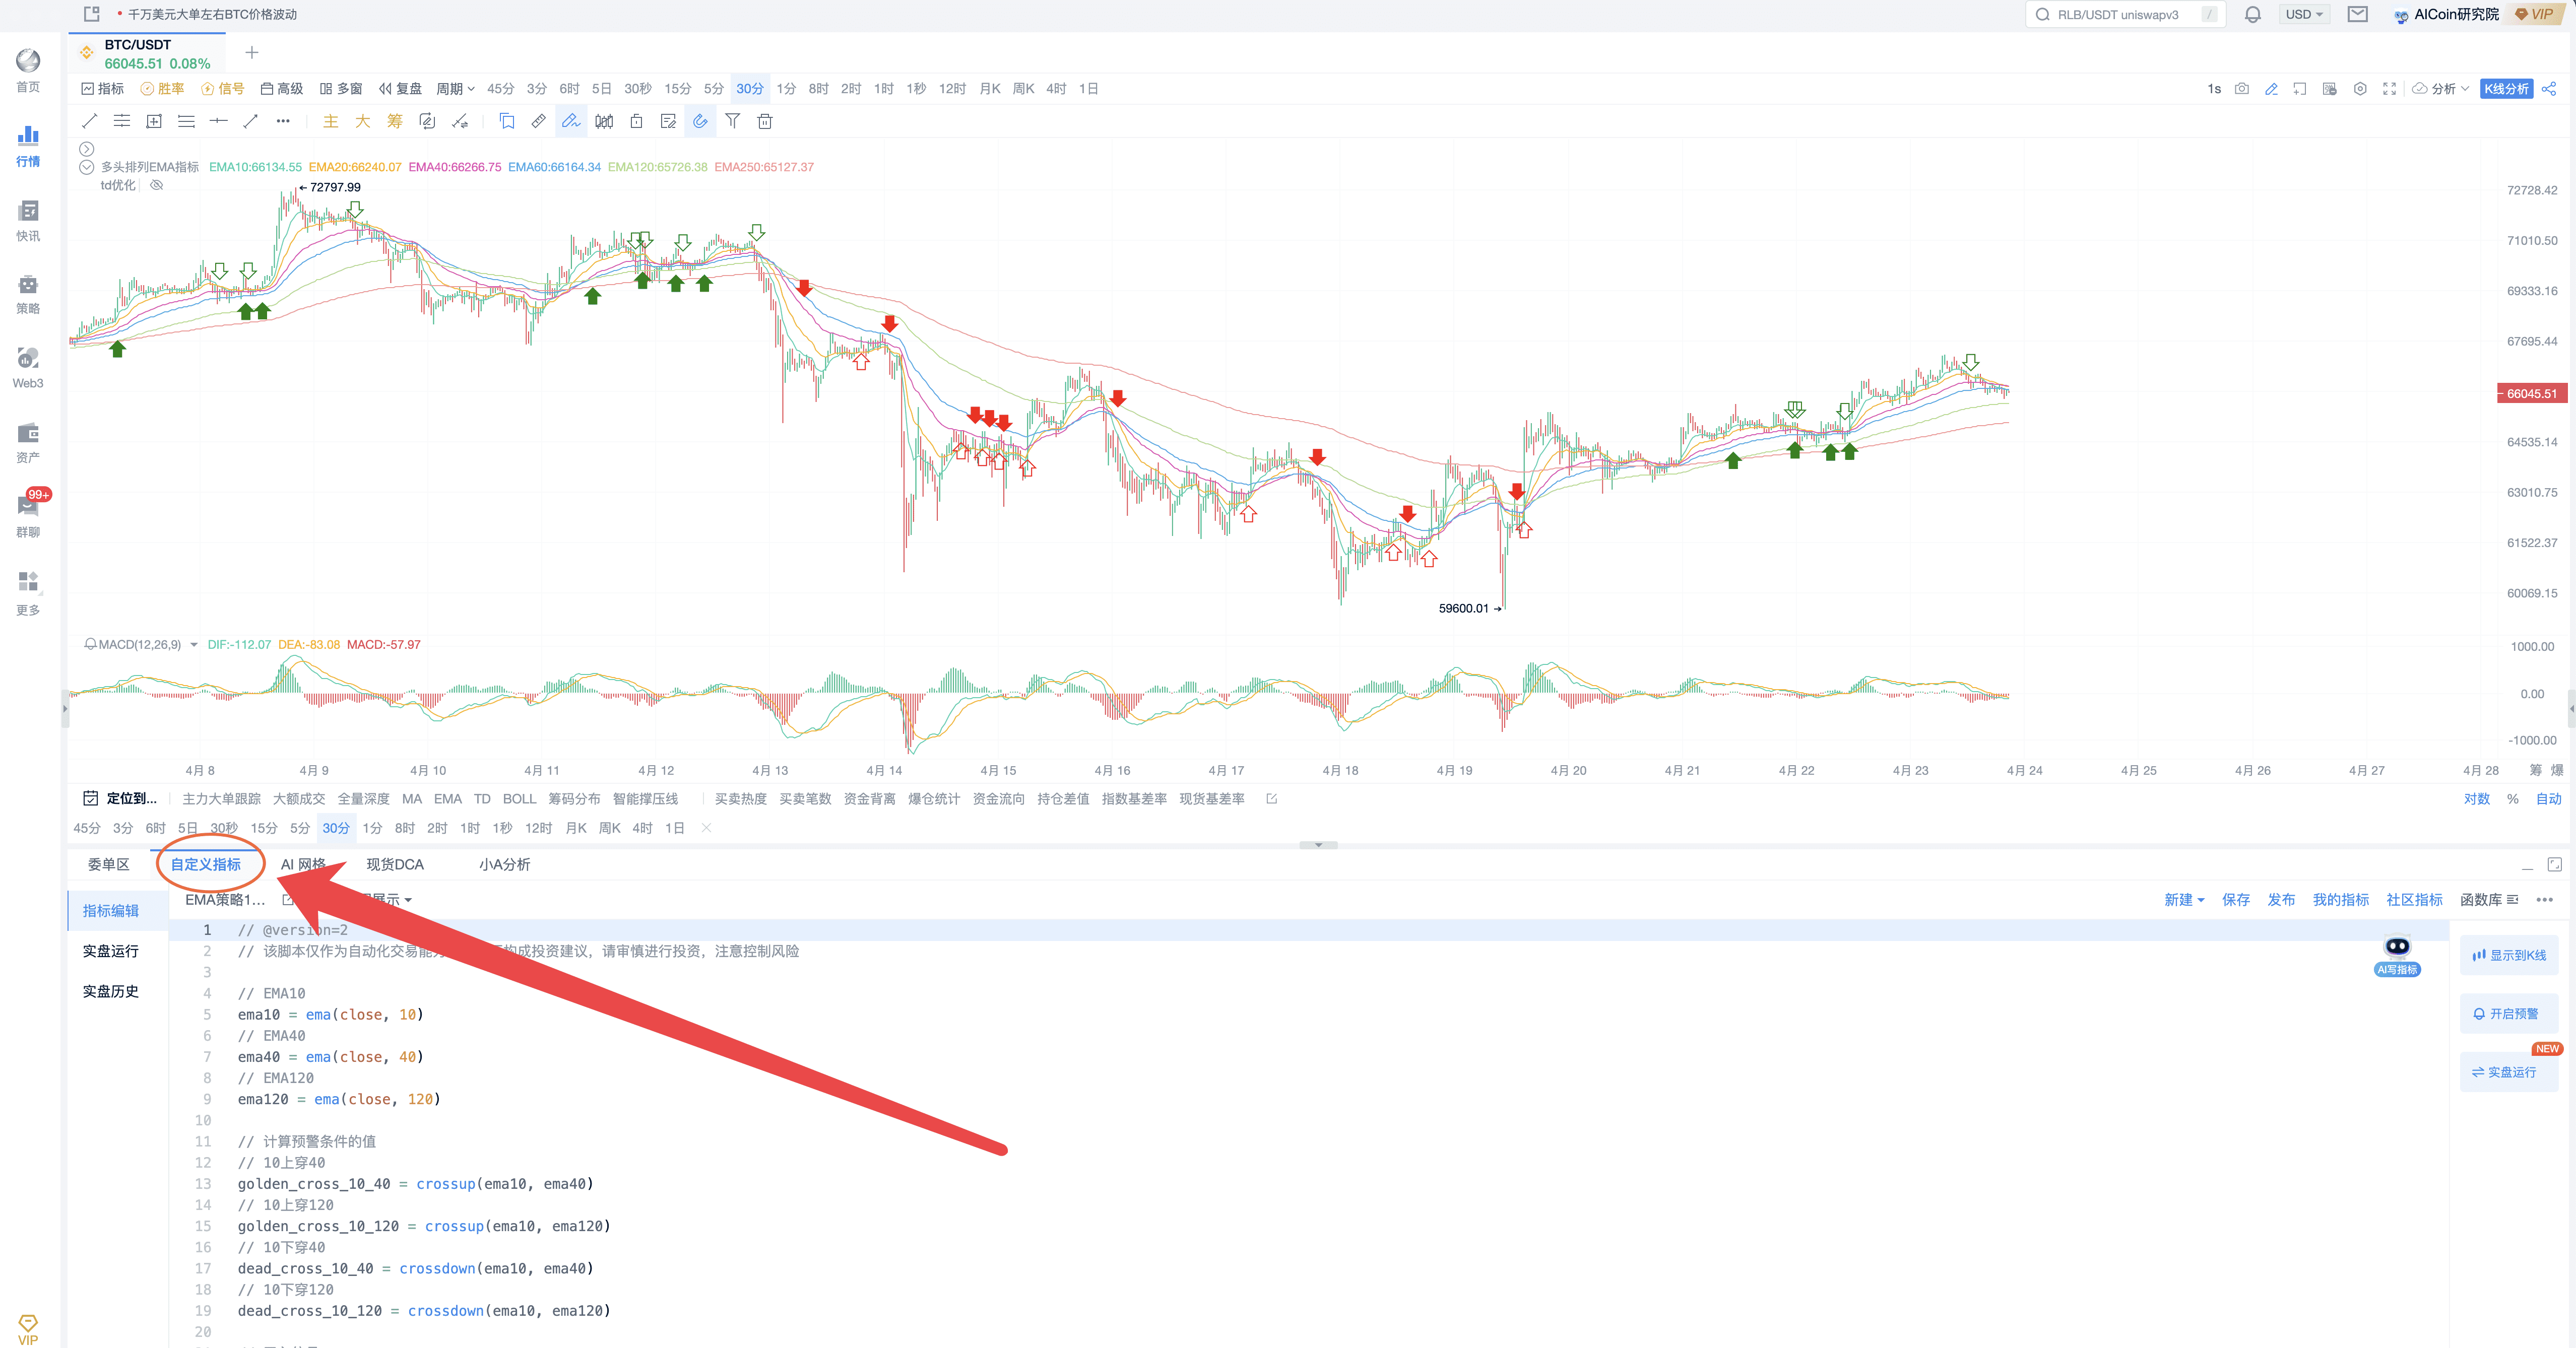
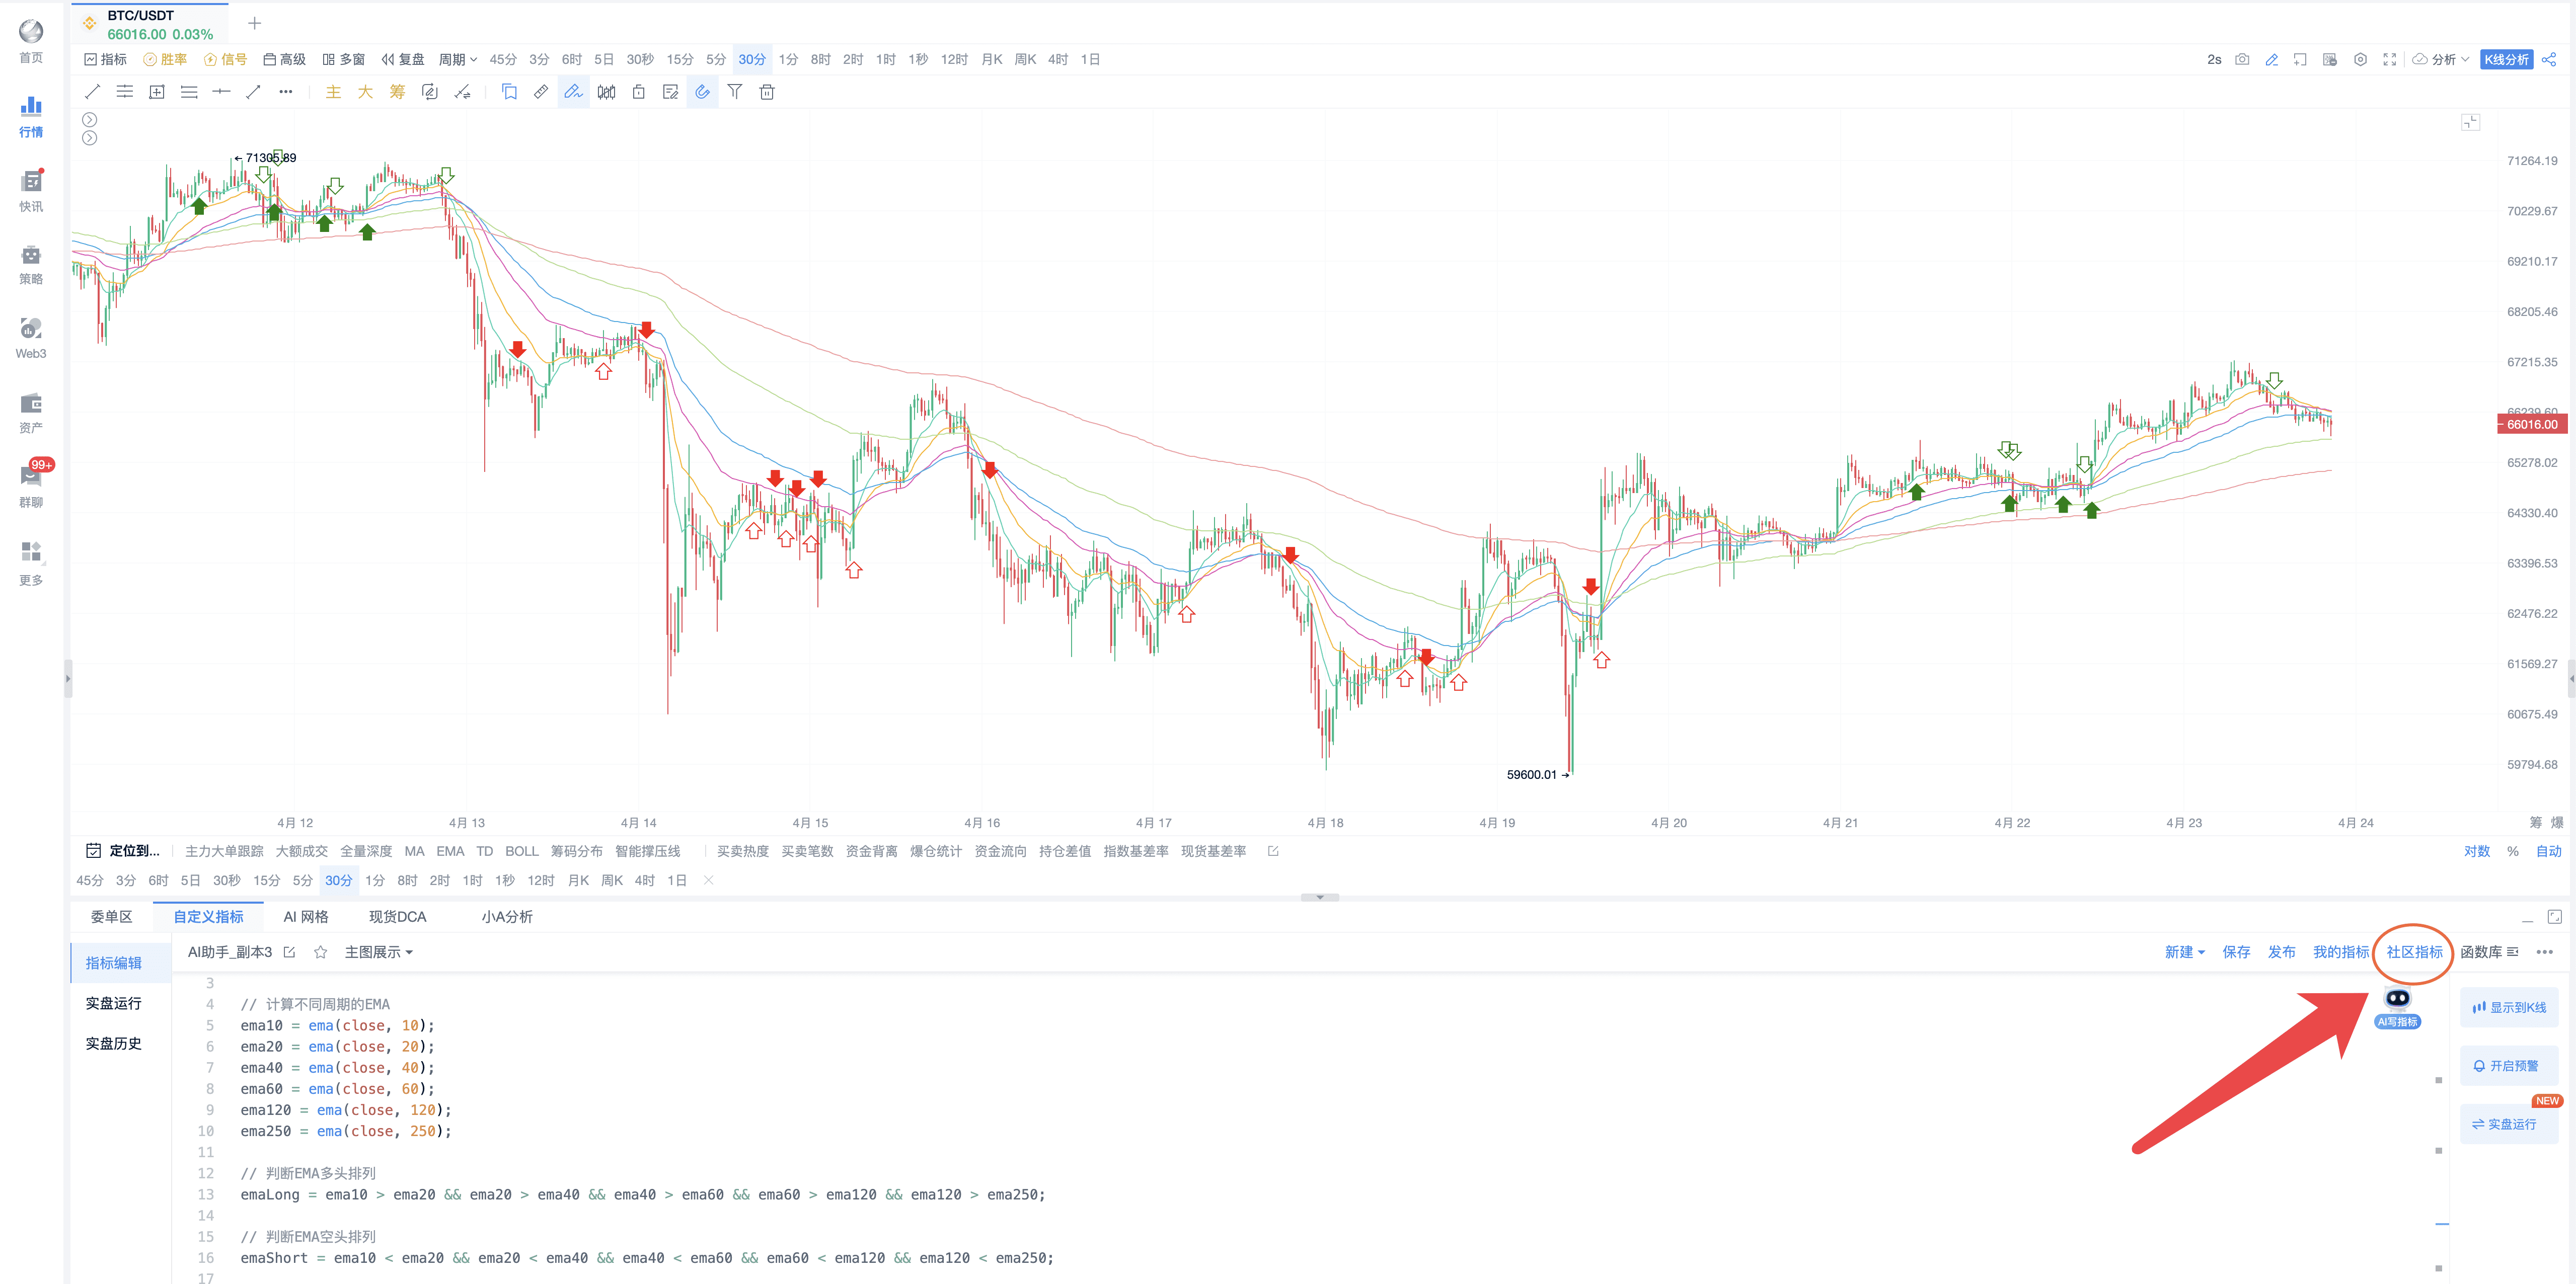
1. Open the Indicator Editing at the Bottom of the Market
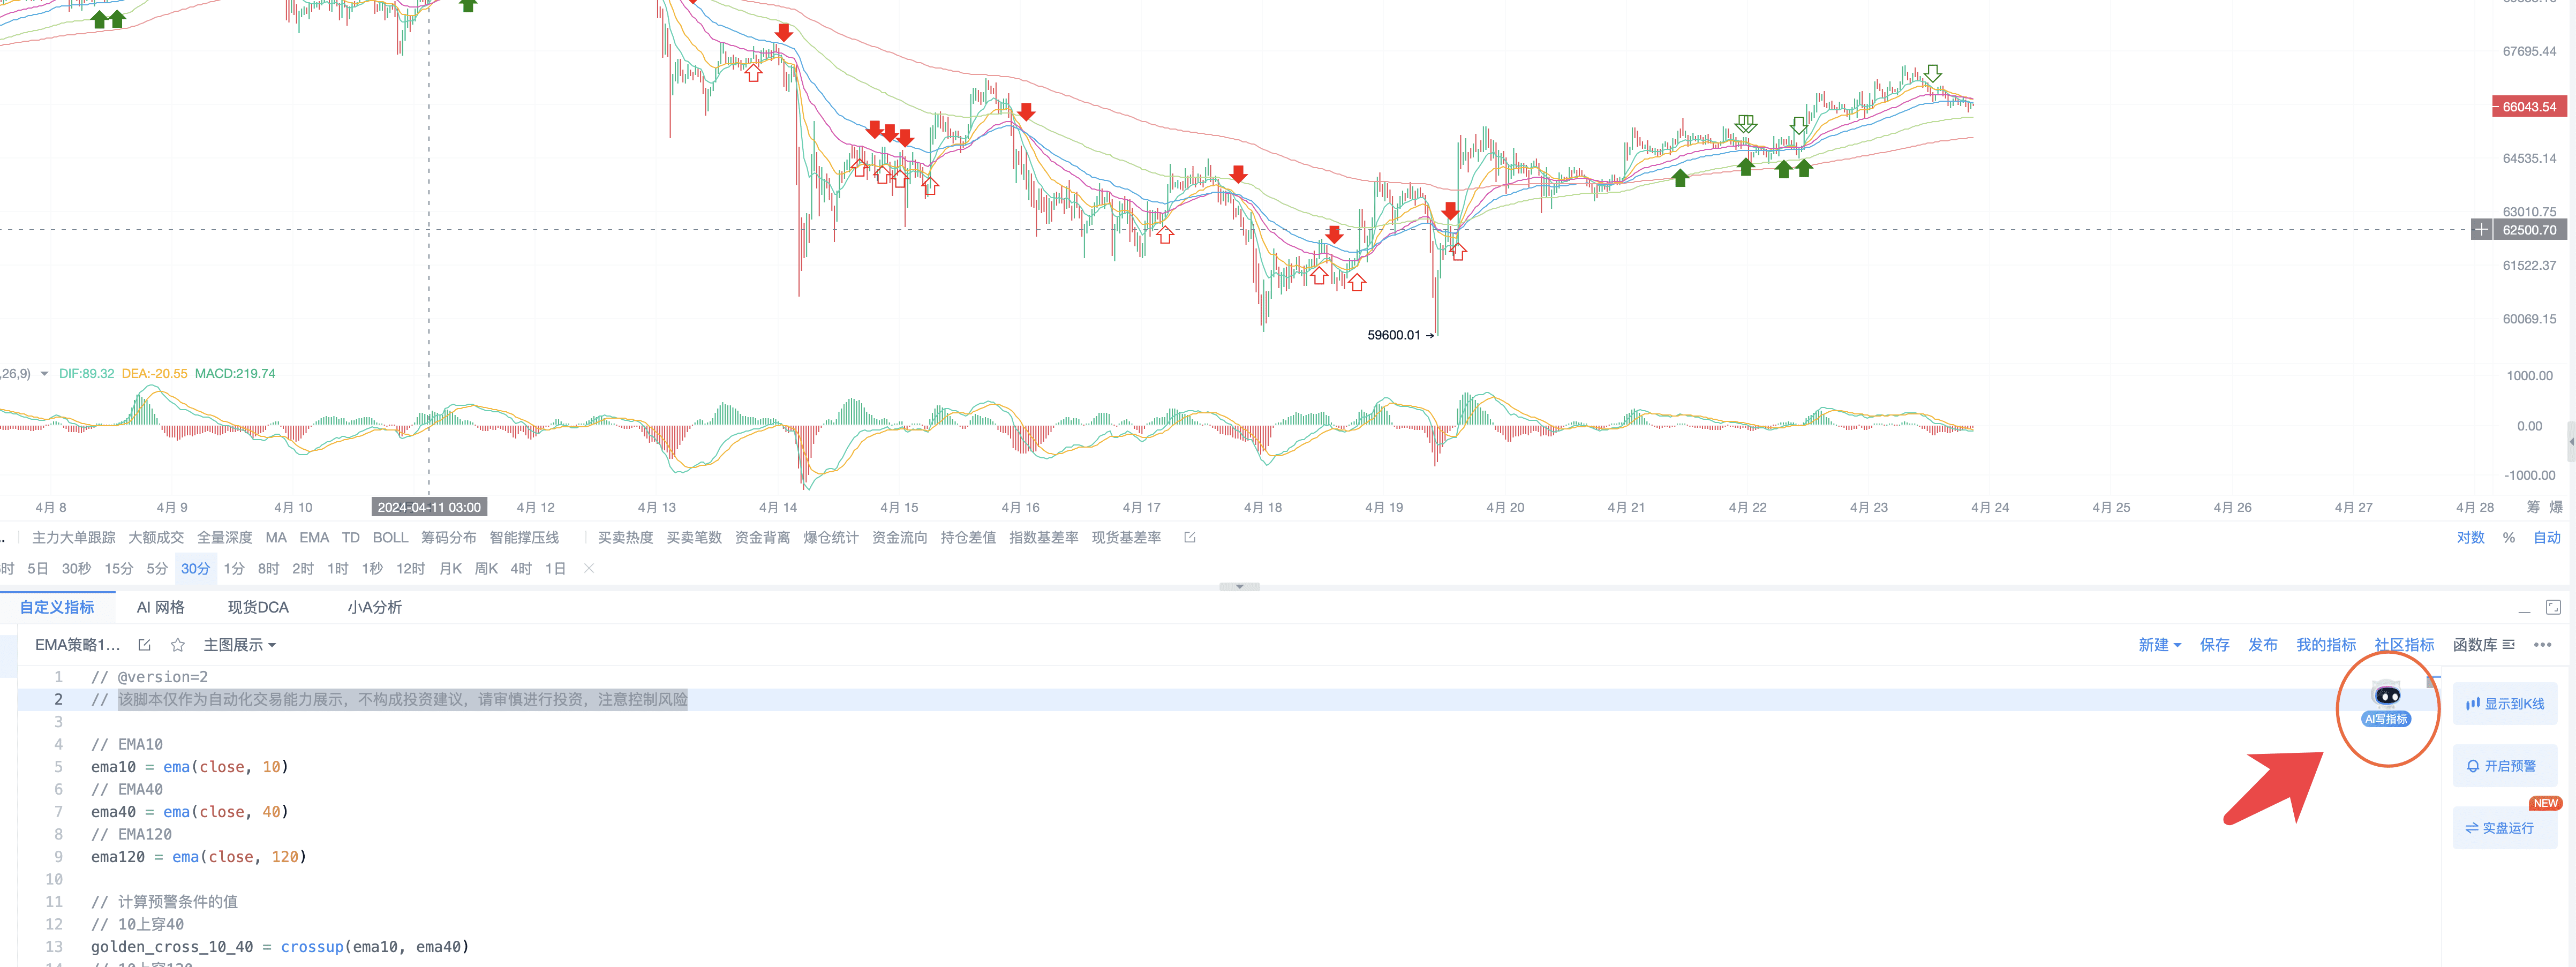
2. Click on AI to Write Indicators
3. Input commands to AI to implement this set of custom indicators
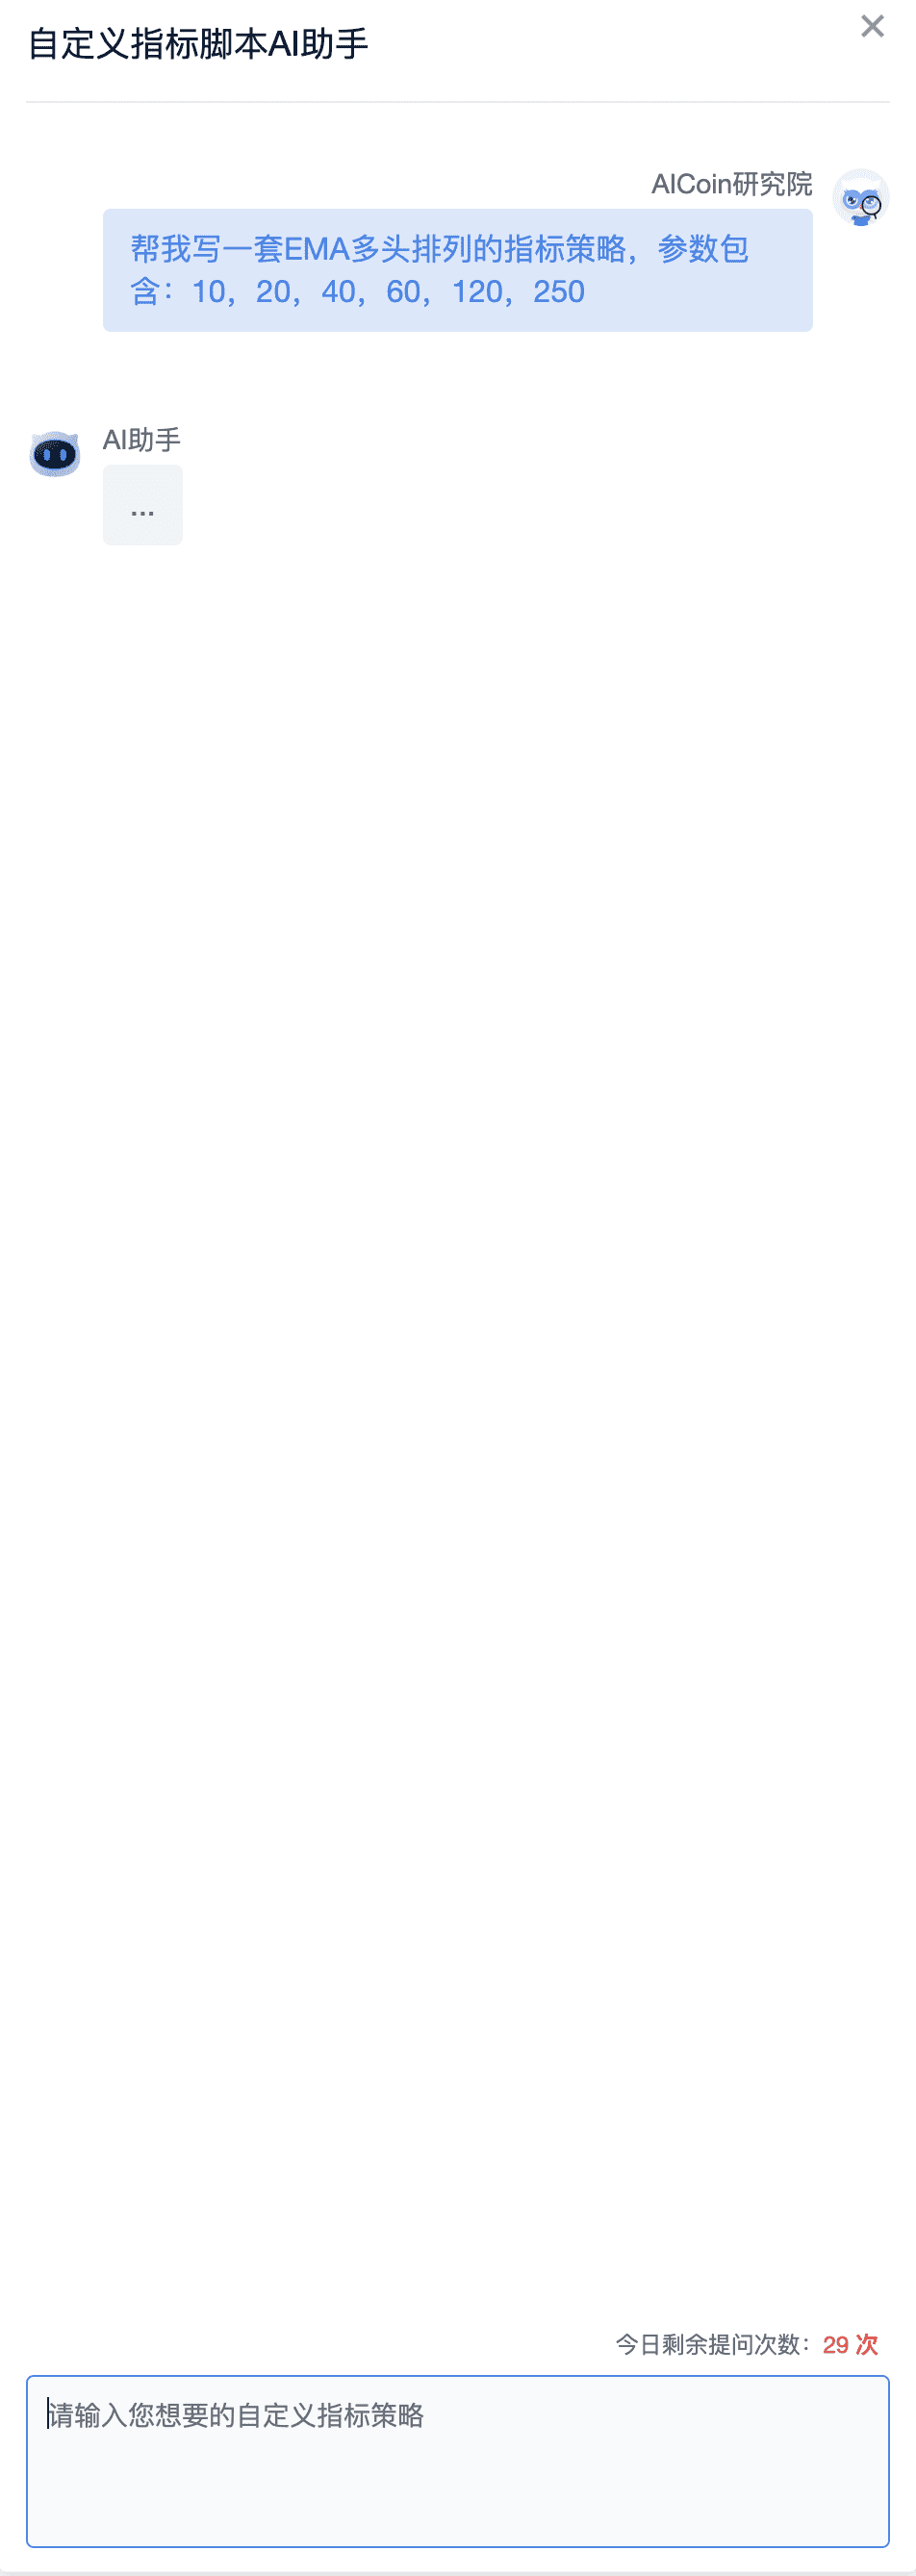
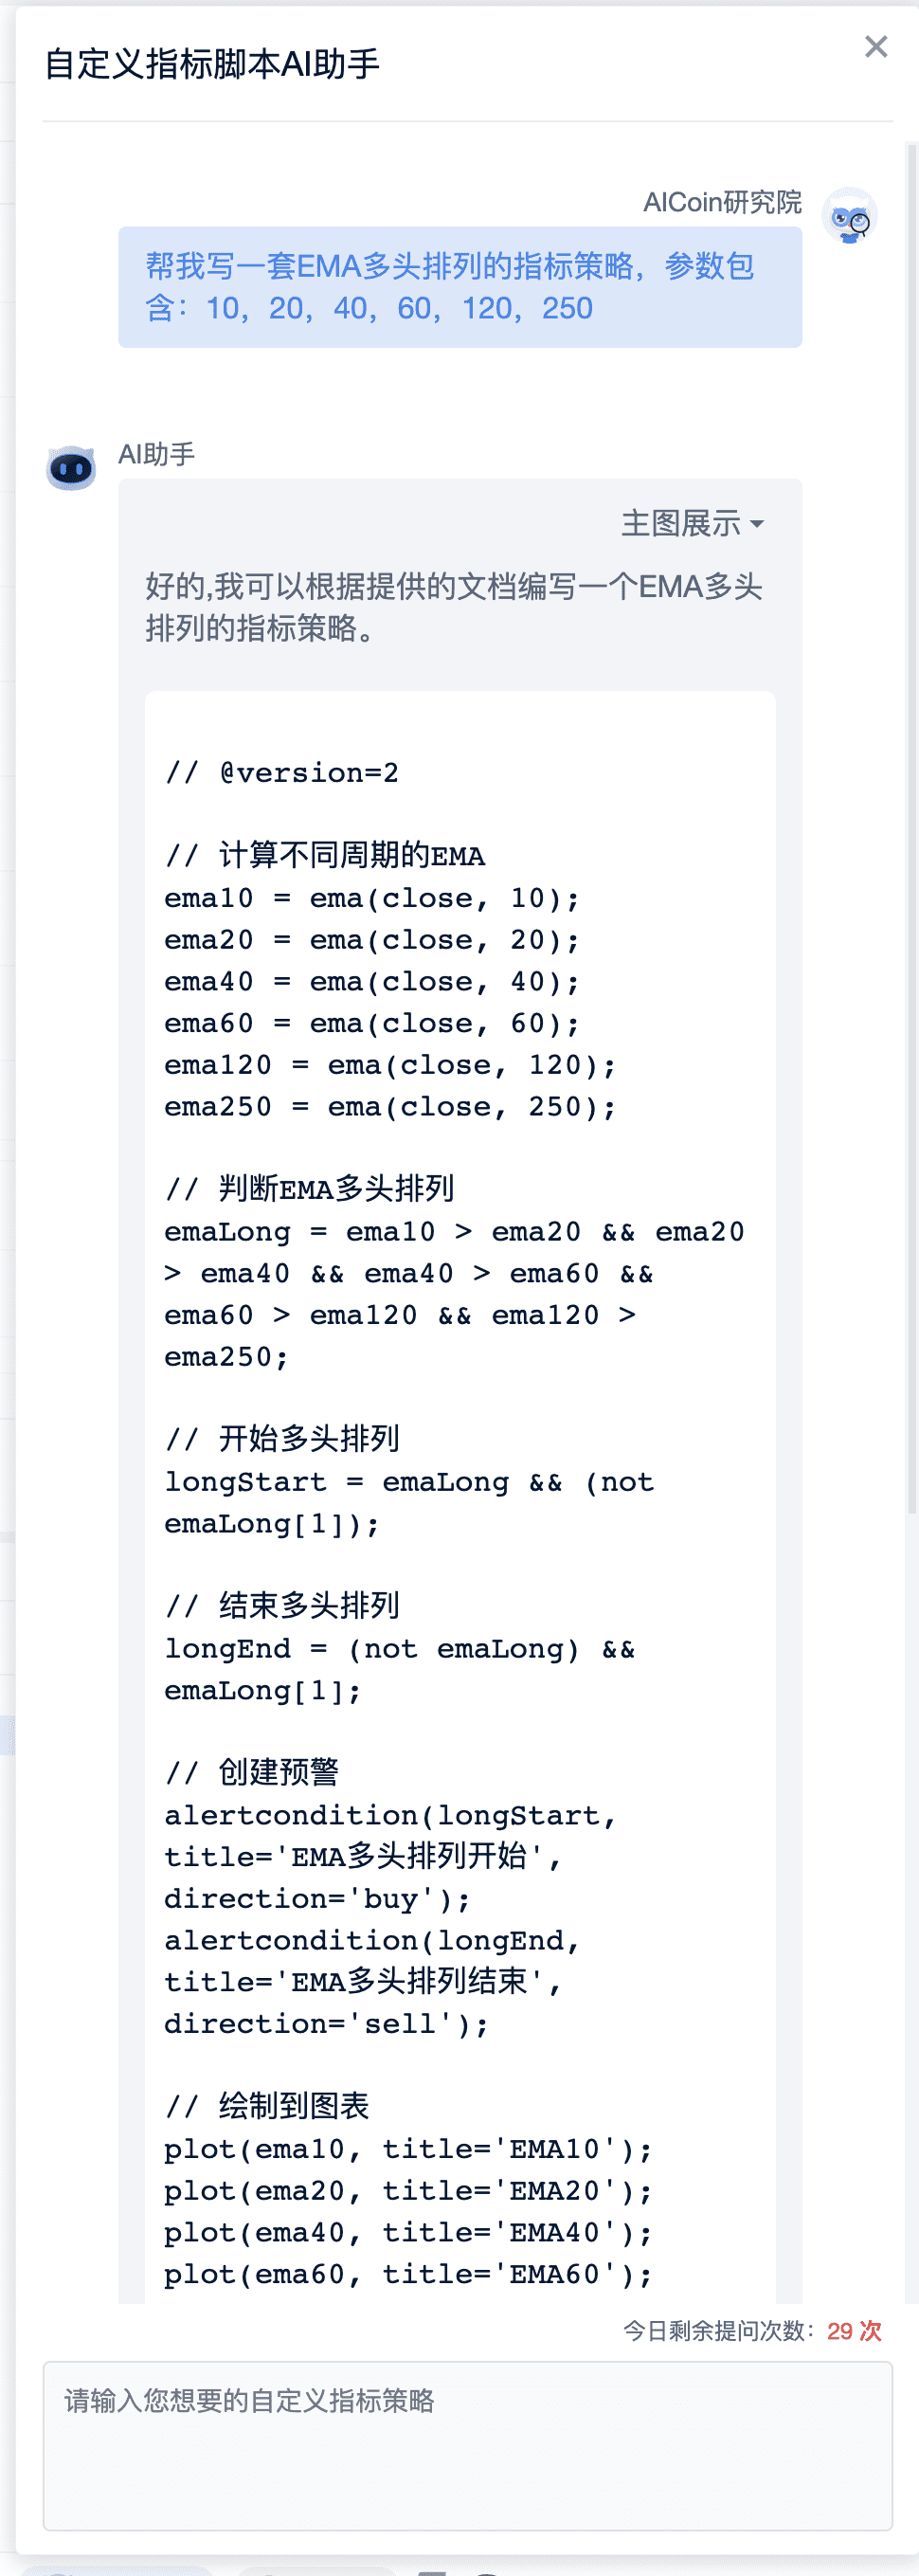
This is a classic and practical strategy, with classic parameters: 10, 20, 40, 60, 120, 250.
4. Insert into the Candlestick Chart
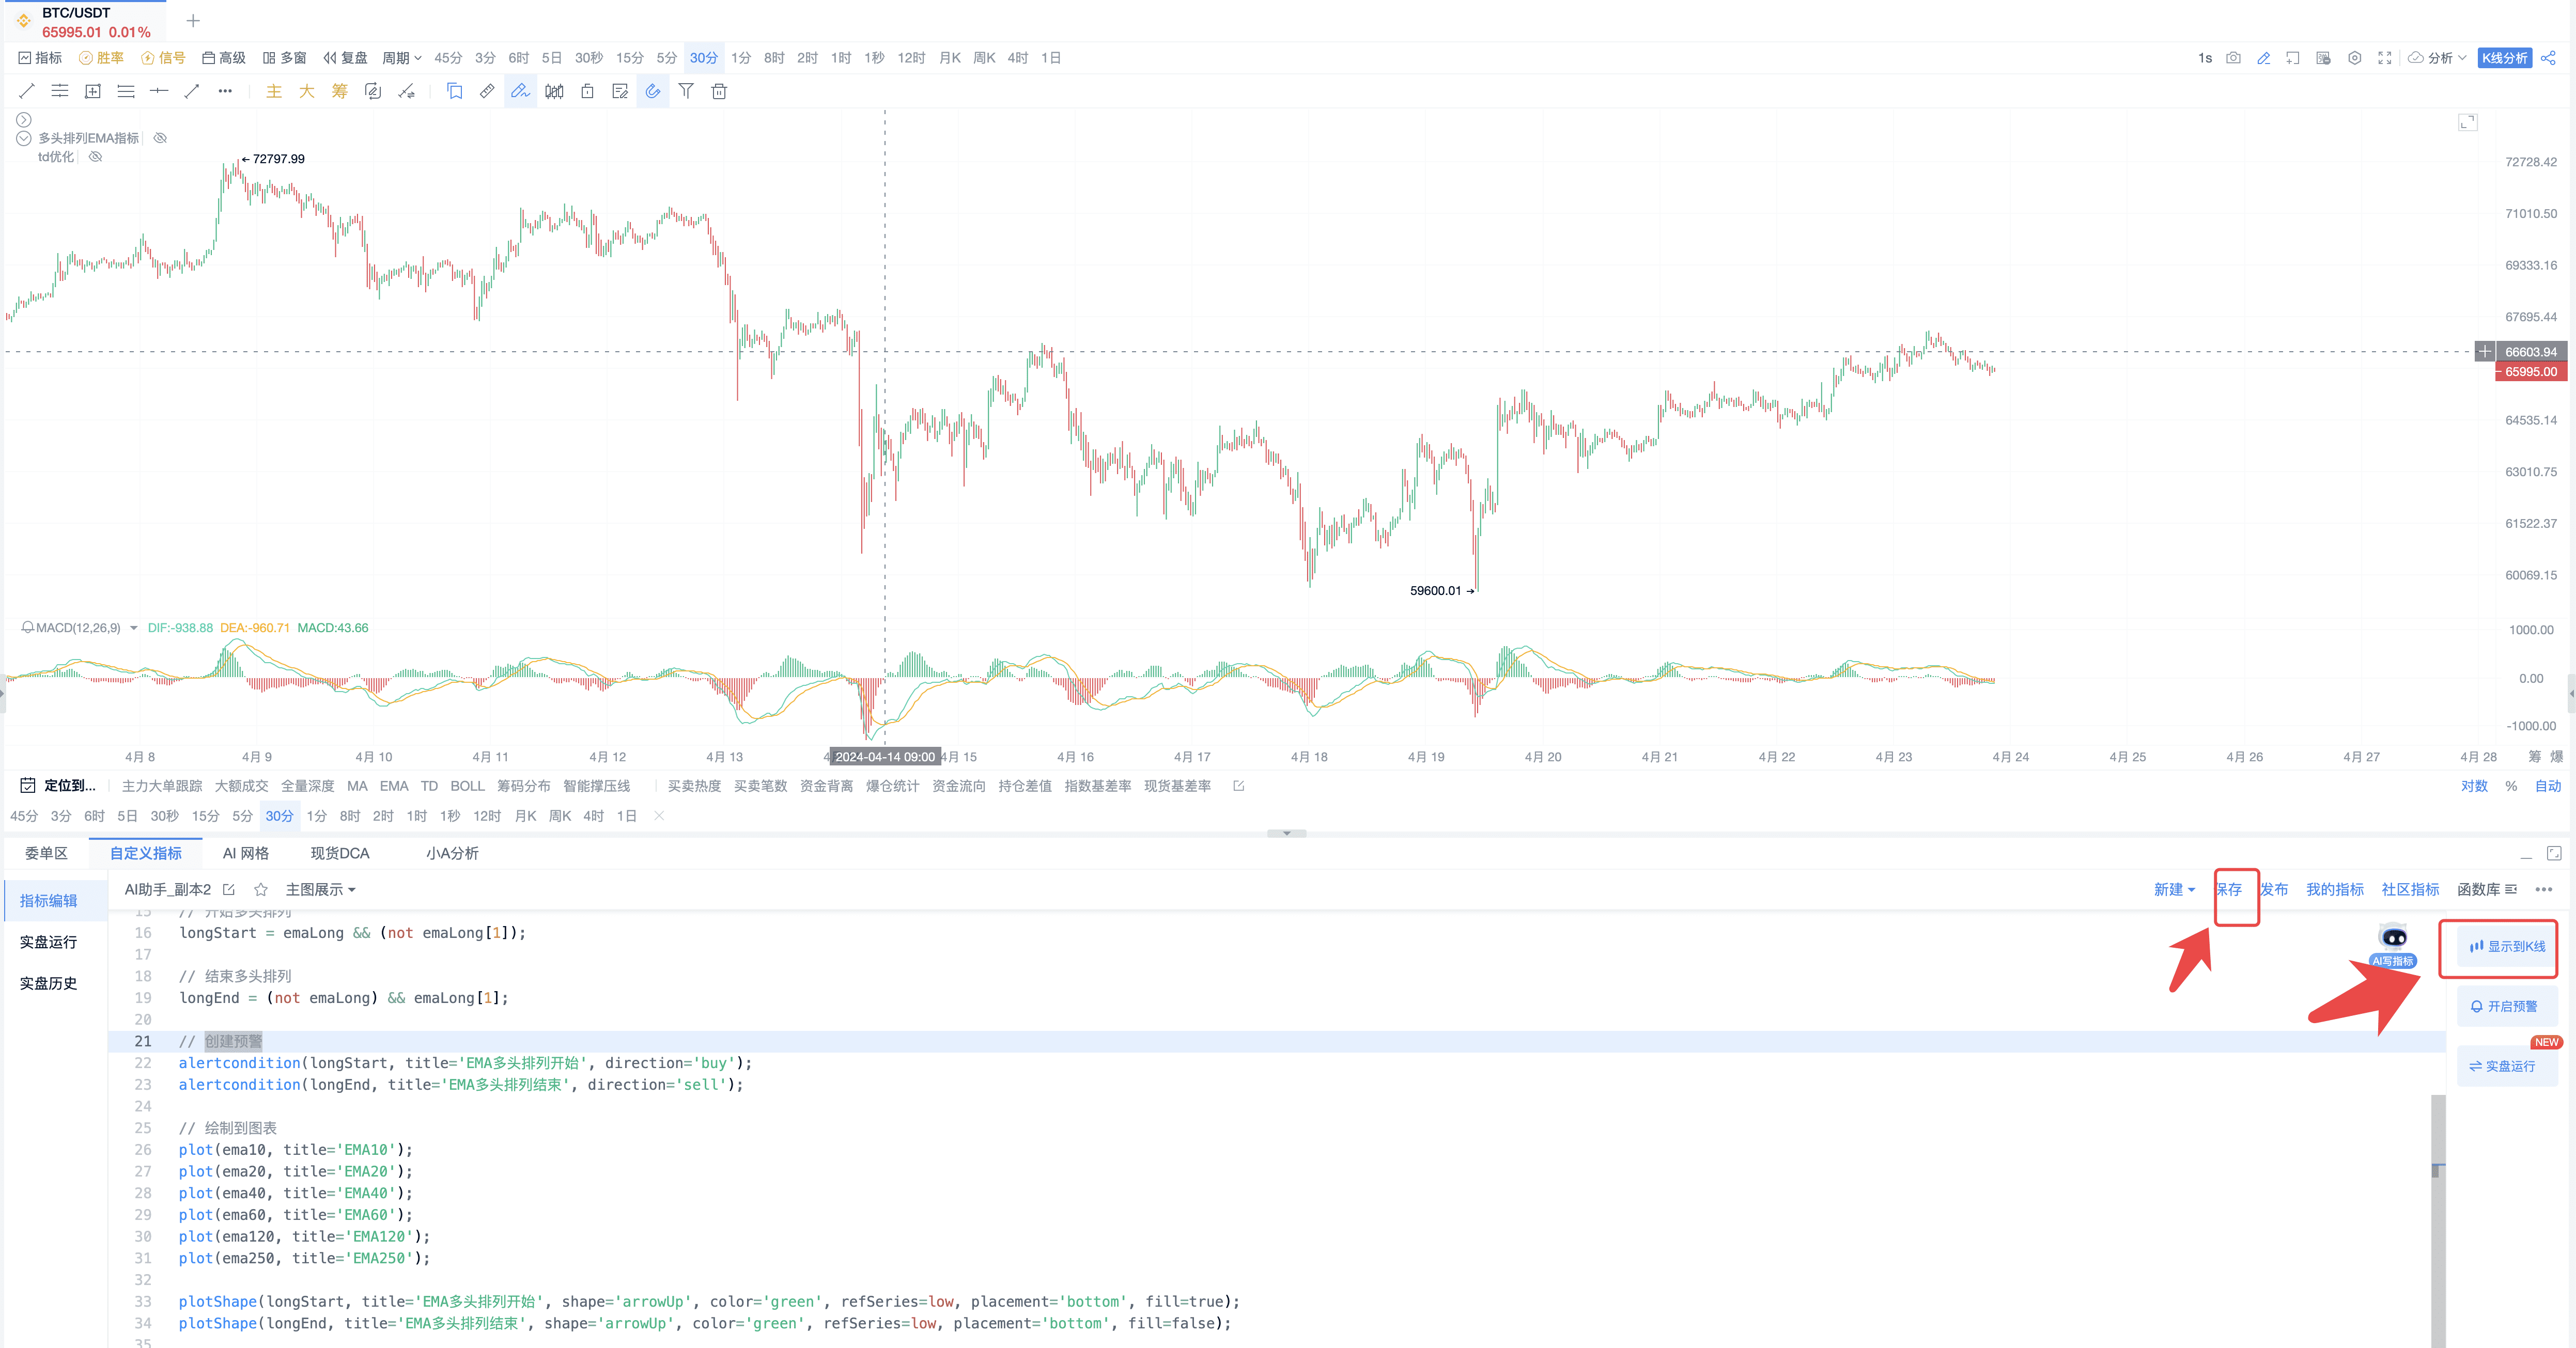
5. Fine-tune Details
The previous command was for the long position arrangement, now continue to add the short position arrangement.
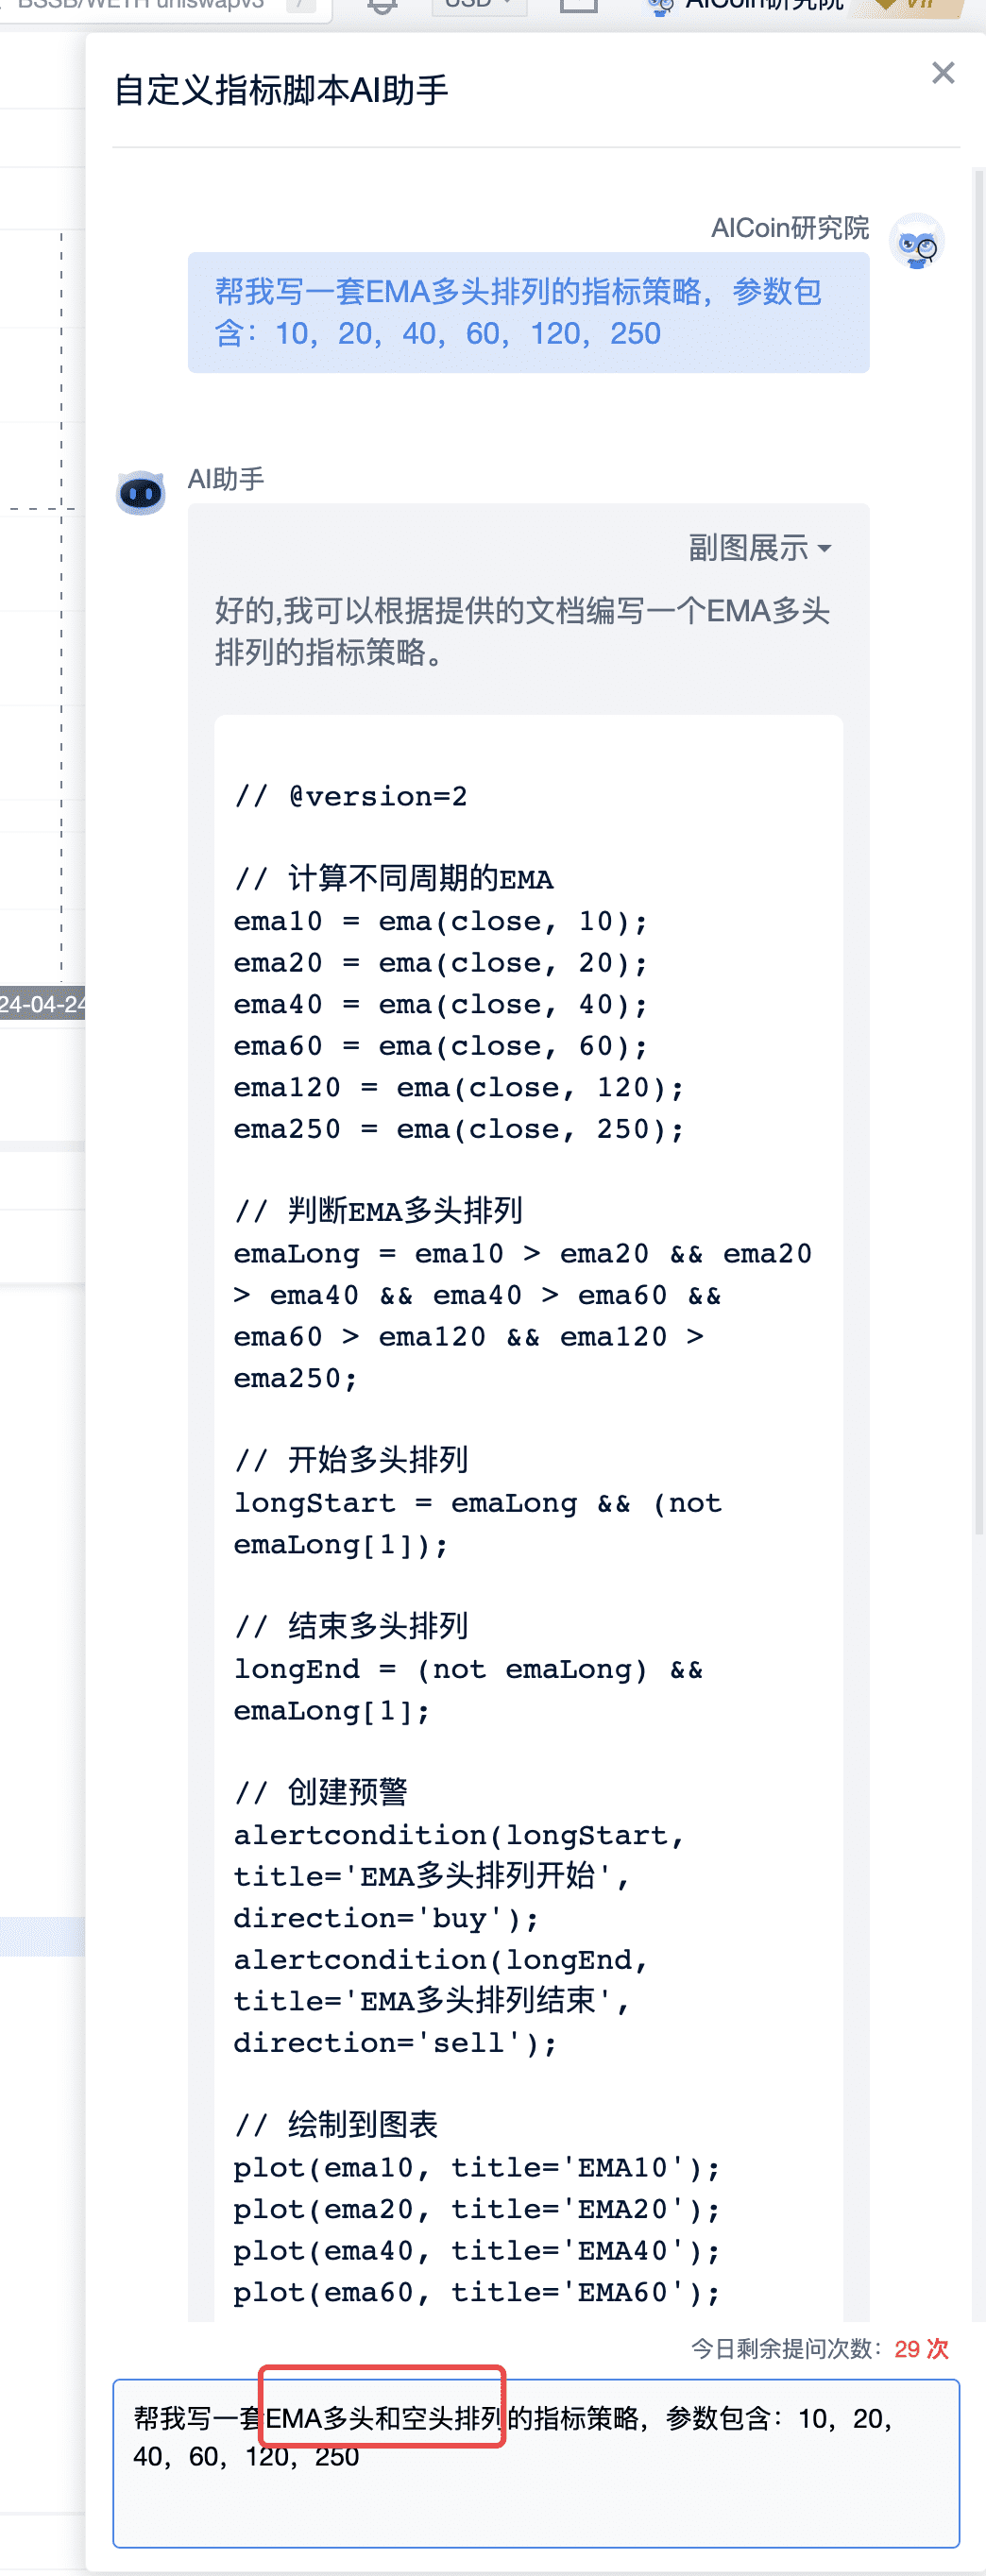
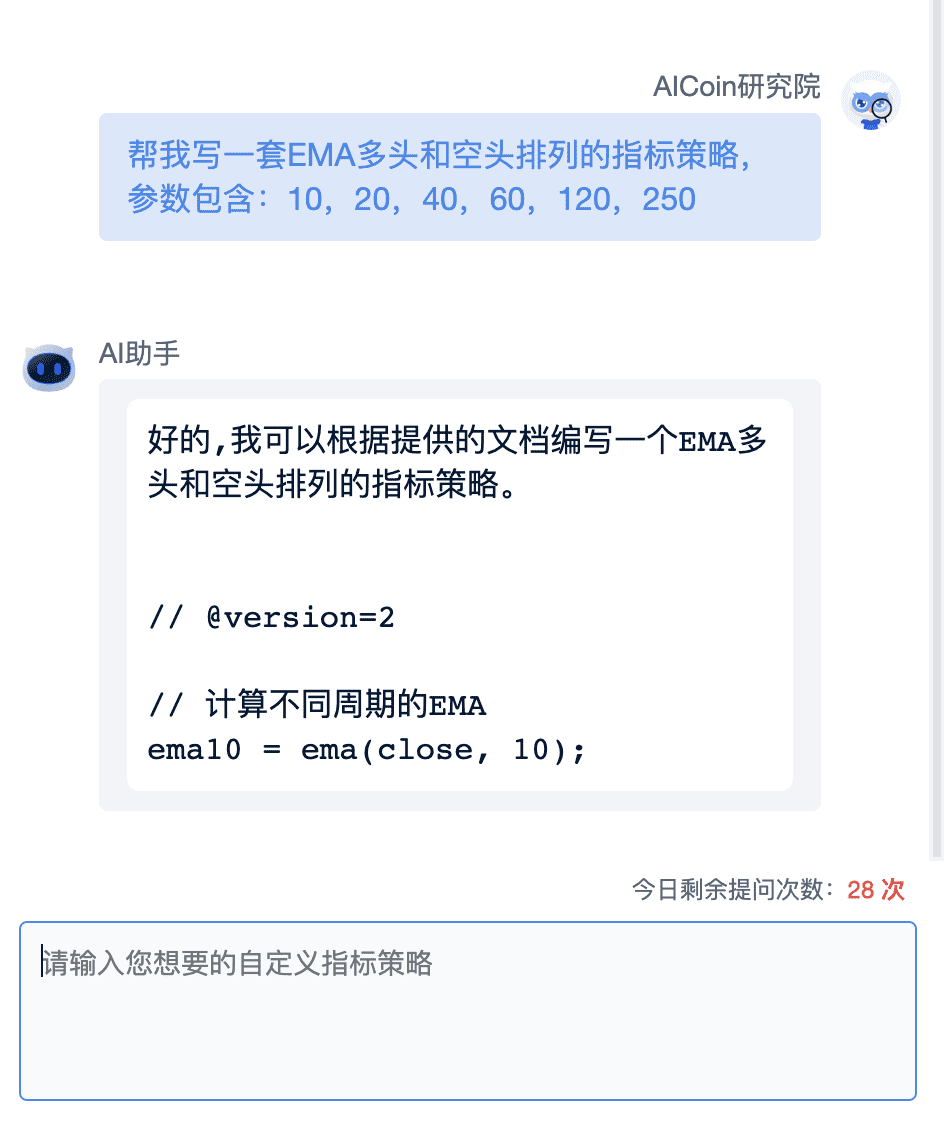
This completes the writing of a brand new custom indicator trend strategy.
III. Detailed Code (Can be Copied)
// @version=2
// Calculate EMA for different periods
ema10 = ema(close, 10);
ema20 = ema(close, 20);
ema40 = ema(close, 40);
ema60 = ema(close, 60);
ema120 = ema(close, 120);
ema250 = ema(close, 250);
// Determine EMA long position arrangement
emaLong = ema10 > ema20 && ema20 > ema40 && ema40 > ema60 && ema60 > ema120 && ema120 > ema250;
// Determine EMA short position arrangement
emaShort = ema10 < ema20 && ema20 < ema40 && ema40 < ema60 && ema60 < ema120 && ema120 < ema250;
// Start of long position arrangement
longStart = emaLong && (not emaLong[1]);
// End of long position arrangement
longEnd = (not emaLong) && emaLong[1];
// Start of short position arrangement
shortStart = emaShort && (not emaShort[1]);
// End of short position arrangement
shortEnd = (not emaShort) && emaShort[1];
// Create alerts
alertcondition(longStart, title='EMA Long Position Arrangement Start', direction='buy');
alertcondition(longEnd, title='EMA Long Position Arrangement End', direction='sell');
alertcondition(shortStart, title='EMA Short Position Arrangement Start', direction='sell');
alertcondition(shortEnd, title='EMA Short Position Arrangement End', direction='buy');
// Plot on chart
plot(ema10, title='EMA10');
plot(ema20, title='EMA20');
plot(ema40, title='EMA40');
plot(ema60, title='EMA60');
plot(ema120, title='EMA120');
plot(ema250, title='EMA250');
plotShape(longStart, title='EMA Long Position Arrangement Start', shape='arrowUp', color='green', refSeries=low, placement='bottom', fill=true);
plotShape(longEnd, title='EMA Long Position Arrangement End', shape='arrowDown', color='green', refSeries=high, placement='top', fill=false);
plotShape(shortStart, title='EMA Short Position Arrangement Start', shape='arrowDown', color='red', refSeries=high, placement='top', fill=true);
plotShape(shortEnd, title='EMA Short Position Arrangement End', shape='arrowUp', color='red', refSeries=low, placement='bottom', fill=false);
// Open Long Position
enterLong(longStart, price='market', amount=1);
// Close Long Position
exitLong(longEnd, price='market', amount=1);
// Open Short Position
enterShort(shortStart, price='market', amount=1);
// Close Short Position
exitShort(shortEnd, price='market', amount=1);
IV. Subscribe to Community Indicators
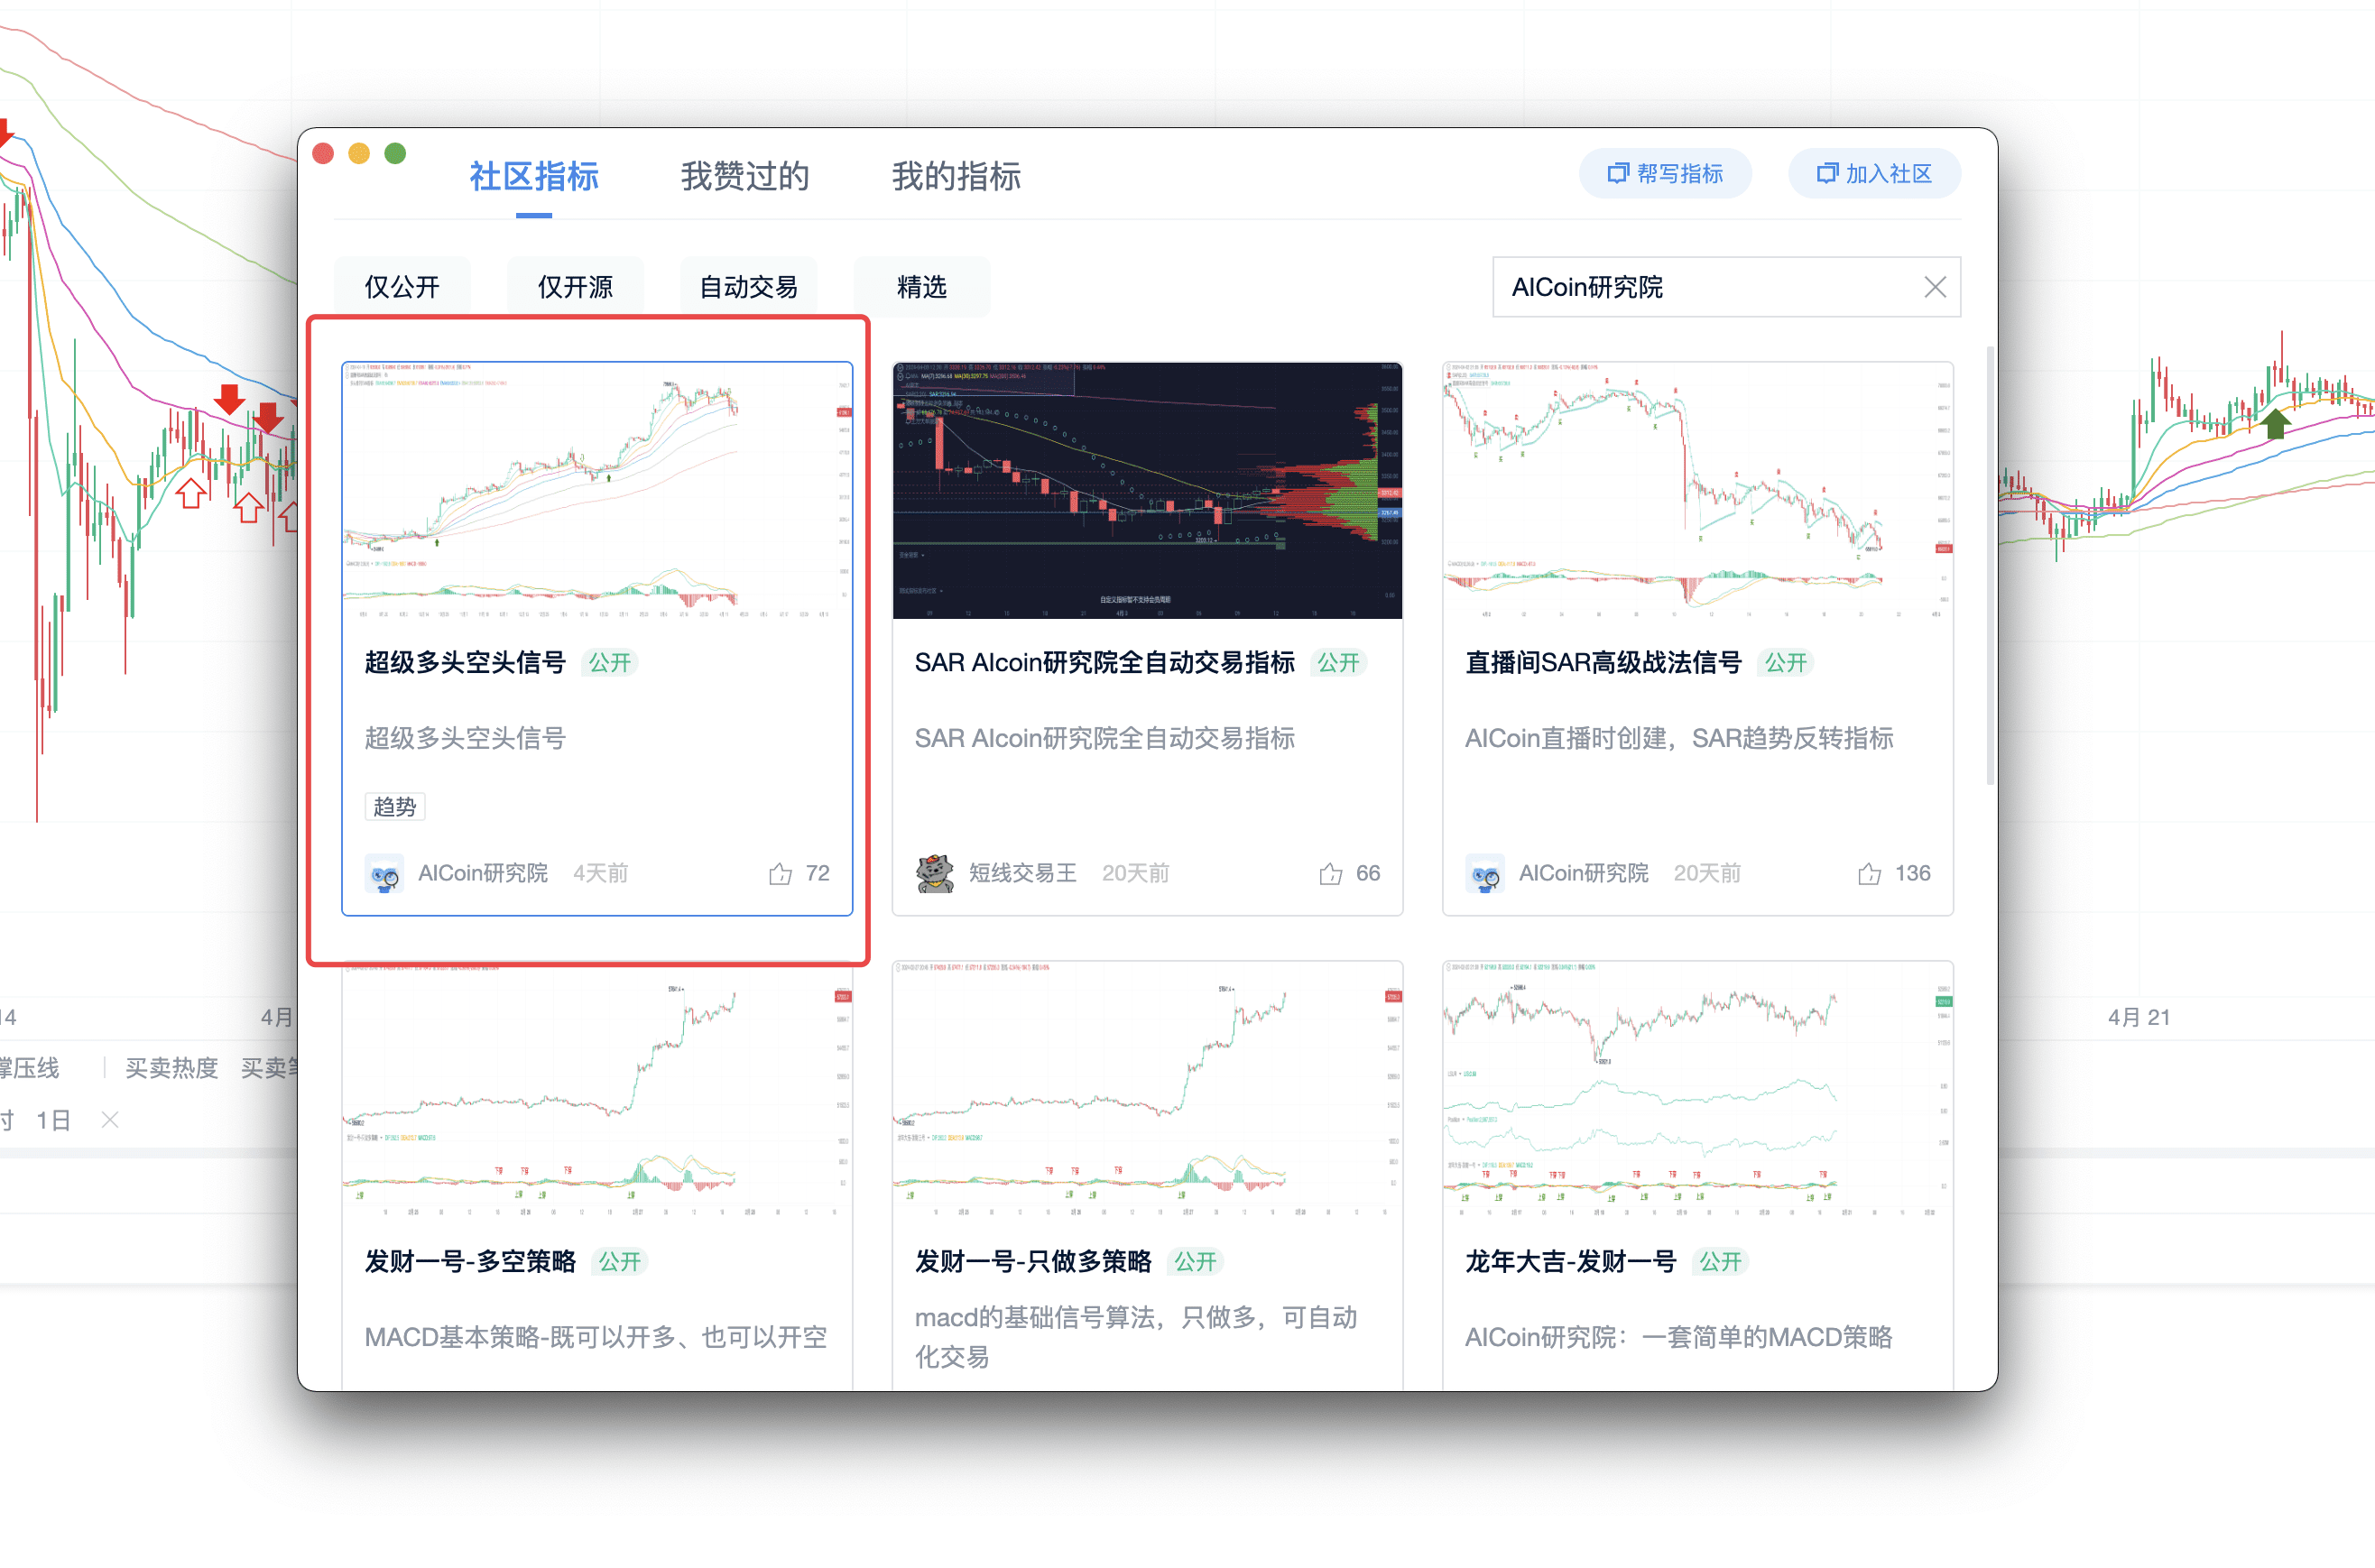
Search for AICoin Research Institute in the community indicators.
This open strategy is based on this indicator. It is recommended to track and use it more. Currently, it is a trending market, and the effect is very good.
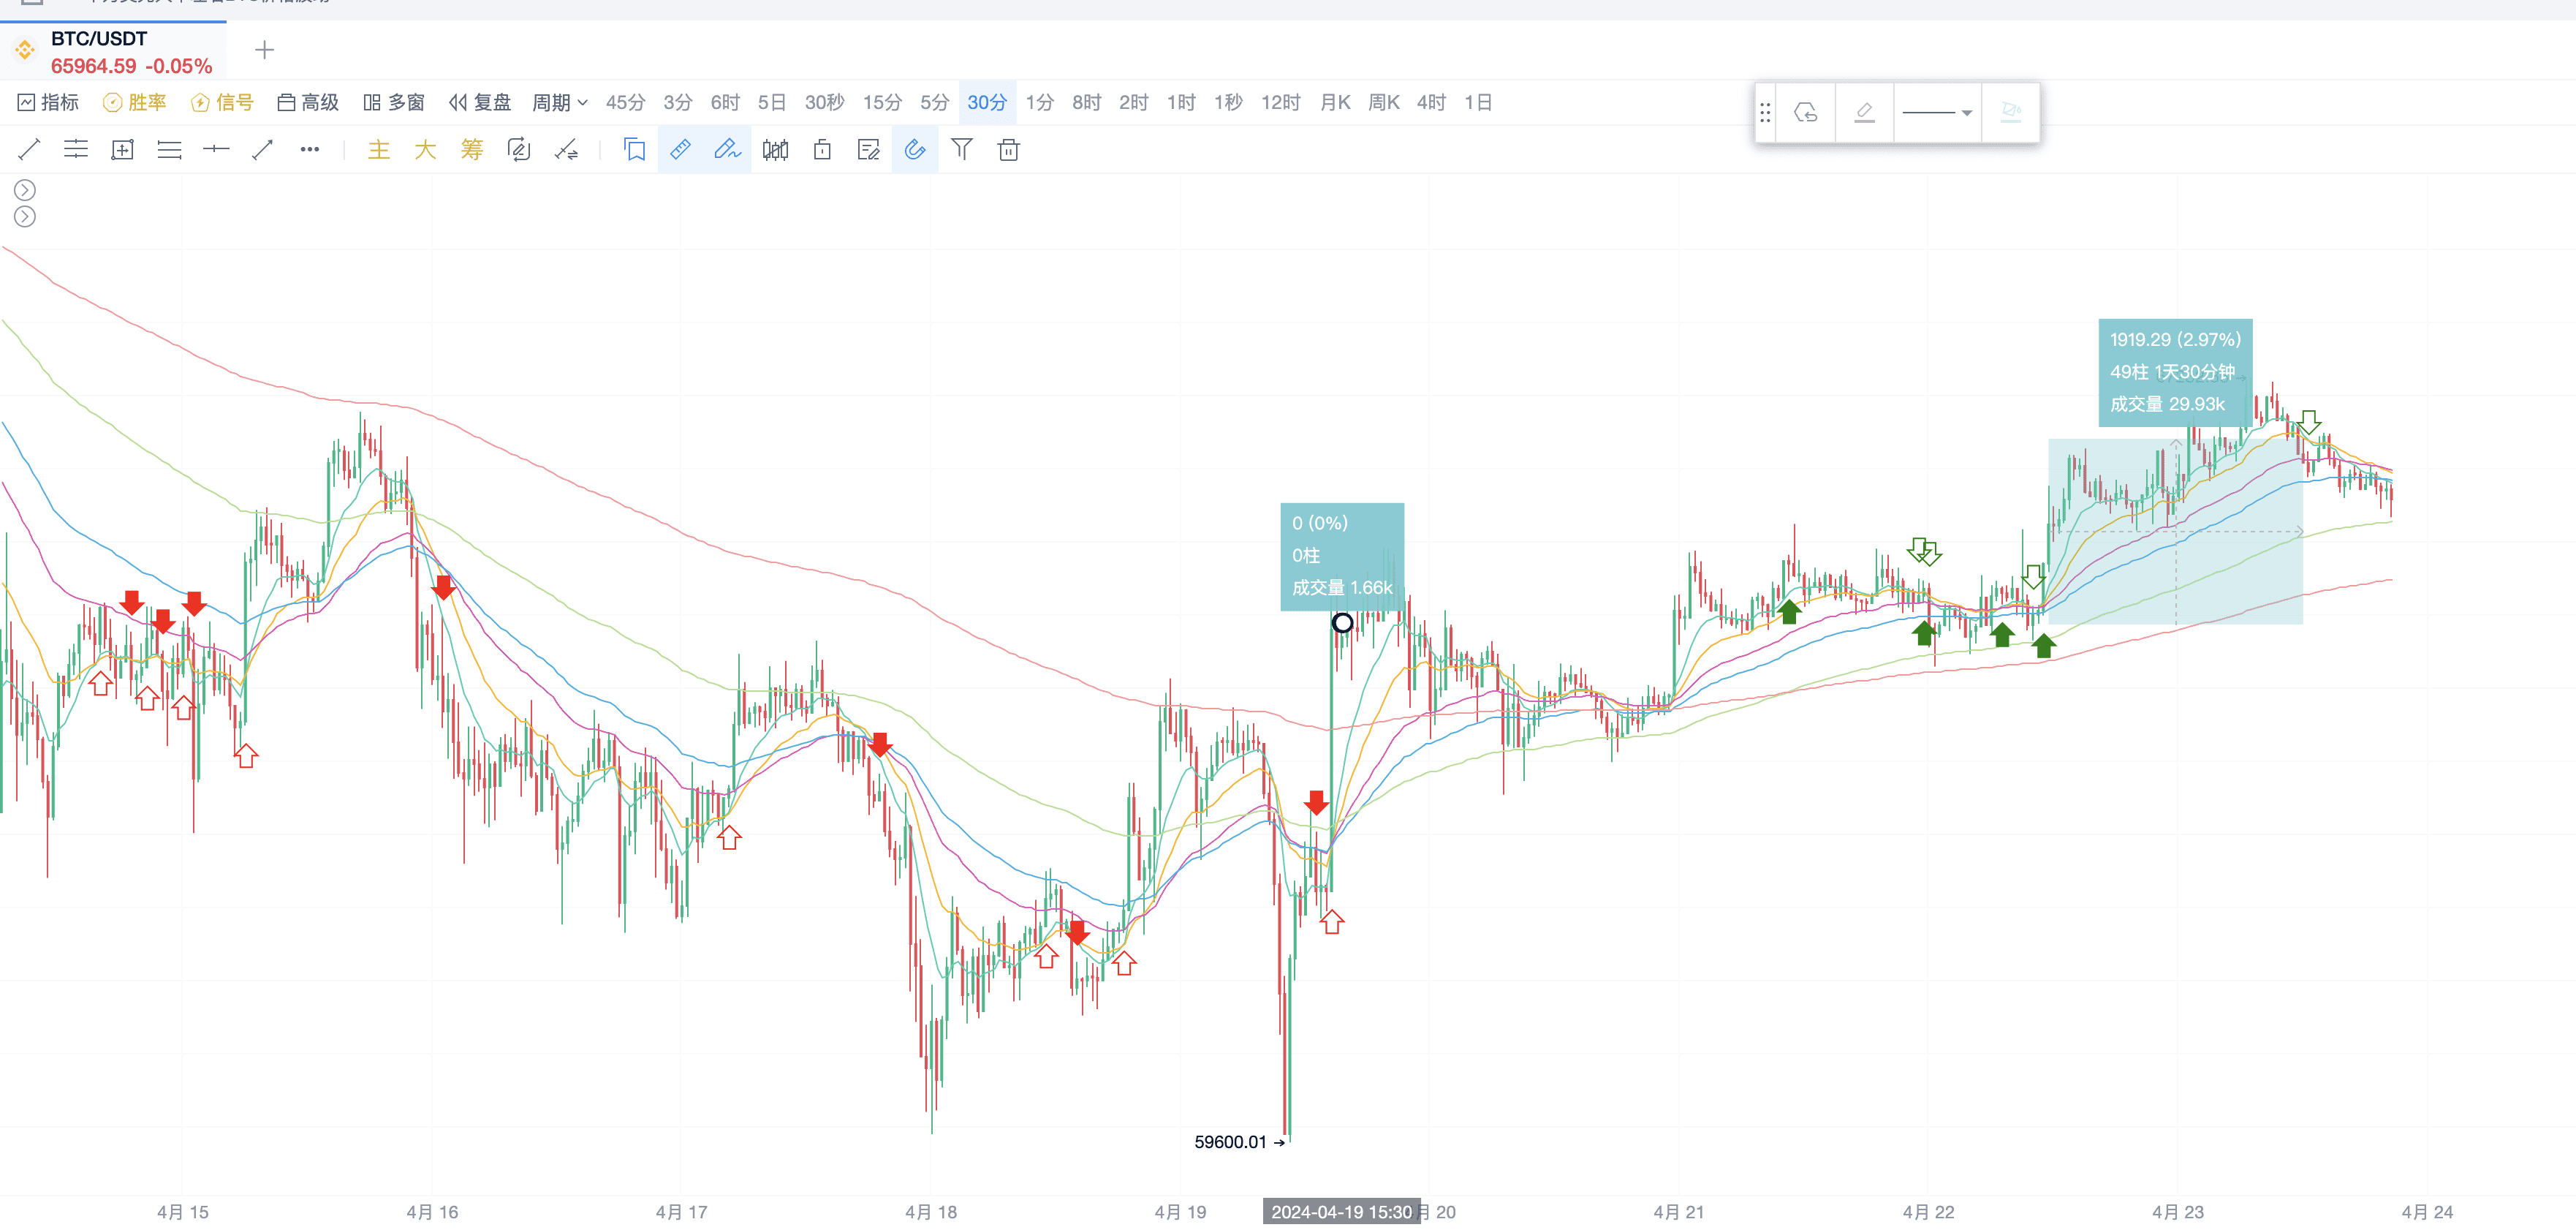
According to our backtesting, the 30-minute time frame performs the best. For example, in the 30-minute time frame, this set of signals captured a 3% gain.
These waves all resulted in significant profits.
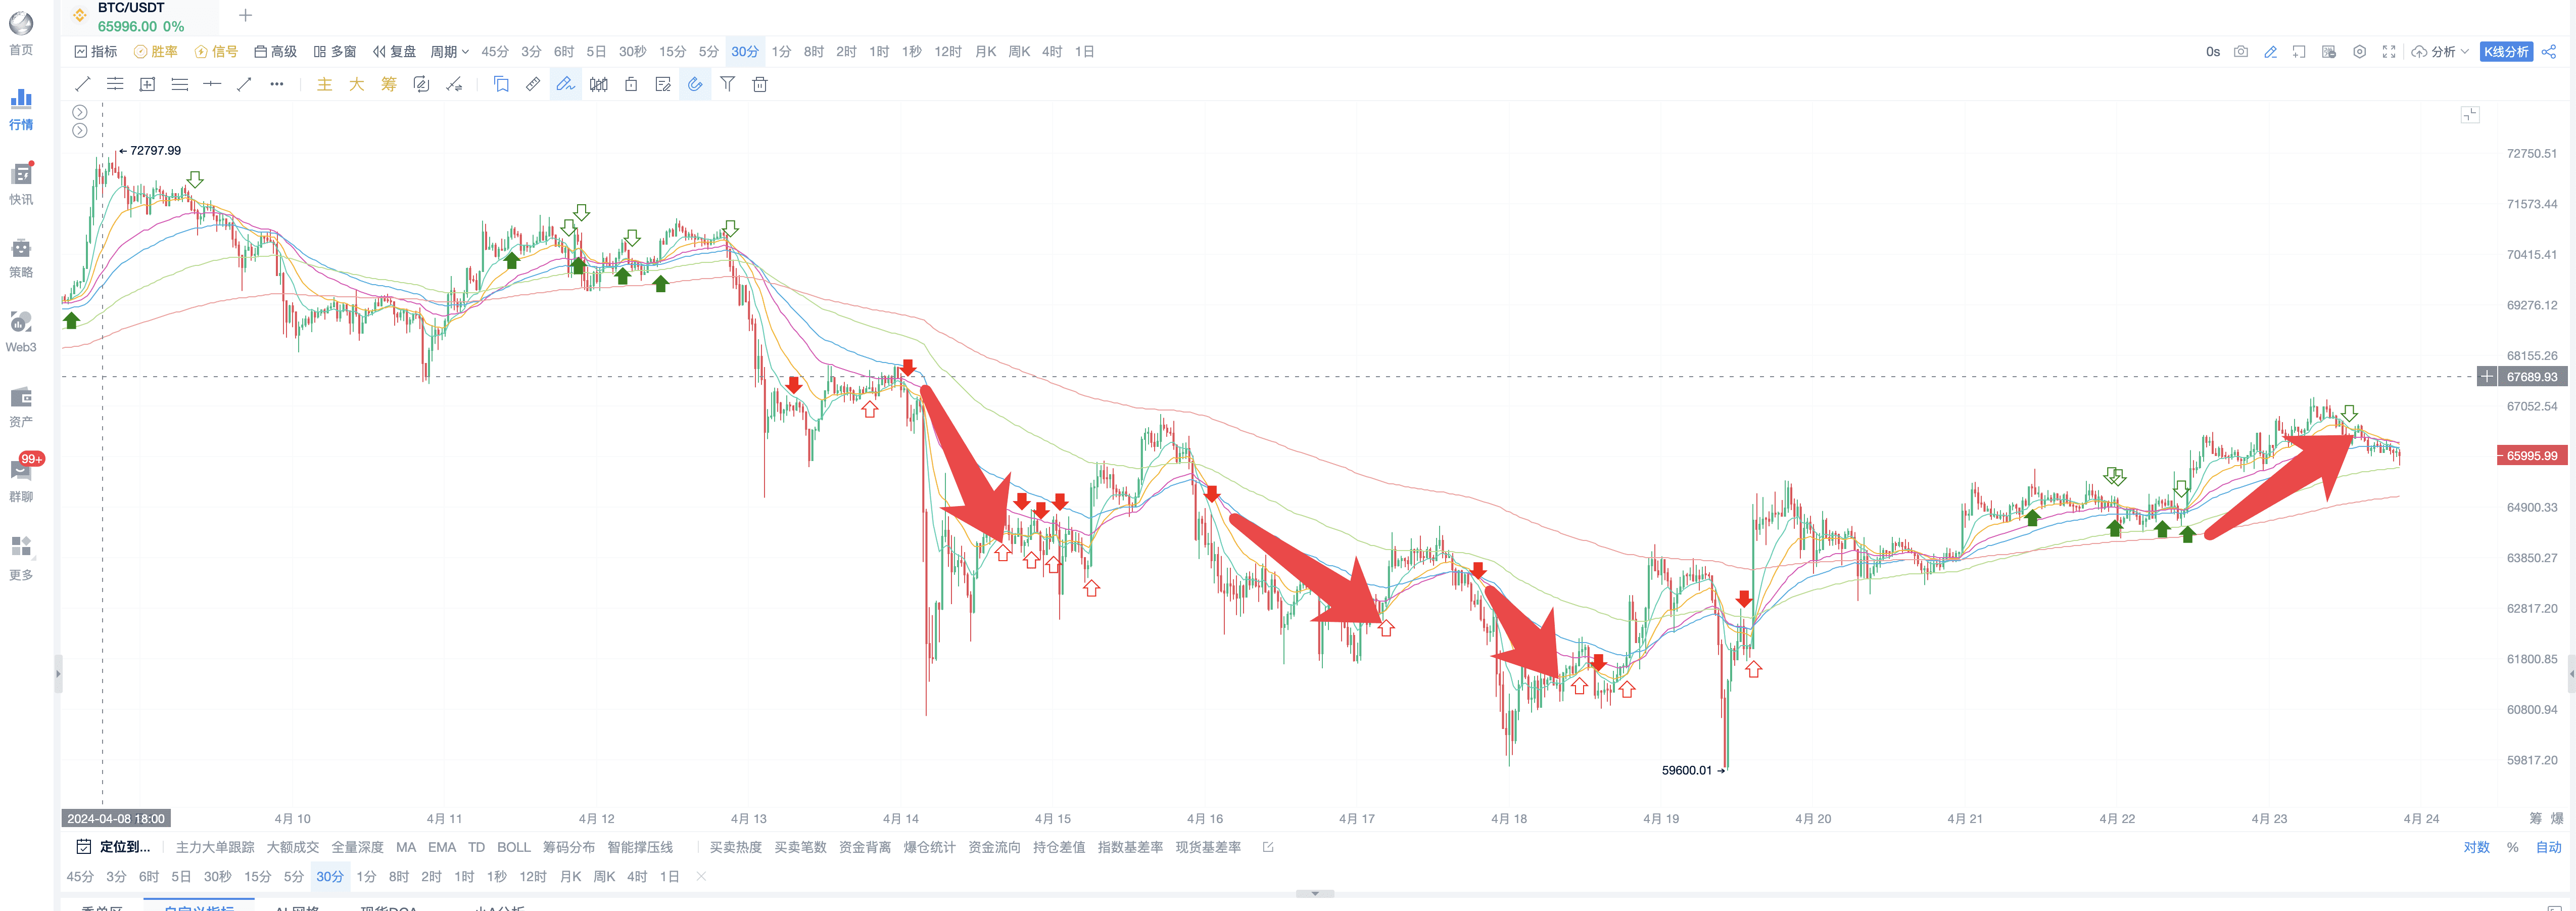
There are currently few upward movements. If green upward arrows continue to appear next time, please pay attention and consider entering the market. Everyone can subscribe to this strategy, modify parameters as needed, and also ask the editor to customize indicators.
The AI assistant can meet many conditions, as long as you provide your ideas to the AI. Our AI tools and custom indicator tools will provide more support to members. If you are interested in writing indicators with AI and want to build your own trading strategy, feel free to open a Signal Alert/PRO K-line/Indicator Win Rate membership. Any of these three memberships can be experienced for free for a limited time. Click the link below to start the experience: https://aicoin.app/en/vip/chartpro
Recommended Reading
For more live content, please follow AICoin's "News/Information-Live Review" section, and feel free to download AICoin PC-end
免责声明:本文章仅代表作者个人观点,不代表本平台的立场和观点。本文章仅供信息分享,不构成对任何人的任何投资建议。用户与作者之间的任何争议,与本平台无关。如网页中刊载的文章或图片涉及侵权,请提供相关的权利证明和身份证明发送邮件到support@aicoin.com,本平台相关工作人员将会进行核查。

