Article: THE ALTCOIN INVESTOR
Compiled by: DeepTechFlow
Today I want to share 10 charts to help everyone understand the direction of the current cryptocurrency market.
Ten Charts of the Current State of Cryptocurrency
Glassnode and Coinbase have released the "Cryptocurrency Market Guide," a quarterly series aimed at providing detailed analysis of the major developments in the cryptocurrency market.
Here are 10 charts from the report that caught our attention:
1. Bitcoin Dominance Increased from 50% to 52%
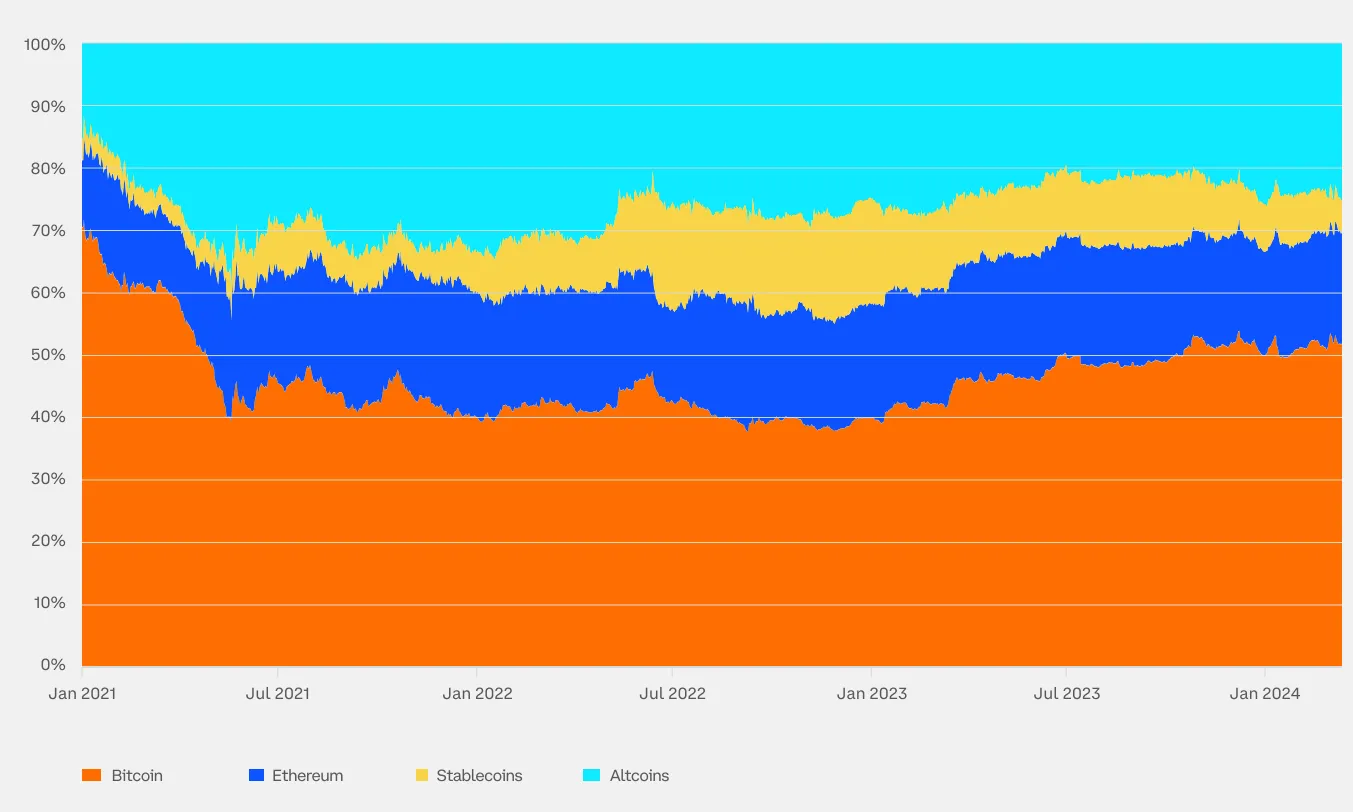
The altcoin season typically triggered by halving events would reduce Bitcoin's dominance, making it more inclined towards new altcoins. This has not happened yet, so there is still significant room for growth.
2. Cryptocurrency Correlation

Cryptocurrencies historically have very low correlation with traditional asset classes, indicating that they can provide meaningful diversification in many different investment portfolios.
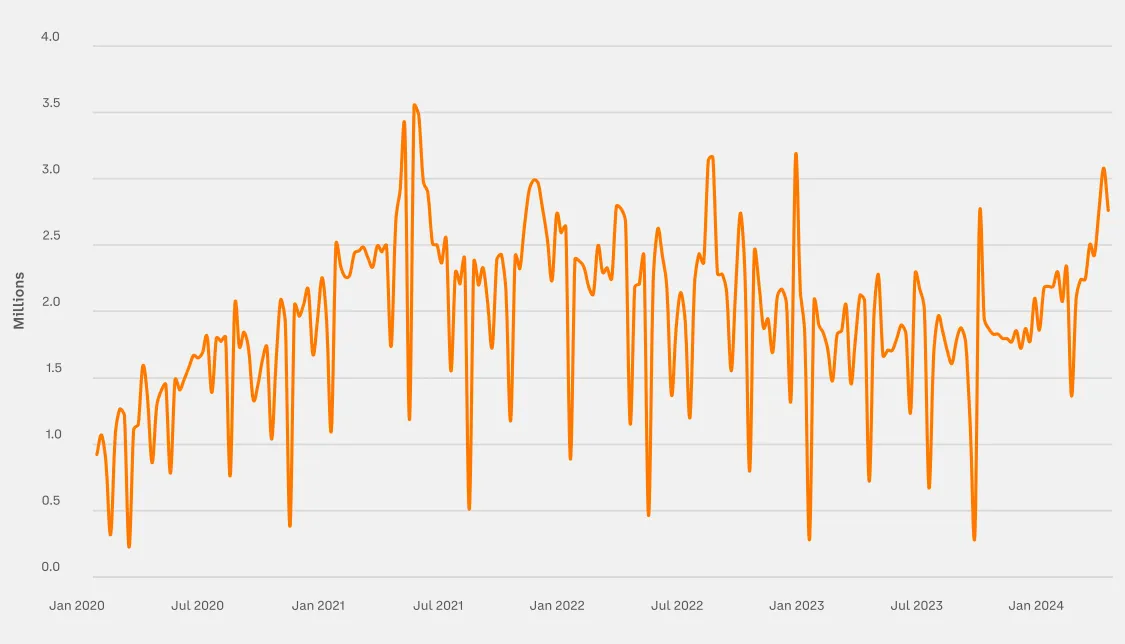
3. Stablecoin Supply Increased by Over 14% in the First Quarter
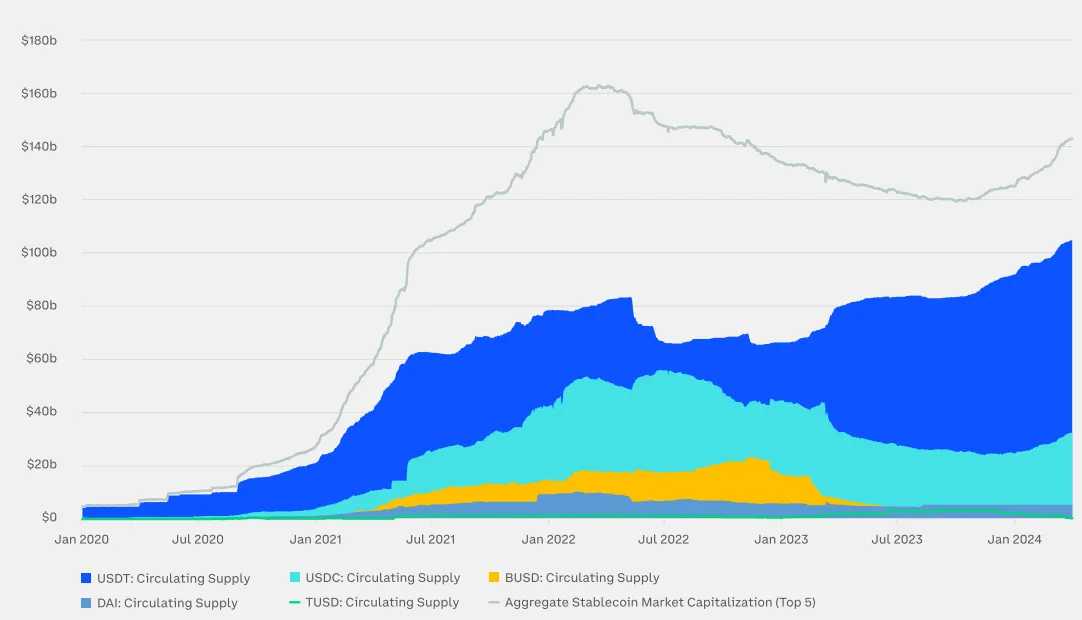
An important metric to consider when evaluating stablecoins is the quantity and nature of the reserve assets they hold. As market participants continue to increase their use of stablecoins, the supply of stablecoins increased by over 14% in the first quarter.
4. Bitcoin Price Performance After Halving
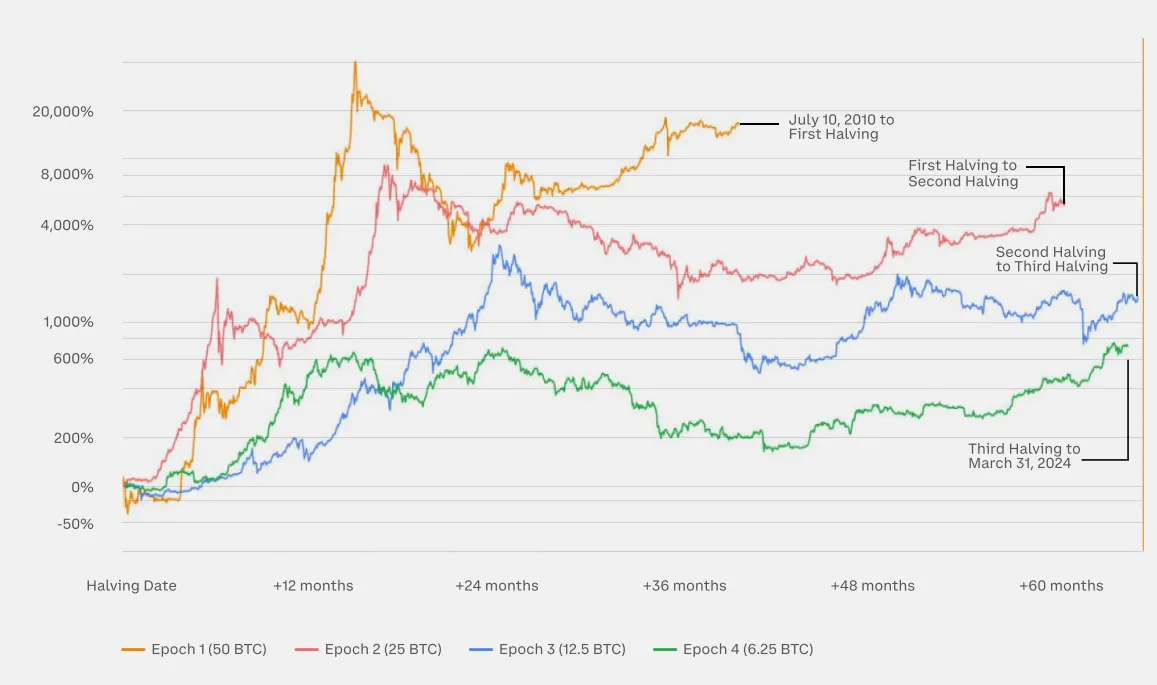
This chart measures the total return of Bitcoin in each halving cycle. In the 12 months following the first three halvings, the price:
- Increased by over 1000% after the first halving (red line)
- Increased by over 200% after the second halving (blue line)
- Increased by over 600% after the third halving (green line)
5. Available Bitcoin Supply
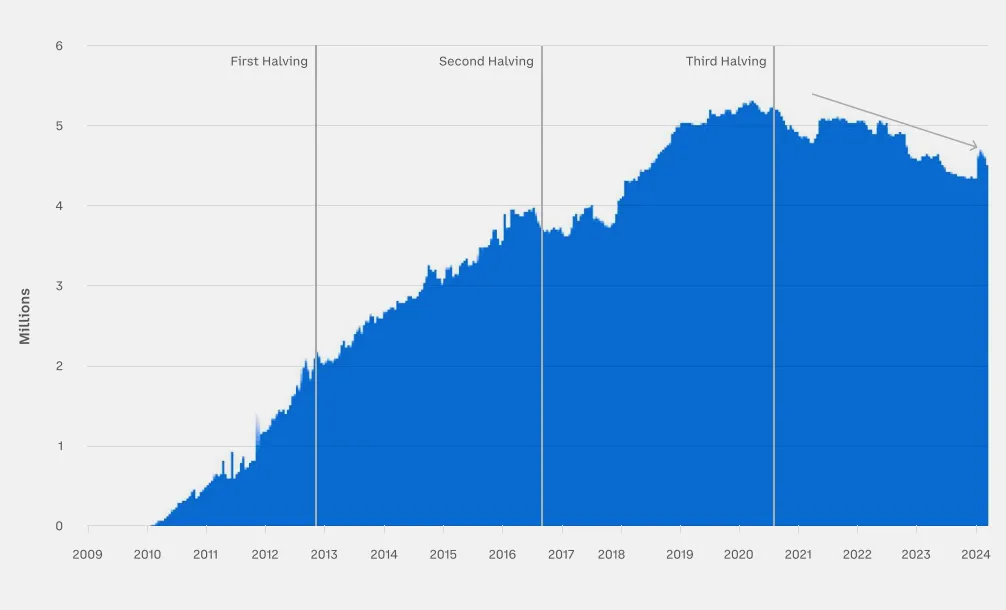
The difference between the current circulating supply of tokens and the non-circulating supply (lost wallets, long-term holdings, locked) determines the quantity of available Bitcoin supply.
After reaching a peak in early 2020, the available supply of Bitcoin has decreased to around 4.6 million bitcoins, marking a significant shift before the fourth halving, unlike the steady increase in available supply observed during the previous three halving periods.
6. Bull Market Cycle Performance
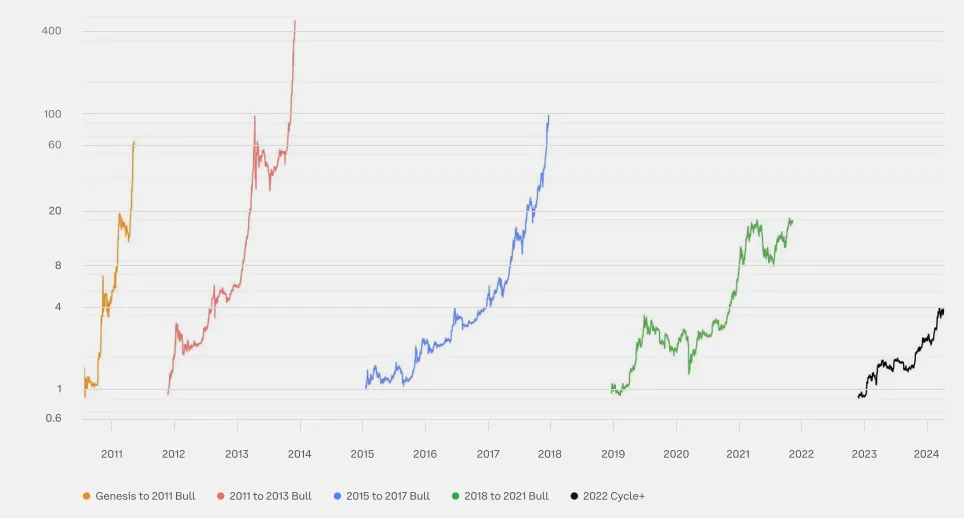
Bitcoin has historically exhibited exponential growth during bull markets, with prices surging multiple times from the low point. The current bull market cycle began in November 2022, and prices have already quadrupled from the low point. As shown in the chart, the previous two bull markets (2015 to 2017 and 2018 to 2021) saw price increases of 100x and 20x, respectively.
7. Bitcoin Price Performance Since the Low Point
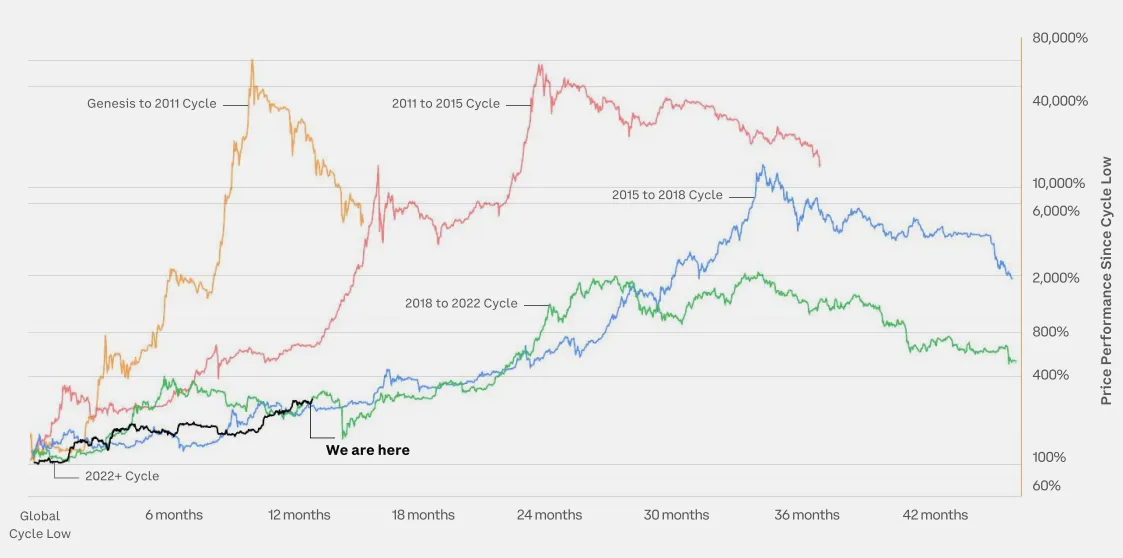
Bitcoin has completed four cycles, each including bull and bear markets. This chart compares the current market cycle since 2022 with previous cycles. In the current cycle, Bitcoin has risen by over 400% in the 17 months since the low point. The current cycle is most similar to the 2018 to 2022 cycle, during which Bitcoin rose by 1000% in the 24 months after the low point.
8. Ethereum Price Performance Since the Low Point
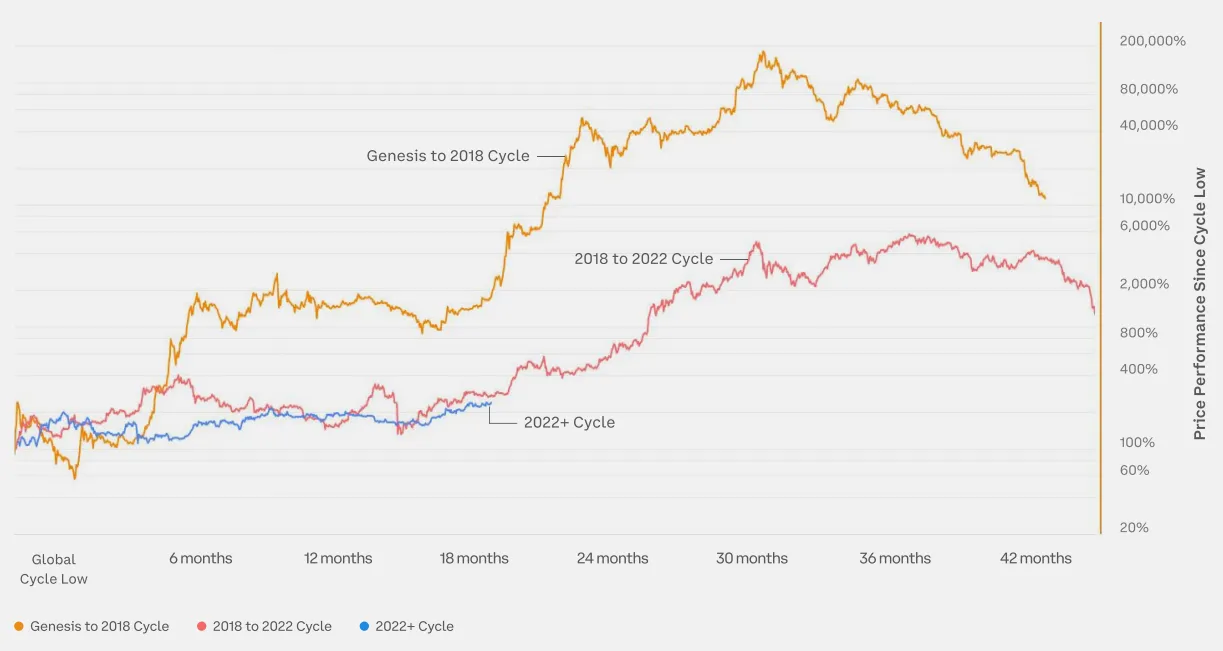
Ethereum has completed two cycles including bull and bear markets. This chart compares the current market cycle since 2022 with previous cycles. In the current cycle, Ethereum has risen by over 200% in the 17 months since the low point. The current cycle is most similar to the 2018 to 2022 cycle, during which Ethereum rose by 400% in the 24 months after the low point.
9. Ethereum Supply Profitability Status
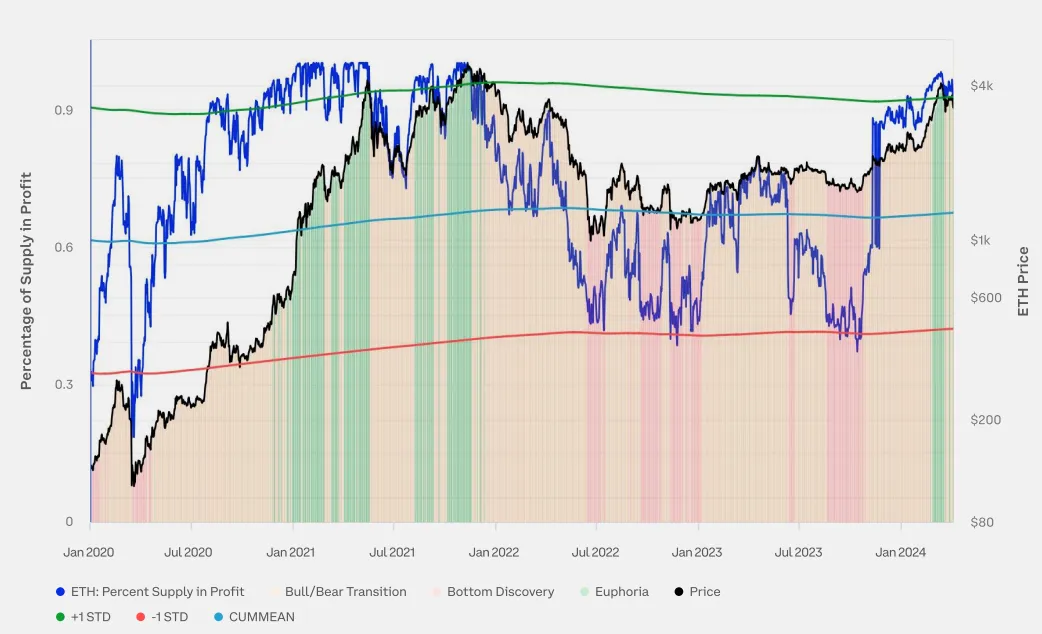
Observing supply profitability can help reveal the cryptocurrency price position in the current market cycle, as previous cryptocurrency market cycles have been characterized by three stages:
- Price Bottom: In the final stage of the bear market, a prolonged price decline leads to an increase in the share of unprofitable supply (percentage of profitable supply 55%).
- Euphoria: During the parabolic price surge in the bull market, the share of profitable supply dominates (percentage of profitable supply > 95%).
- Bull/Bear Transition: The transition period between bottom exploration and euphoria, where supply profitability is closer to balance (percentage of profitable supply between 55% and 95%).
10. Ethereum Weekly Active Addresses Increased by 26%
With the price increase and the successful Dencun upgrade of Ethereum, active addresses grew by 26% in the first quarter.
免责声明:本文章仅代表作者个人观点,不代表本平台的立场和观点。本文章仅供信息分享,不构成对任何人的任何投资建议。用户与作者之间的任何争议,与本平台无关。如网页中刊载的文章或图片涉及侵权,请提供相关的权利证明和身份证明发送邮件到support@aicoin.com,本平台相关工作人员将会进行核查。


