This article is only a personal opinion on the market and does not constitute investment advice. If you act based on this, you are responsible for your gains and losses.
Last Friday's article expressed my views, and personally, I believe that around 60,000 is the low point for the pullback. The market trend since the weekend has been good, with BTC and ETH breaking through 65,500 and 3130 respectively, basically declaring the end of the pullback trend.
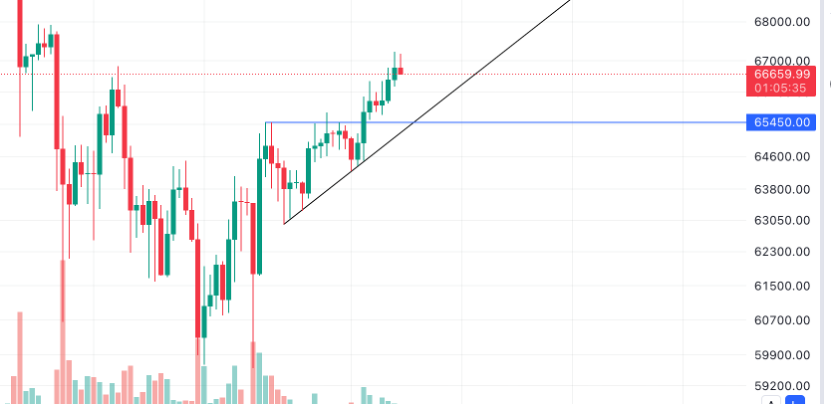
Looking at the 4-hour candlestick chart of BTC, there is a complex head and shoulders bottom pattern. The green part is a large head and shoulders bottom. It has already broken through the neckline. And the head of the green head and shoulders bottom is formed by a small head and shoulders bottom. Combined with the bullish technical indicators at the 4-hour level and the increased trading volume at the breakthrough, this head and shoulders bottom should be considered valid. The red line in the chart below also shows that after breaking through 65,500, BTC had a horizontal confirmation process.
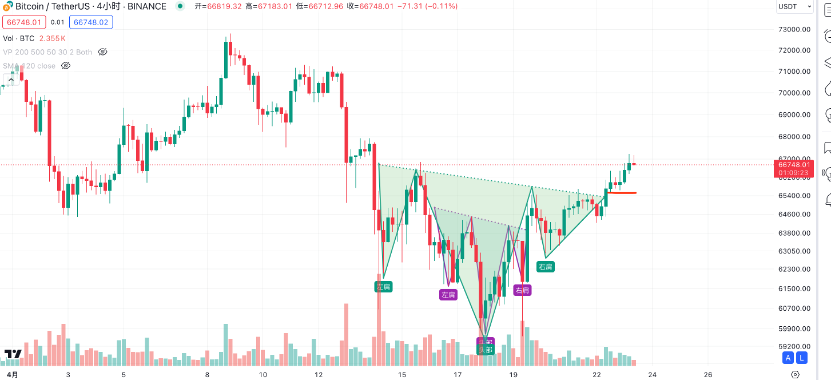
The right shoulder part of the above head and shoulders bottom is a symmetrical triangle pattern. A breakthrough with increased volume and bullish technical indicators should be confirmed as a valid breakthrough. Therefore, considering these short-term patterns, as long as it does not fall back below 65,500, we should continue to be bullish on BTC. According to the measured distance of the head and shoulders bottom, the target position should be above 71,000. The current price still has a good risk-reward ratio.
ETH also has a 4-hour head and shoulders bottom structure, with the neckline at 3130, coinciding with the Fibonacci level. Therefore, above 3130, we should also remain bullish on ETH. If it can break through the previous high of around 3300 in the subsequent rebound from the previous decline, we can continue to be bullish towards 3600+.
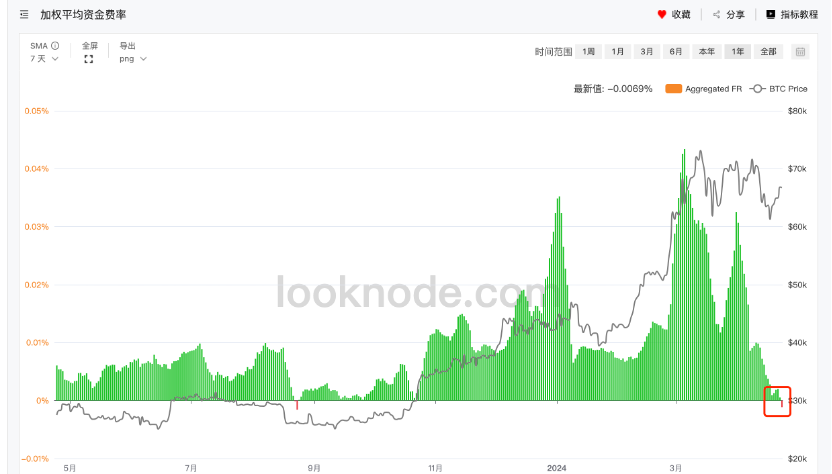
Looking at the 7-day weighted funding rate, it still reflects strong bearish sentiment and panic.
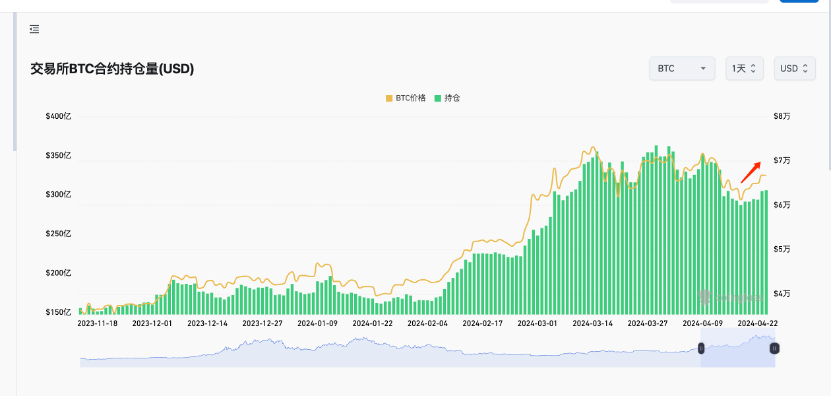
From the perspective of the contract open interest, during the price increase process, the increase in price and volume does not show any adverse signals.
Last week may have been the most depressed week of the year (mainly due to the sharp decline in altcoin prices), but the worst situation has passed. Currently, the price is above the support line, maintaining optimism.
The monthly K-line opened at around 71,300, which is also the upper edge of the rectangular range for over a month, and it is also near the target position of the aforementioned head and shoulders bottom rebound. It is expected that the remaining time of this month will be a slow and steady upward trend, with the monthly K-line closing with a bearish candle. In May, it will once again challenge the upper edge of the range. If it can break through, a new high can be expected, with a low of over 80,000 and a high of over 90,000. If it cannot break through, it will maintain a range of 60,000-71,000 for a long time, and there will be a few months of relatively poor performance.

Follow me and maximize trend profits with minimal operations.

免责声明:本文章仅代表作者个人观点,不代表本平台的立场和观点。本文章仅供信息分享,不构成对任何人的任何投资建议。用户与作者之间的任何争议,与本平台无关。如网页中刊载的文章或图片涉及侵权,请提供相关的权利证明和身份证明发送邮件到support@aicoin.com,本平台相关工作人员将会进行核查。


