This article is only a personal opinion on the market and does not constitute investment advice. If you act based on this, you are responsible for your gains and losses.
Since being attacked by Iran over the weekend, today there has been another wave of attacks by Israel. However, there are some different signals in the market compared to last weekend. I will share my own views on BTC, ETH, and altcoins.
- BTC
When BTC fell rapidly last weekend, there was a wave of panic, and the premium of quarterly futures contracts briefly turned negative. This is an extremely rare panic signal in the bull market process.
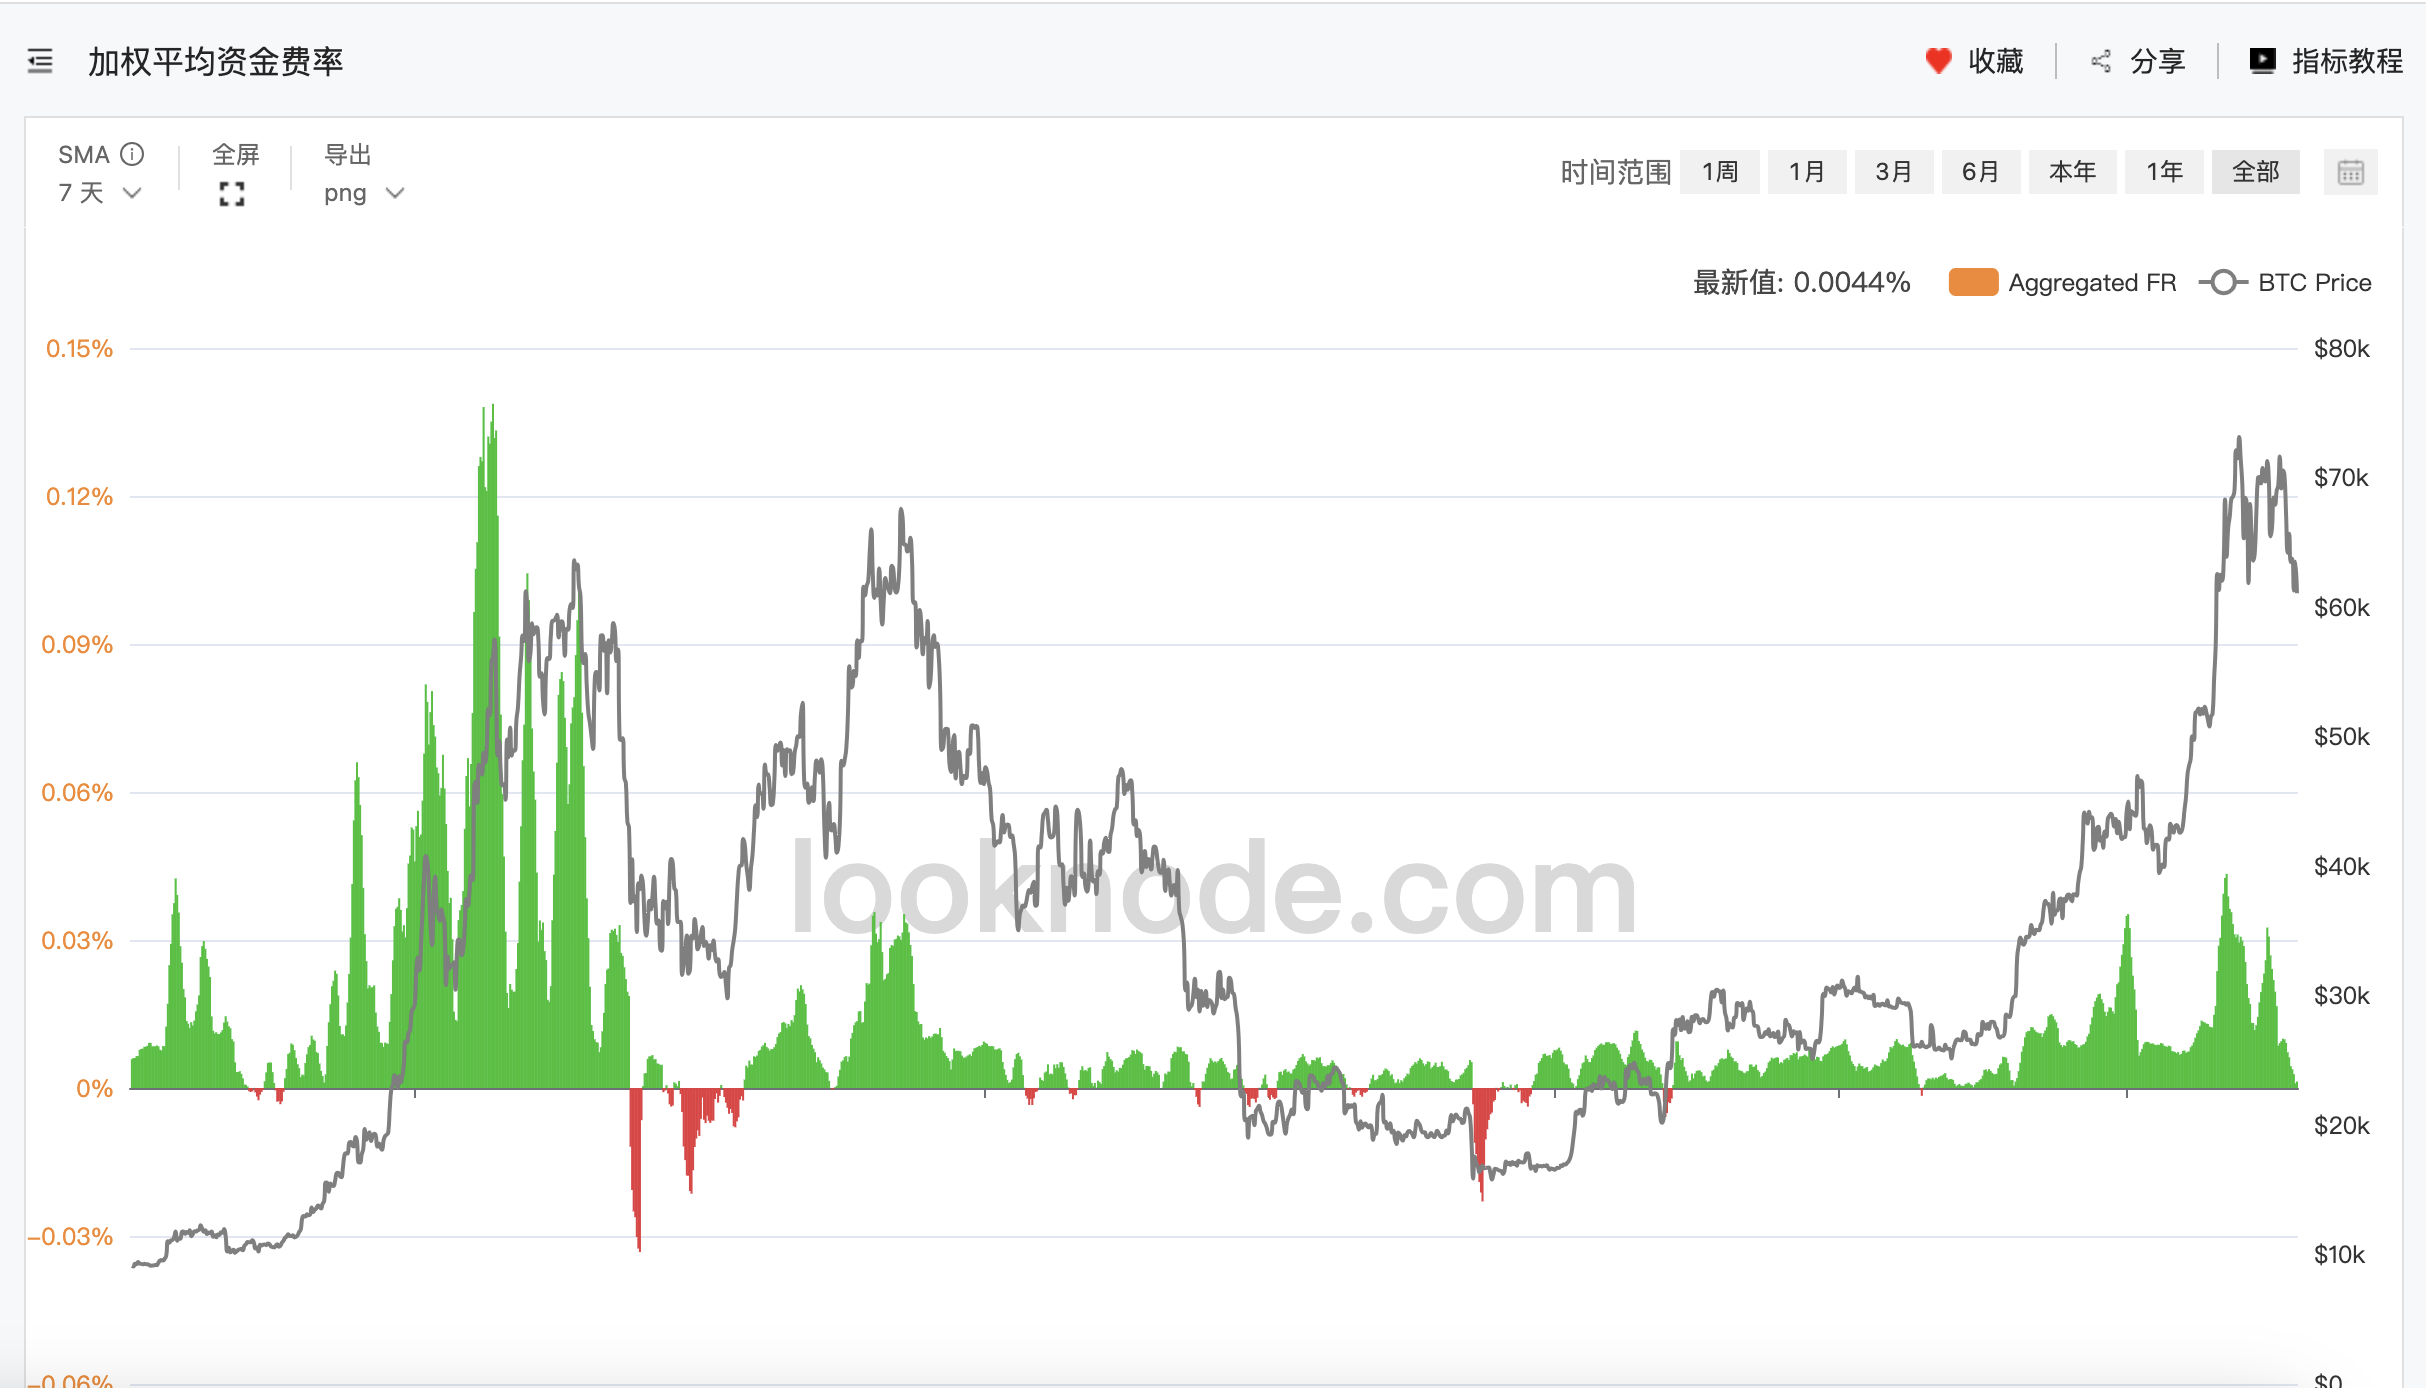
In the bull market process, the majority of people naturally tend to be long, and the funding rate of perpetual contracts rarely shows a negative rate. When looking at the 7-day weighted average funding rate, it is very rare to see this indicator in a negative state during the entire bull market process (it only occurred twice during the main uptrend of the bull market in 2020-2021). Even in the bear market process, when the 7-day weighted average funding rate is negative, it has basically reached a temporary bottom (the indicator's success rate is close to 100%). In 2022, I have shared this indicator with everyone many times.
This week, the lowest point of this indicator has almost reached 0, just one step away from being negative. Unless more extreme panic occurs, this should be a temporary bottom. So far, there has only been one negative value on August 23, 2023, and it was close to 0 on October 21.

Another indicator is the profit rate at the time of sale, which still uses a 7-day average. The blue box shows the performance during the bear market, which is mostly selling at a loss, so the profit rate at the time of sale has remained in a loss state for a long time. However, in the rising range of the bull market—shown in the three red boxes in the chart, when the 7-day average value of this indicator is negative, it also corresponds to the bottom of the pullback. By Thursday, the 7-day average value of this indicator has already touched below zero.

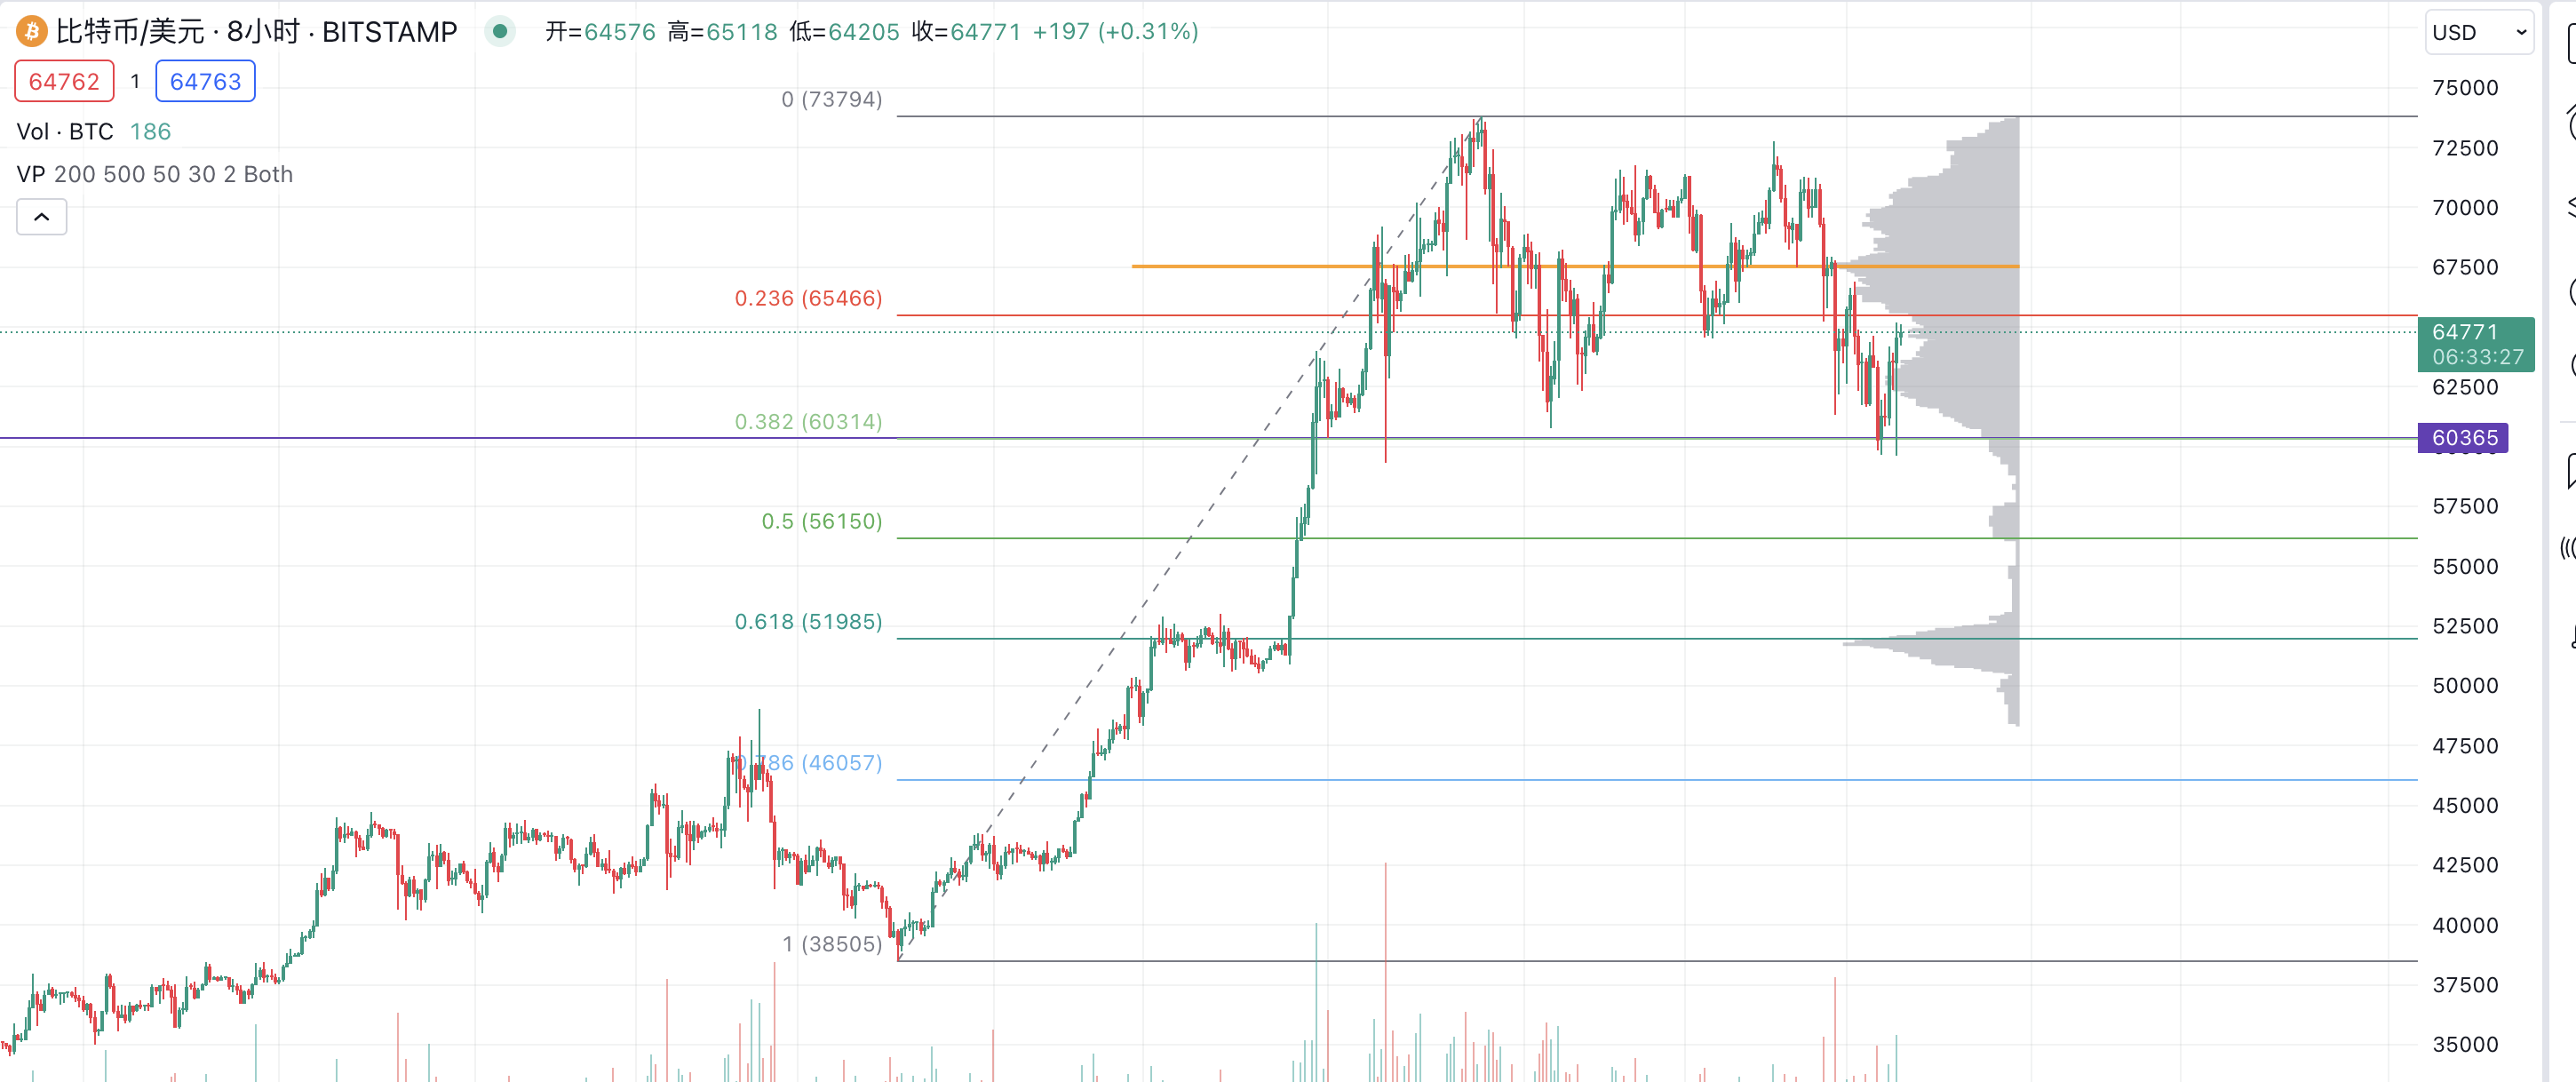
Looking at the liquidation map of the contracts, the long positions in the short term have already been liquidated. Below 60,000, there are still positions for liquidation at 58,000 and 51,000. The corresponding possibilities are: 60,000 is the bottom; a spike at 58,000; or a further plunge to 51,000 for liquidation.
The recent decline since last week has largely been caused by panic selling due to the uncertainty of the Iran-Israel war. Moreover, the recovery speed after the sell-off today is far better than last weekend. Therefore, if there are no larger war signals, I do not think there will be a fierce decline.
Finally, looking at the BTC candlestick chart, 60,000 is a support level in terms of form and a Fibonacci support level. It has received support multiple times in the past week. If it falls below 60,000, the next chip peak is around 52,000.

Taking all the above points into consideration, my personal opinion is that there is a high possibility that 60,000 is the bottom of this pullback. If it can maintain 2-3 candlesticks closing above 65,500 (Fibonacci support level) on the 4-hour chart, the pullback is likely to be over.
- ETH
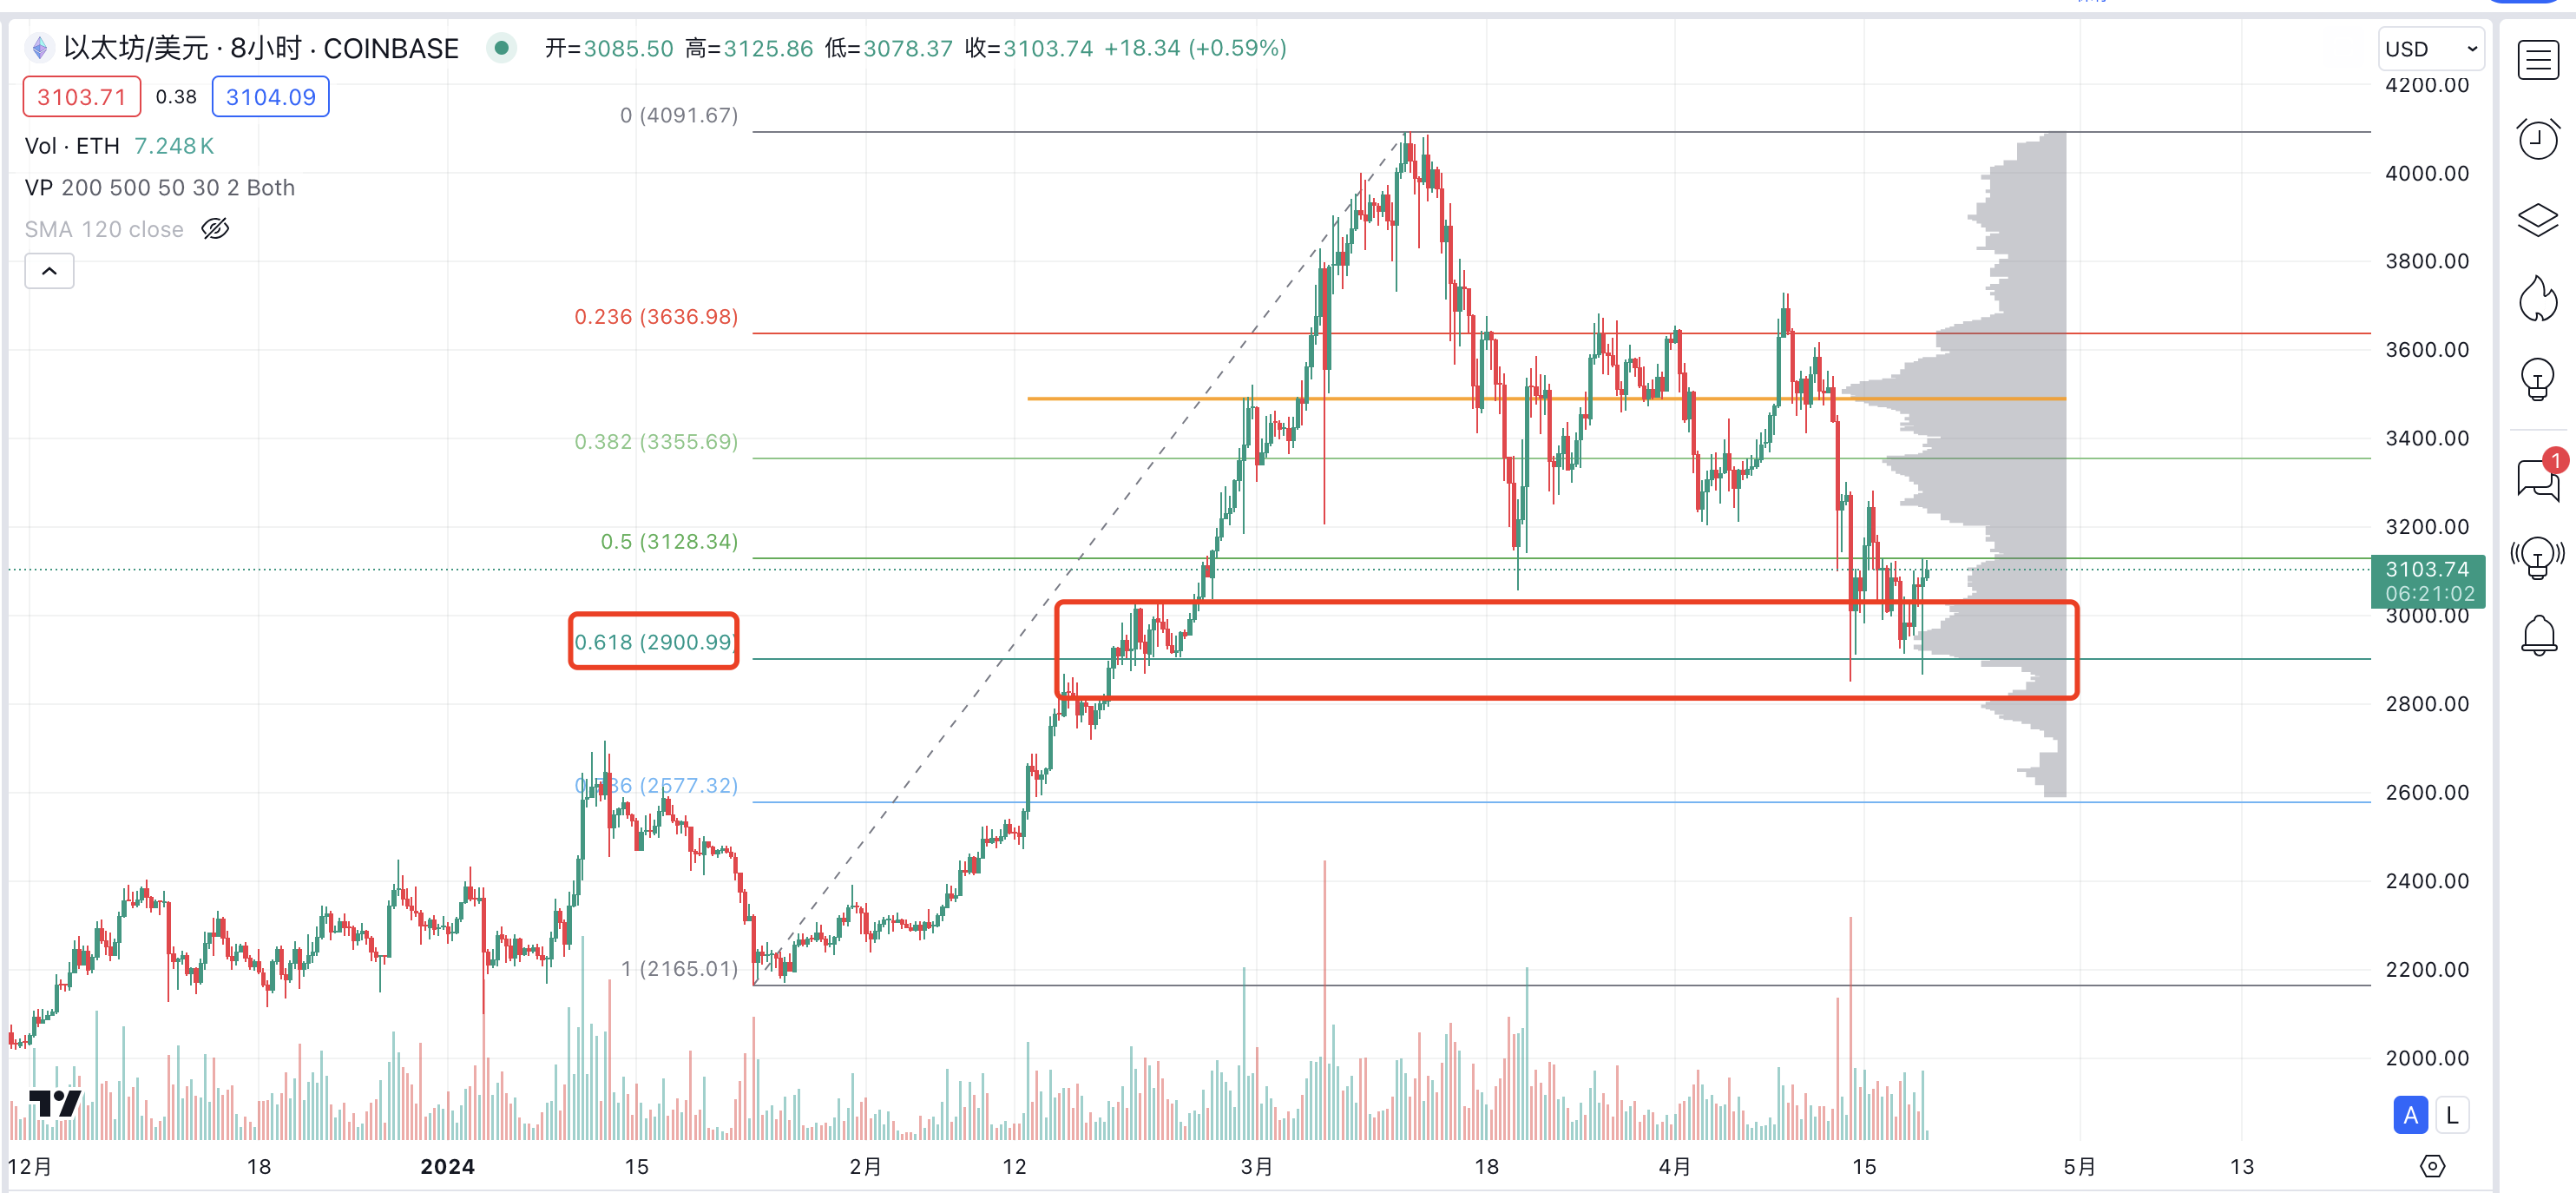
After ETH fell below 3,100, it spiked to below 2,800. It has spiked below 2,900 multiple times this week and then recovered. Looking at the chart, around 2,900 is a significant support level for several indicators. Firstly, it is a Fibonacci support level; secondly, there is a stack of chip peaks here; thirdly, it is the position of the sideways oscillation in late February (at that time, news reported that large amounts of ETH were bought around 2,700 by a whale); finally, 2,900 is also the position of ETH's 120-day moving average.
Therefore, considering the above points, 2,900 is definitely an important support level and not so easy to break through. If ETH can reclaim above 3,130, the pullback is likely to be over.

- Altcoins
Recently, many people have been saying that there will be no more altcoin seasons. I personally believe that there will be an altcoin season in every cycle. The only difference lies in the timing of the launch, and in the future, the time window left for the collective launch of altcoins will become shorter and shorter, with most being short and fast waves.
Just like large-cap and small-cap stocks in the stock market. In each bull market cycle, large-cap stocks rise first, and when they can no longer rise, the profits start to shift to mid and small-cap stocks. The reasons behind this are not specifically analyzed, but this is a phenomenon that has repeatedly occurred in various markets in various countries around the world. The cryptocurrency market is no exception.
Looking at the example of real estate, it's the same principle. During the rising period of house prices, it starts to rise from the core areas of core cities, then spreads to non-core areas, and then spills over to surrounding cities, and finally spreads to third- and fourth-tier cities and even counties. Many altcoins are equivalent to real estate in third- to fourth-tier cities or even counties, and they will eventually rise. The only difference lies in when it's their turn to rise.
During a decline, it's the opposite. The further out the real estate, the earlier and more severe the decline, until it reaches the core area. Just like this recent decline, altcoins fell first, and the better ones resisted the decline more. BTC, as the core of the core, is the most resistant to decline.
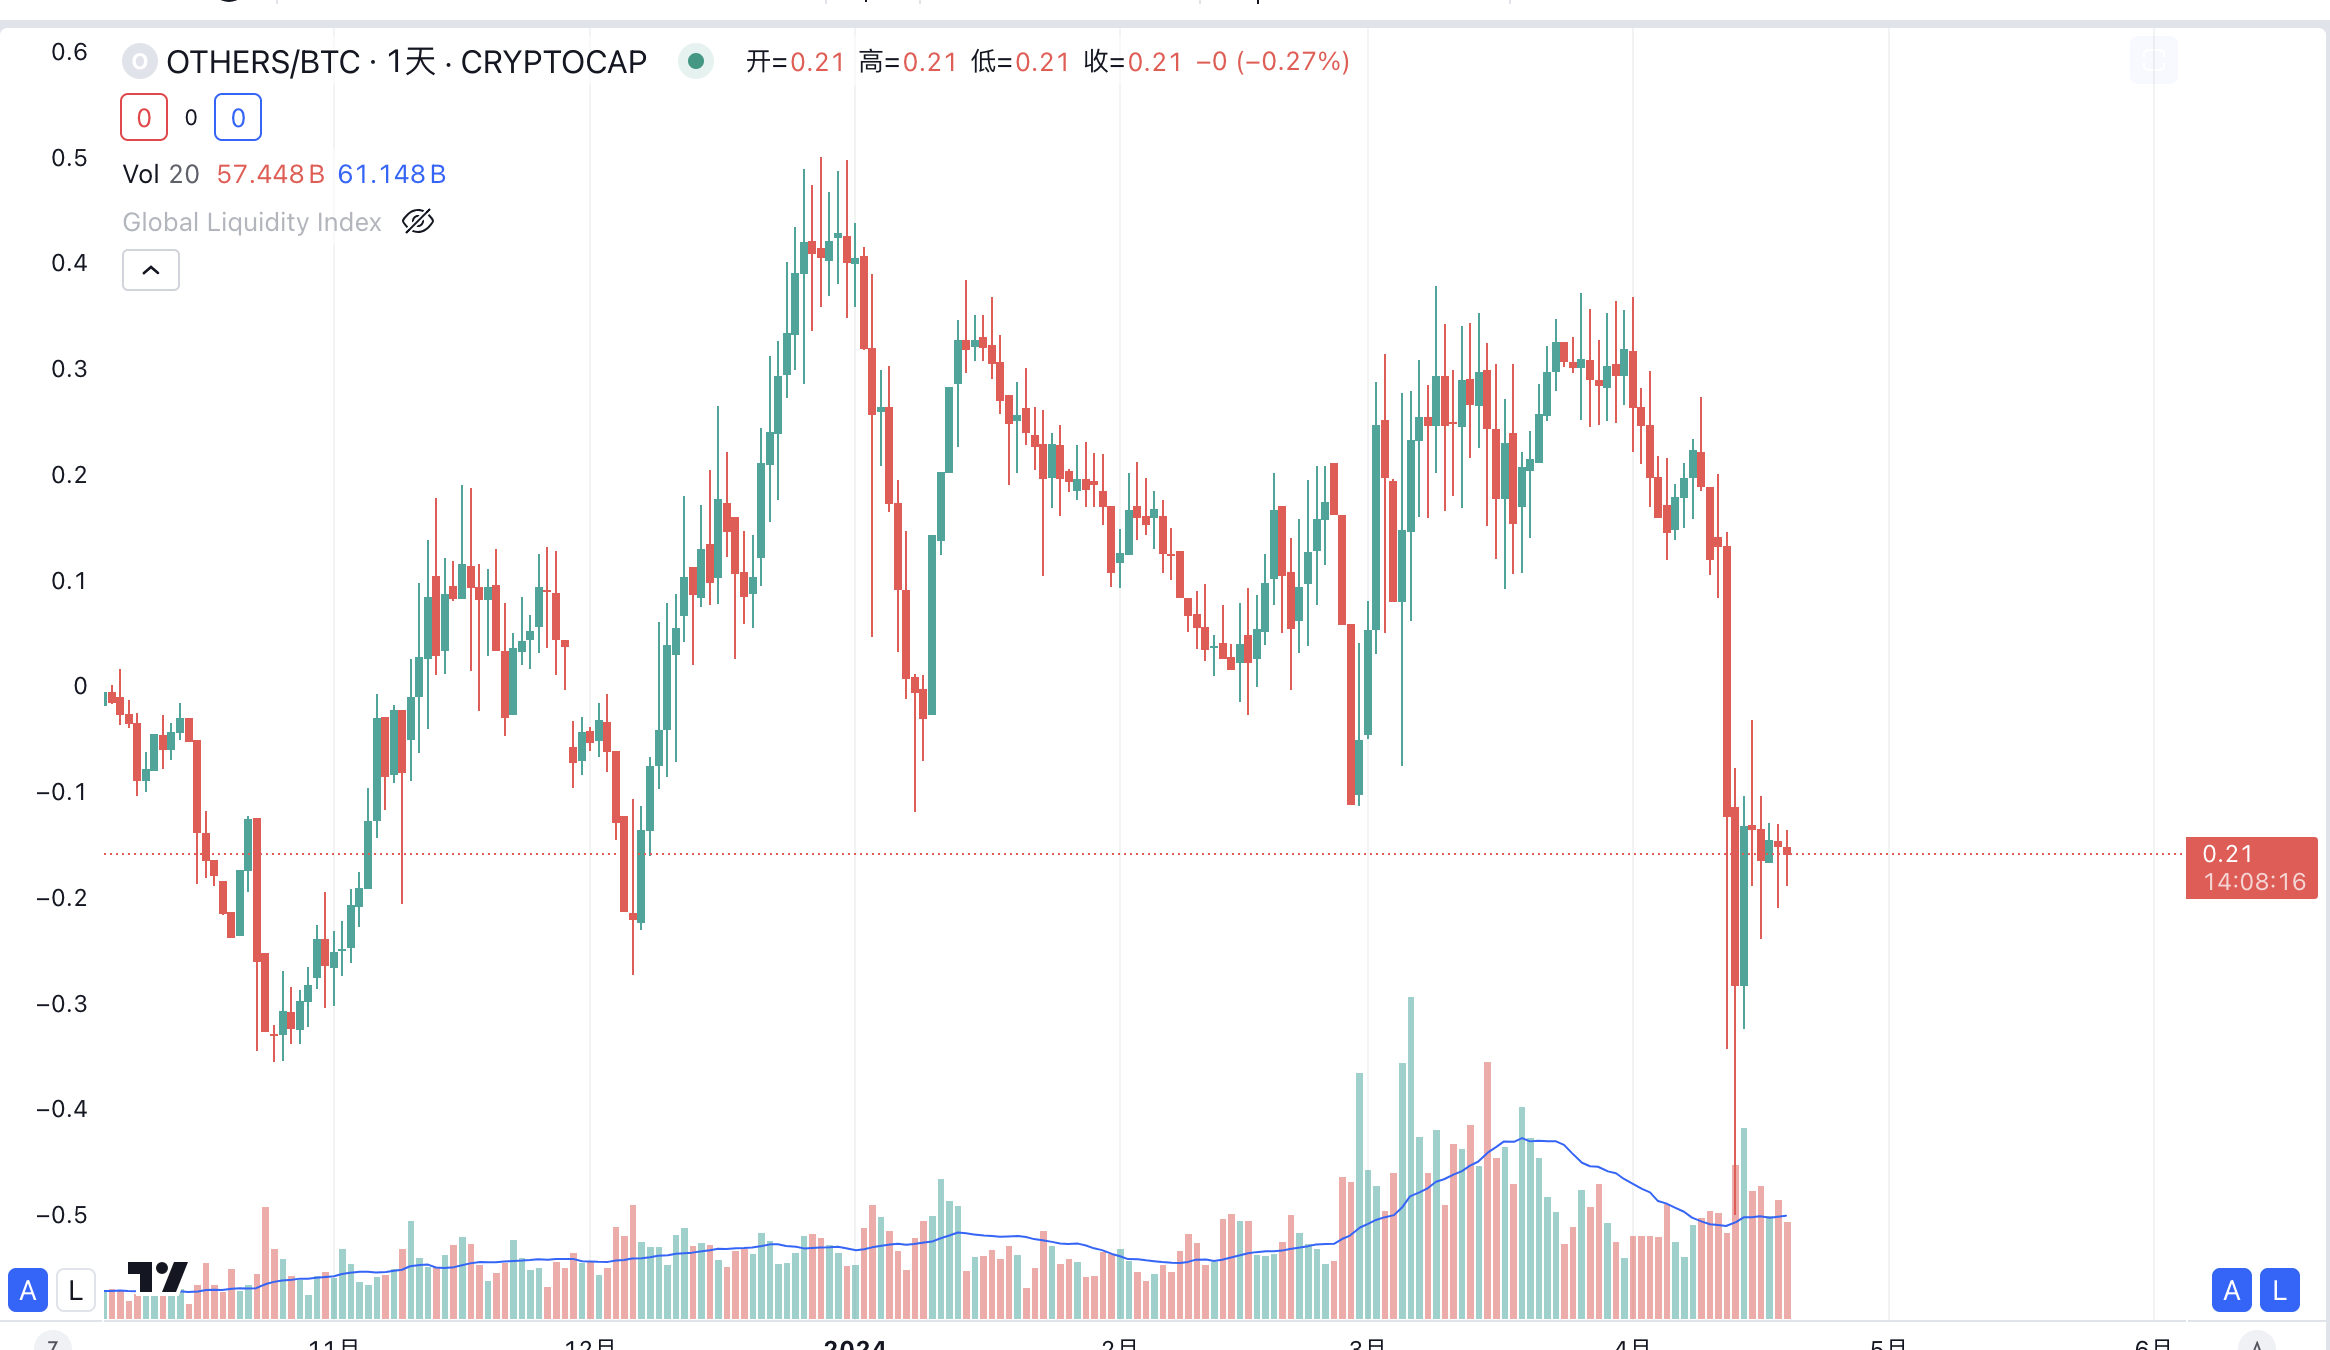
In addition, many altcoins did not fall to the low point of last weekend during the process of multiple price probes this week. Altcoins have actually fallen much less than expected. Looking at the chart, "Others" represents the market value of all coins outside the top 10. The market value ratio of Others/BTC reached its lowest point last weekend and has been relatively stable this week. When altcoins no longer fall, the pullback of the market is basically coming to an end.

Looking at the market value chart of altcoins, a triangle has appeared at the top, and according to technical analysis, the market value of altcoins has already reached the target position. The lowest point also coincides with the low point of the oscillation area in late February. Therefore, my personal view is that altcoins have reached the bottom.

Therefore, there is no need to be too pessimistic about altcoins. If you choose to hold altcoins, you must be prepared to face significant fluctuations. As long as altcoins are not leveraged, anything is possible.
Overall, I believe that around 60,000 is likely the bottom of this pullback, and as time goes on, the probability becomes higher. As long as BTC can hold, the corresponding bottom for ETH is around 2,900, and altcoins will naturally reach the bottom. If BTC can rise above 65,500, the pullback is likely to be over, and we can expect a new uptrend.
Follow me and maximize trend profits with minimal operations.

免责声明:本文章仅代表作者个人观点,不代表本平台的立场和观点。本文章仅供信息分享,不构成对任何人的任何投资建议。用户与作者之间的任何争议,与本平台无关。如网页中刊载的文章或图片涉及侵权,请提供相关的权利证明和身份证明发送邮件到support@aicoin.com,本平台相关工作人员将会进行核查。


