On the afternoon of April 18th, AICoin researchers conducted a live graphic and textual sharing in the AICoin PC-end group chat live on the topic "The Halving is Coming, Custom Indicators + Little A's Double Swords! (Membership Giveaway)." The following is a summary of the live content.
I. Concept and Function of Main Force Large Orders
1. Concept of Main Force Large Orders
Main force large orders refer to large transactions conducted in the market by large or institutional investors.
2. Function of Main Force Large Orders
Function 1: Market Price Impact
Due to their large capital size, main force large orders can significantly drive market prices up or down.
Function 2: Analysis during Critical Periods
The activity of main force large orders is particularly important before and after specific events (such as the Bitcoin halving) because they often directly influence short-term and long-term price trends.
Function 3: Historical Data Comparison
By monitoring large orders and comparing them with historical data, investors can better understand and predict long-term market fluctuations.
II. Utilizing the Underlying Logic of Main Force Large Orders
1. Motivation and Behavior
For example
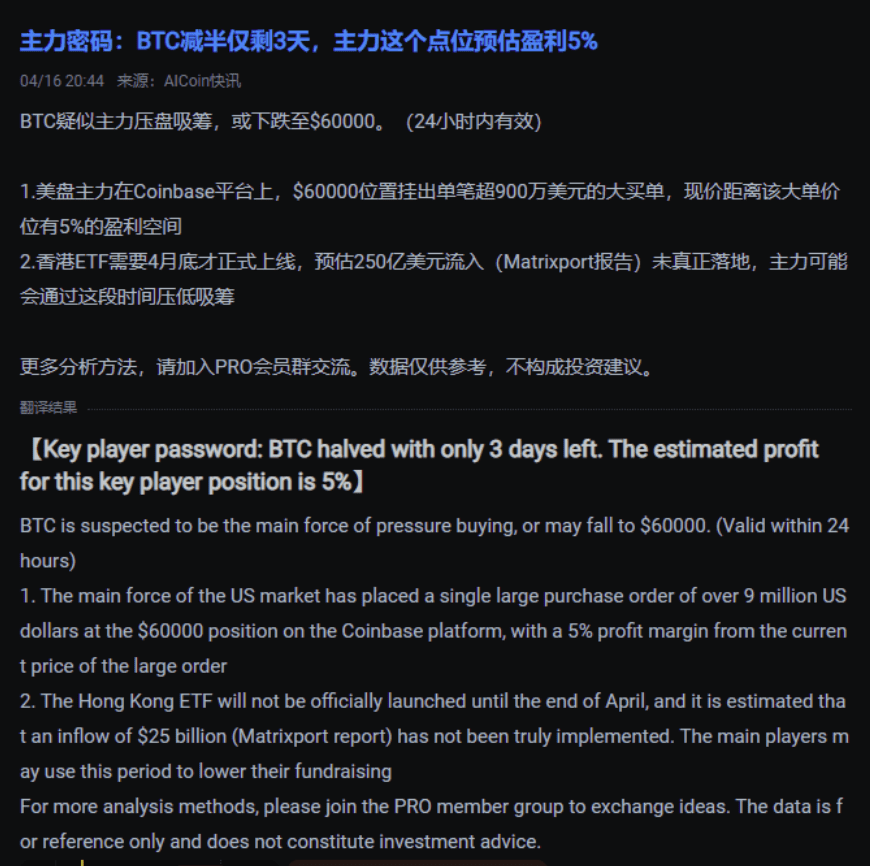
The main force placed a large buy order of over $9 million at the $60,000 level on the Coinbase platform, indicating that they saw an attractive buying opportunity at this price point.
Operational Purpose:
(1) Lowering the price to attract funds: They set a large number of buy orders at lower price levels in preparation to profit from price rebounds. For example, with the recent Bitcoin halving and the launch of the Hong Kong ETF at the end of the month, the main force may accumulate funds by pressing the market, anticipating future market increases due to a large influx of funds.
(2) Psychological Impact: The existence of large buy orders sends a signal to market participants that $60,000 is a support level, causing other investors to be inclined to buy near this price, thus forming a self-fulfilling prediction.
In summary, the strategic placement of large buy orders, market psychological manipulation, and the use of market dynamics related to the halving all indicate that the main force is bottom fishing!
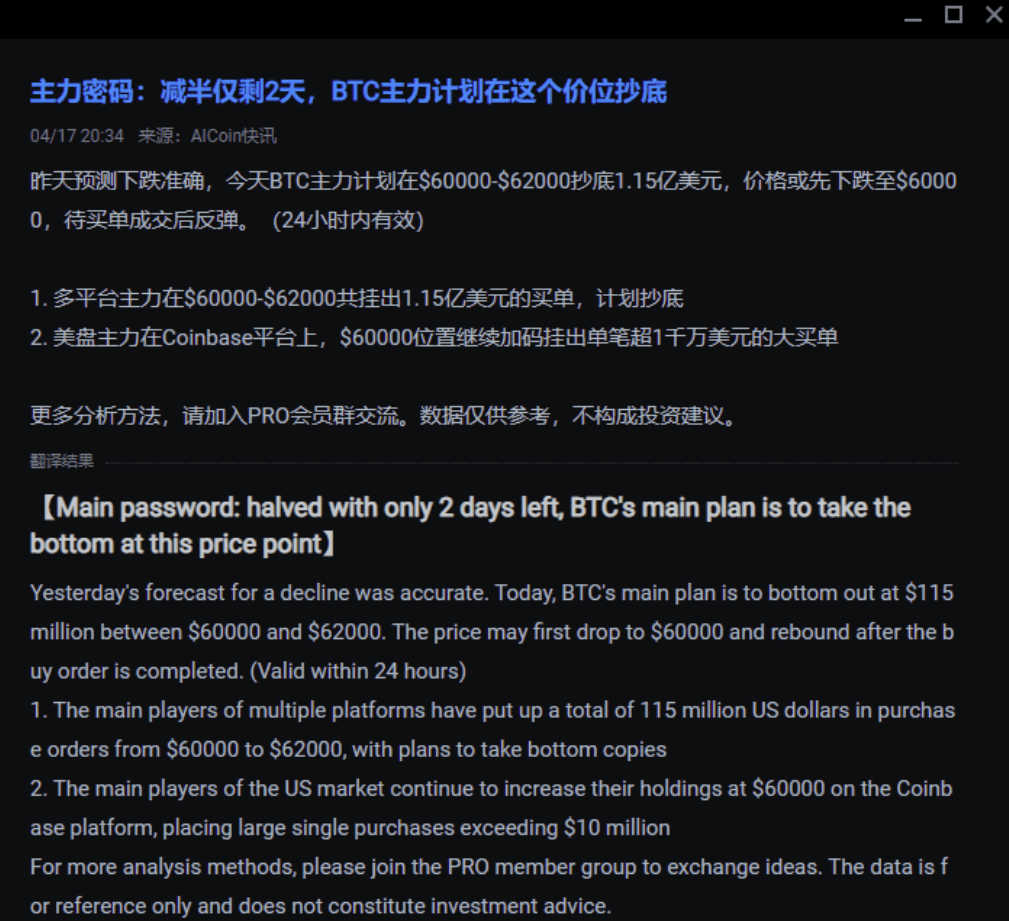
Sure enough, the next day's news confirmed that the main force was bottom fishing! The downward prediction was accurate.
2. Setting Main Force Large Orders
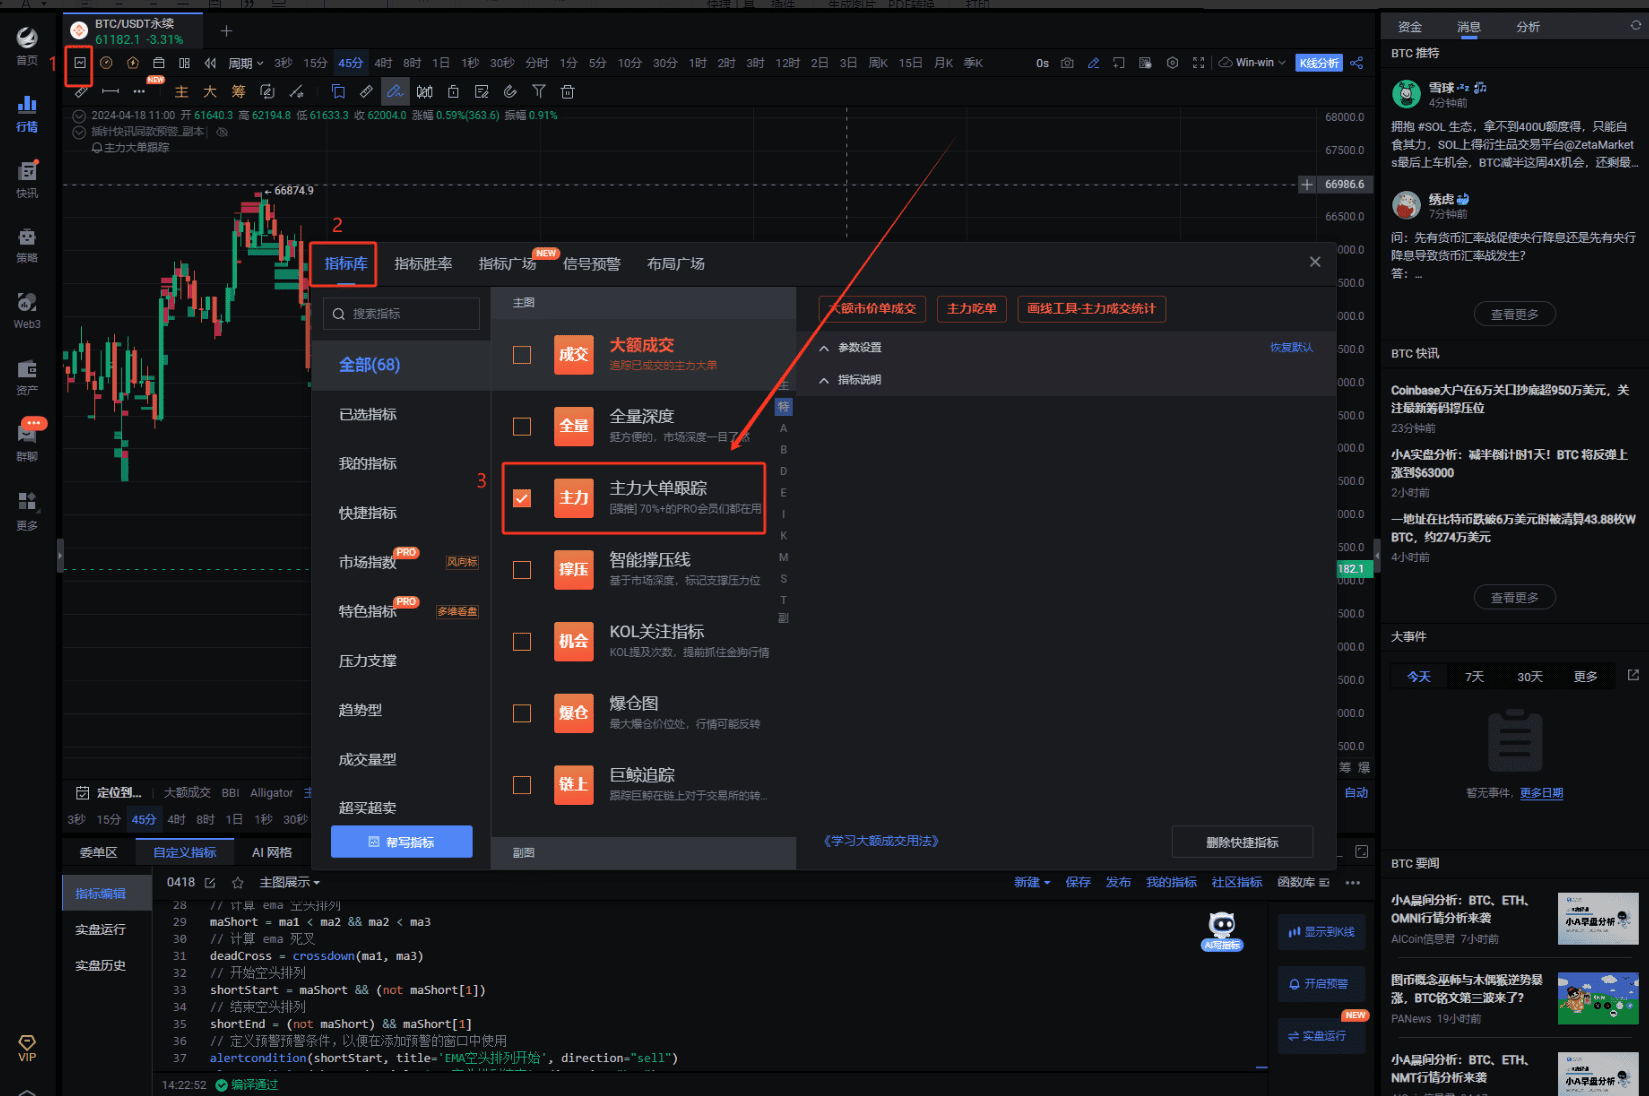
Follow the steps in the image below
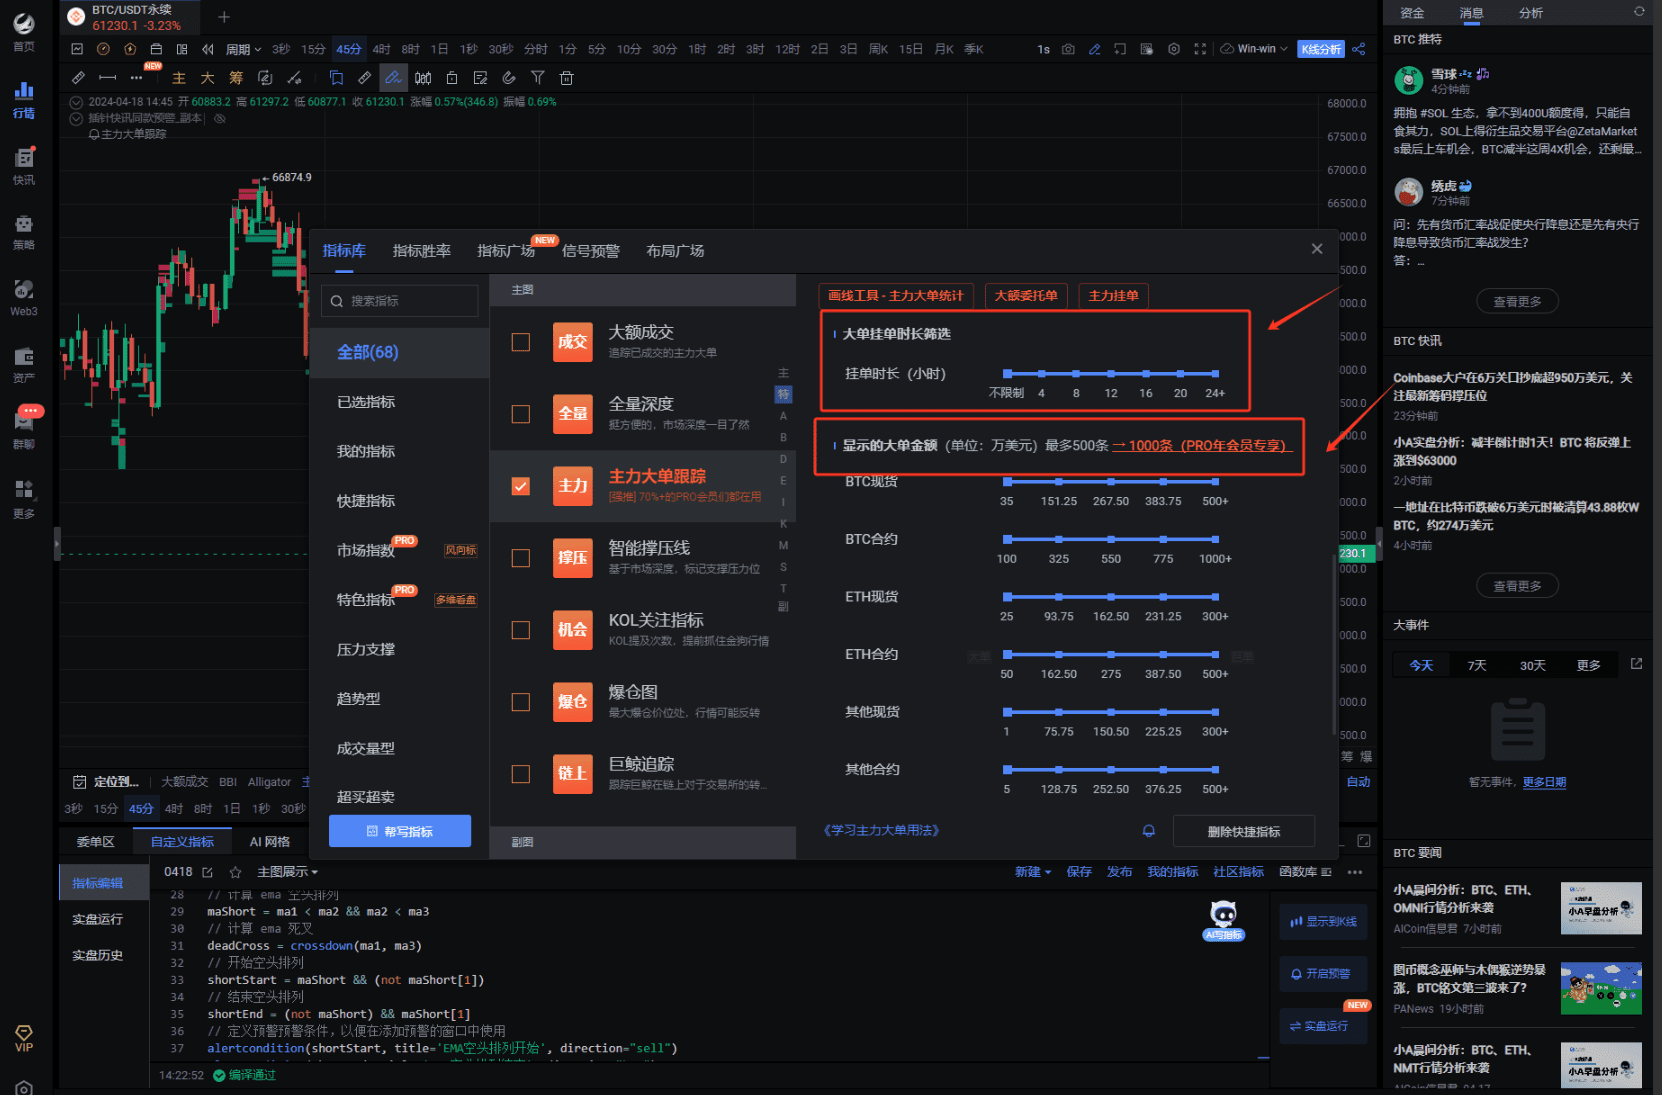
You can also customize the order duration and large order amount, which is super convenient.
III. Custom Indicators
1. Concept and Importance of Custom Indicators
What are custom indicators? Imagine having a trading tool, like a custom-made tailored suit, perfectly tailored to your trading style!
That's the charm of custom indicators. It's not the kind of one-size-fits-all ordinary tool, but rather tailored to your personal trading strategy needs, perfectly reflecting your thinking without adding any impurities.
2. Using Custom Indicators for Trading Decisions
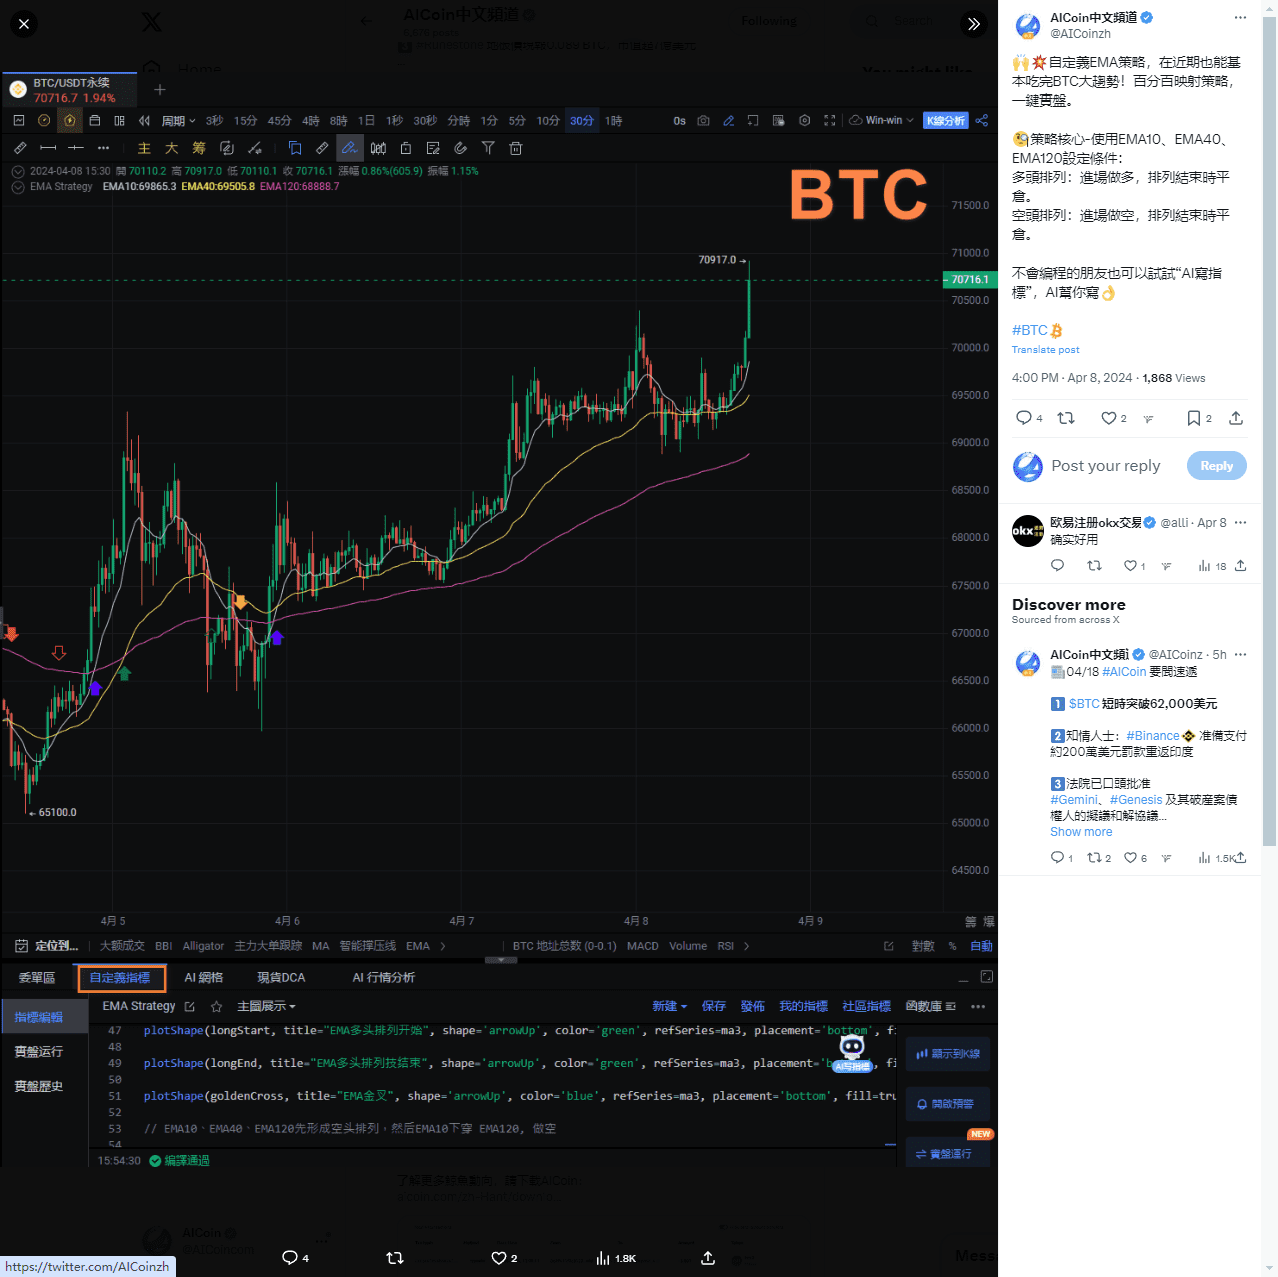
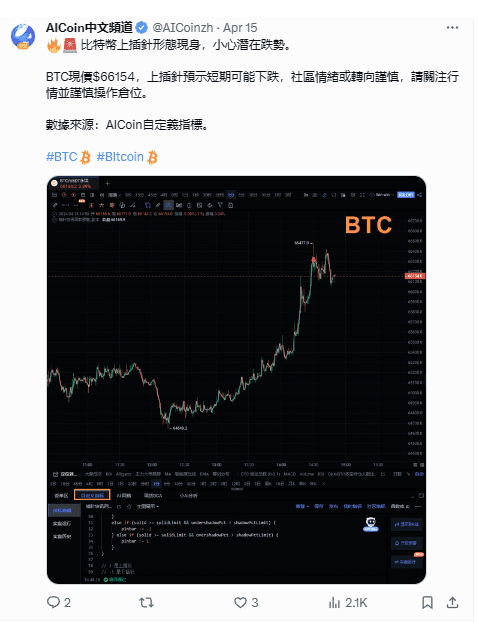
First, take a look at a practical case, a tweet of an EMA strategy, which is a strategy written using custom indicators.
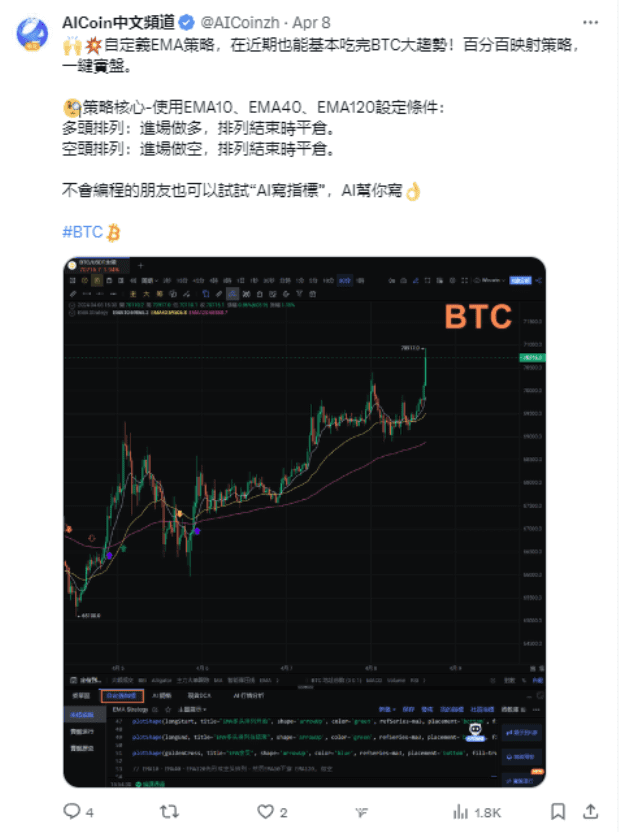
Below is a post published 10 days ago, and after time verification, this custom strategy is equally applicable today!
3. Full Code
// @version=2
// Code Example
// EMA10, EMA40, EMA120 first form a bullish arrangement, then EMA10 crosses above EMA120, go long
ma1 = ema(close, 10)
ma2 = ema(close, 40)
ma3 = ema(close, 120)
// Calculate EMA bullish arrangement
maLong = ma1 > ma2 && ma2 > ma3
// Calculate EMA golden cross
goldenCross = crossup(ma1, ma3)
// Start bullish arrangement
longStart = maLong && (not maLong[1])
// End bullish arrangement
longEnd = (not maLong) && maLong[1]
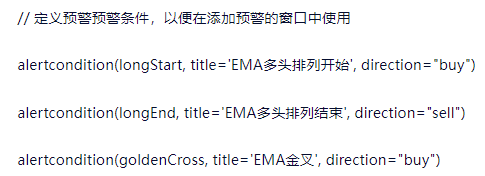
// Define alert conditions for use in the alert window
alertcondition(longStart, title='EMA Bullish Arrangement Start', direction="buy")
alertcondition(longEnd, title='EMA Bullish Arrangement End', direction="sell")
alertcondition(goldenCross, title='EMA Golden Cross', direction="buy")
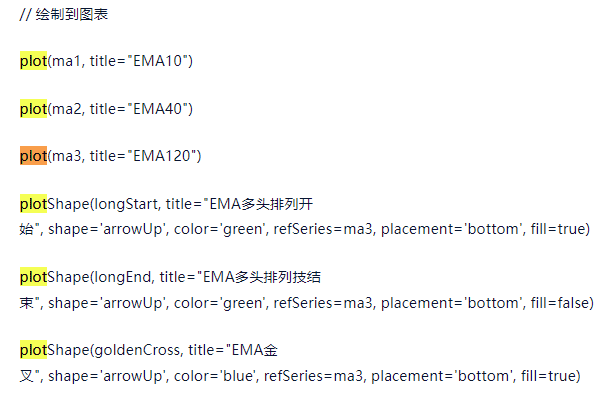
// Plot on chart
plot(ma1, title="EMA10")
plot(ma2, title="EMA40")
plot(ma3, title="EMA120")
plotShape(longStart, title="EMA Bullish Arrangement Start", shape='arrowUp', color='green', refSeries=ma3, placement='bottom', fill=true)
plotShape(longEnd, title="EMA Bullish Arrangement End", shape='arrowUp', color='green', refSeries=ma3, placement='bottom', fill=false)
plotShape(goldenCross, title="EMA Golden Cross", shape='arrowUp', color='blue', refSeries=ma3, placement='bottom', fill=true)
// EMA10, EMA40, EMA120 first form a bearish arrangement, then EMA10 crosses below EMA120, go short
// Calculate EMA bearish arrangement
maShort = ma1 < ma2 && ma2 < ma3
// Calculate EMA death cross
deadCross = crossdown(ma1, ma3)
// Start bearish arrangement
shortStart = maShort && (not maShort[1])
// End bearish arrangement
shortEnd = (not maShort) && maShort[1]
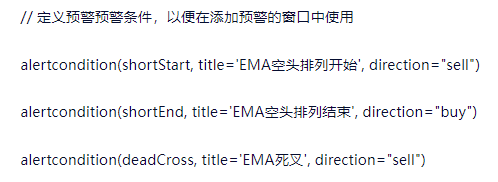
// Define alert conditions for use in the alert window
alertcondition(shortStart, title='EMA Bearish Arrangement Start', direction="sell")
alertcondition(shortEnd, title='EMA Bearish Arrangement End', direction="buy")
alertcondition(deadCross, title='EMA Death Cross', direction="sell")
// Plot on chart
plotShape(shortStart, title="EMA Bearish Arrangement Start", shape='arrowDown', color='red', refSeries=ma3, placement='top', fill=true)
plotShape(shortEnd, title="EMA Bearish Arrangement End", shape='arrowDown', color='red', refSeries=ma3, placement='top', fill=false)
plotShape(deadCross, title="EMA Death Cross", shape='arrowDown', color='Orange', refSeries=ma3, placement='top', fill=true)
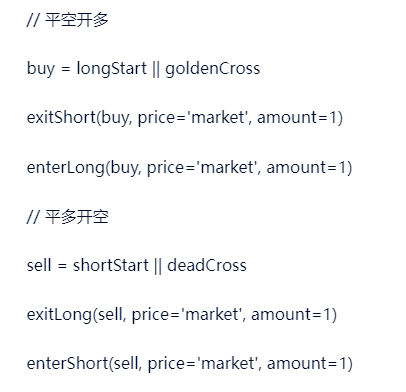
// Close short and open long
buy = longStart || goldenCross
exitShort(buy, price='market', amount=1)
enterLong(buy, price='market', amount=1)
// Close long and open short
sell = shortStart || deadCross
exitLong(sell, price='market', amount=1)
enterShort(sell, price='market', amount=1)
The code segment is used for a trading strategy based on three Exponential Moving Average (EMA) lines. It involves dynamically monitoring EMA values and relative position changes to determine and execute trading operations, including opening and closing logic.
(1) Definition of EMA lines
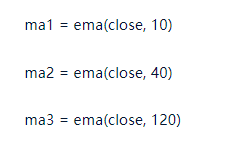
These three lines are used to identify bullish or bearish arrangements and to determine golden or death cross signals.
(2) EMA Signal Logic
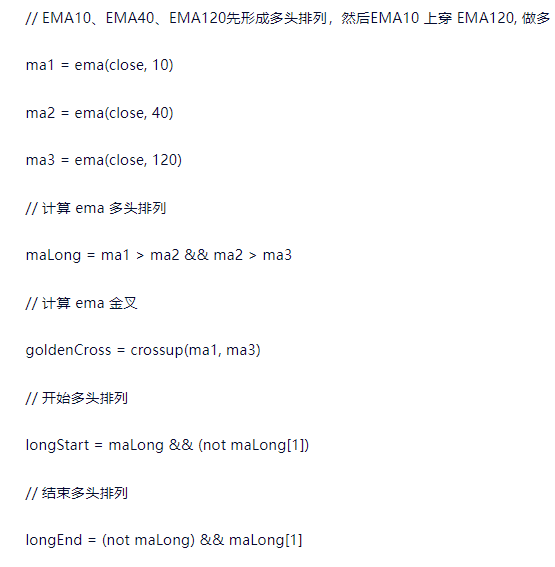
It can be summarized as follows:
1) Bullish arrangement judgment (maLong):
a. When ma1 > ma2 and ma2 > ma3, a bullish arrangement is formed.
2) Golden cross judgment (goldenCross):
a. When ma1 crosses above ma3, a golden cross is formed.
3) Bearish arrangement judgment (maShort):
a. When ma1 < ma2 and ma2 < ma3, a bearish arrangement is formed.
4) Death cross judgment (deadCross):
a. When ma1 crosses below ma3, a death cross is formed.
(3) Opening and closing logic
1) Open long logic (buy):
a. Bullish arrangement starts (longStart) or golden cross occurs (goldenCross)
2) Open short logic (sell):
a. Bearish arrangement starts (shortStart) or death cross occurs (deadCross)
3) Close long and close short
a. Automatically executed based on opposite signals, for example, close long when a bearish arrangement or death cross occurs, and close short when a bullish arrangement or golden cross occurs.
(4) Signal display
Use the plot and plotShape functions to draw EMA lines and trading signal markers on the chart for intuitive display of strategy trigger points.
In summary, the complete EMA strategy specific code can achieve indicator monitoring + alerts + automated trading. This code implements a dynamic trading strategy based on EMA, capturing detailed changes in the arrangement of EMA lines and their intersections, supplemented by graphical display, to provide users with clear trading execution signals.
This strategy is suitable for application in highly volatile markets, and the choice of EMAs (10, 40, 120) can be adjusted according to individual trading needs.
In addition to this custom indicator strategy, pin insertion and volume monitoring alerts are also very useful.
(4) AI-assisted indicator writing ```
Click on the little robot to provide specific directions to AI: indicators + alerts + automated trading, let AI help write indicators. You can also run live trading in the indicator editor to achieve rapid automated trading!
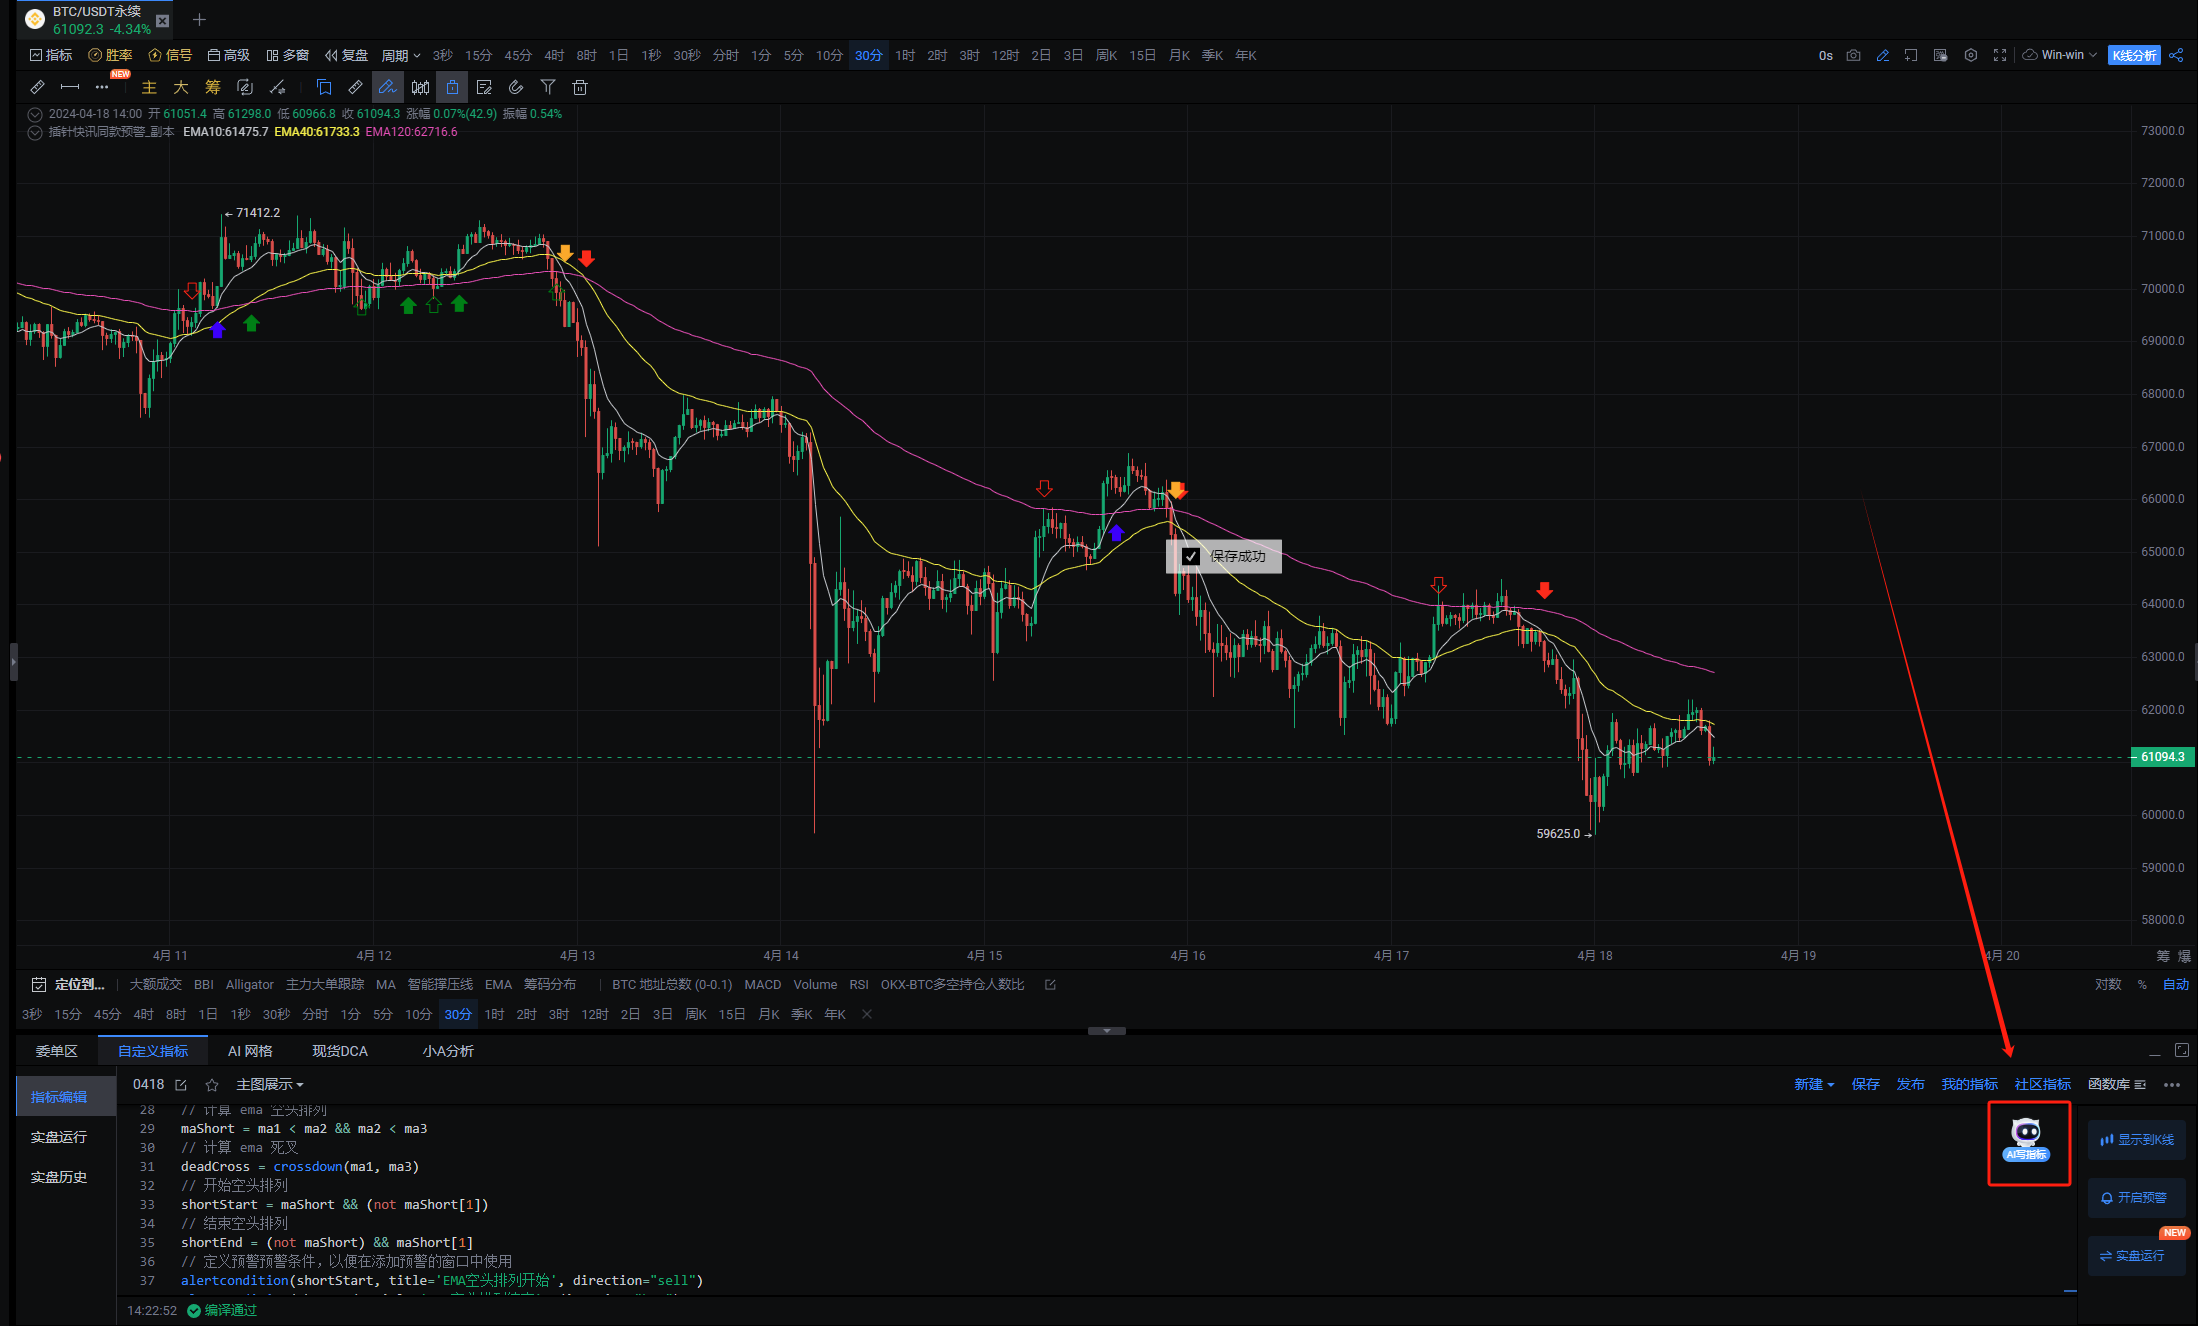
AI writing indicators has recently been offering free activities to help everyone write indicators. Hurry up and participate in the activity to claim your rewards!

IV. Little A Analysis
1. Concept and Importance of Little A Analysis
Little A Analysis is a revolutionary artificial intelligence tool that helps us interpret candlestick charts. Little A Analysis uses machine learning algorithms to identify chart patterns, predict market trends, and provide support for our trading decisions.
With AI-based analysis, the advantages are prominent: compared to traditional analysis tools, Little A Analysis can process large amounts of data faster and more accurately, discovering patterns that human analysts may overlook.
2. Application in Actual Trading
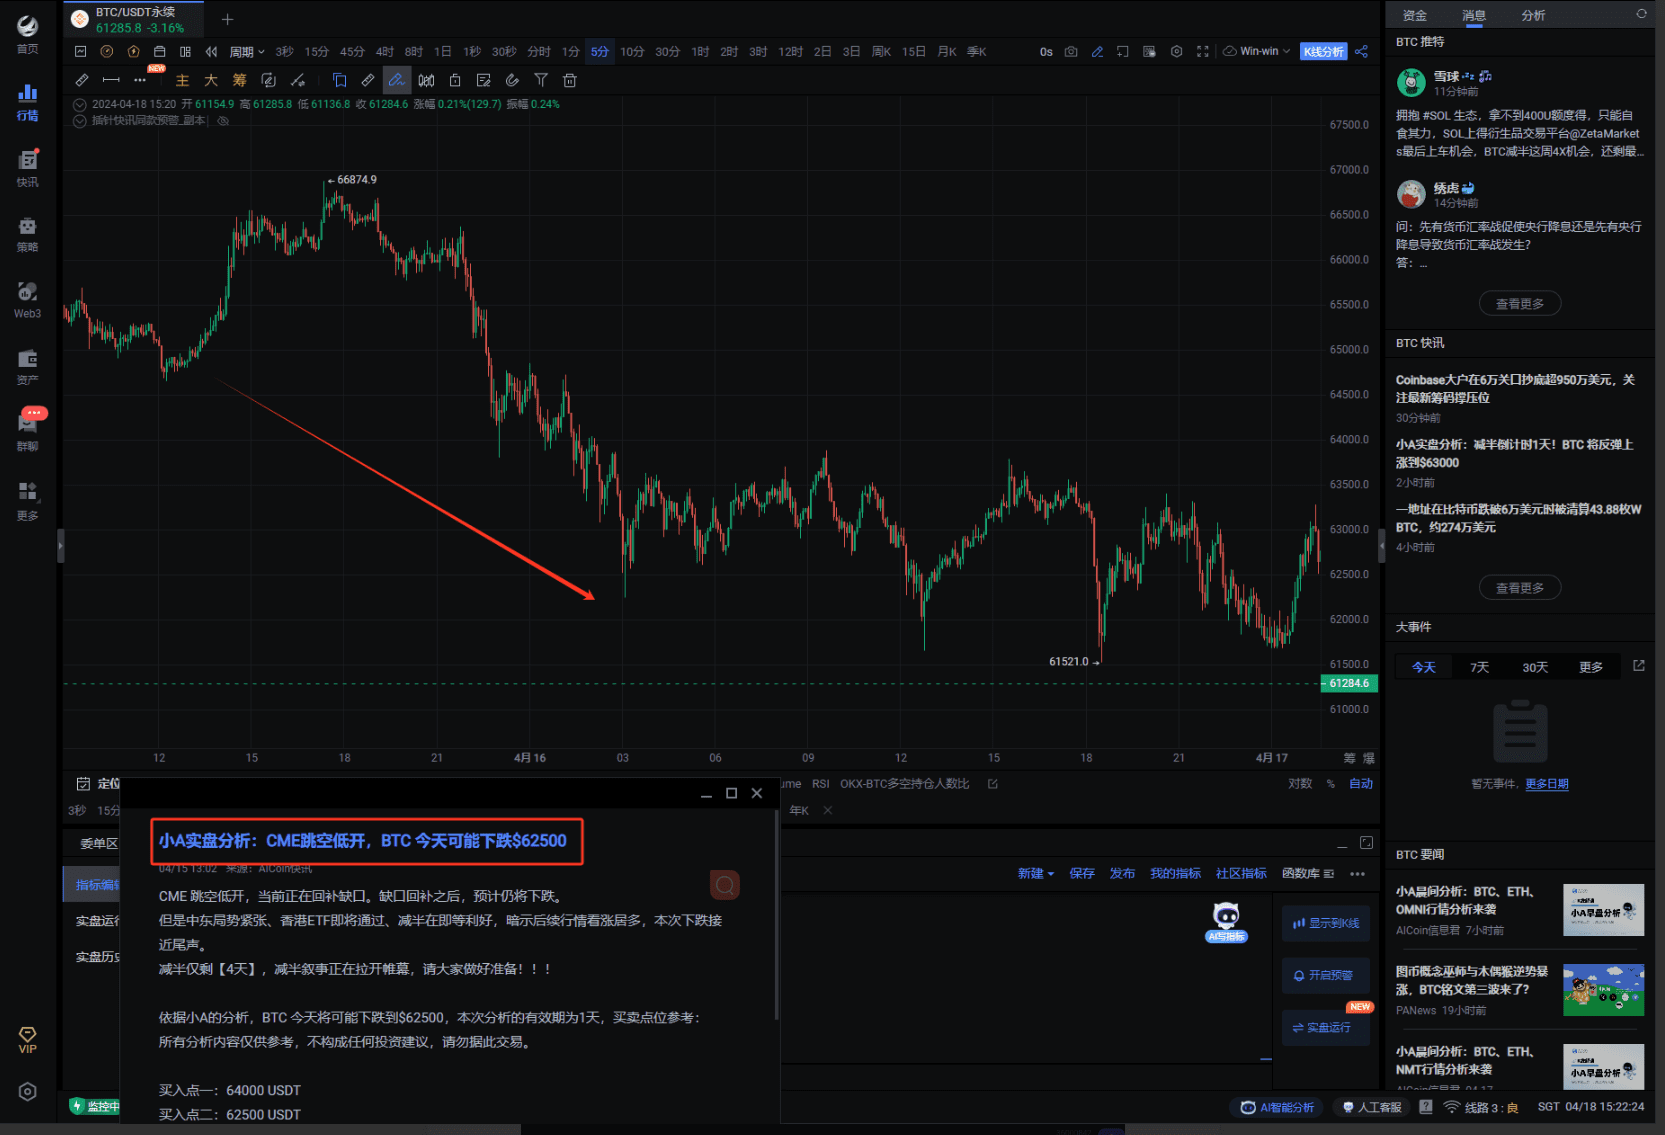
(1) Little A Flash Alerts Timely Remind Market Trends
A few days ago, CME opened with a gap down, and Little A predicted that BTC would fall to $62500. Did everyone receive this flash alert? Did you catch this wave?
In addition to providing guidance on positions, Little A also objectively evaluates and analyzes timely news for reference, supplementing some information that users may usually overlook, providing users with a comprehensive information balance. From CME gaps, Middle East tensions, to halving market expectations, Little A has thought of everything.
Little A is really reassuring, like a personal assistant, when you're too busy, hire a Little A.
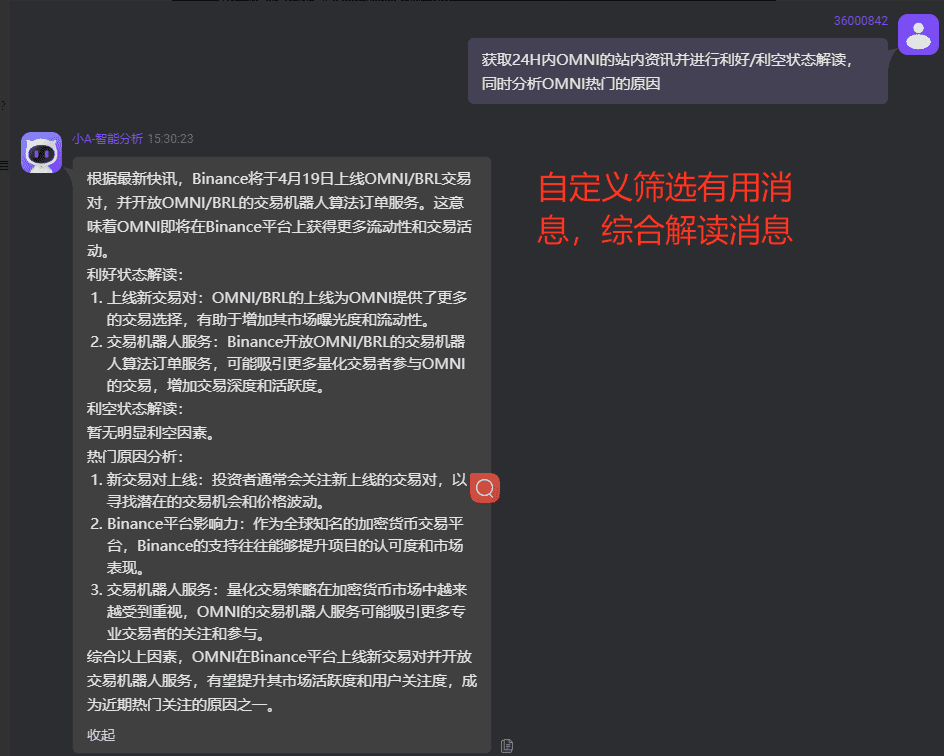
(2) One-stop Capture of Trading Opportunities, Quickly Capture Trading Data and Latest Flash Alerts for Coins that Meet Trading Strategies and Desired Coins
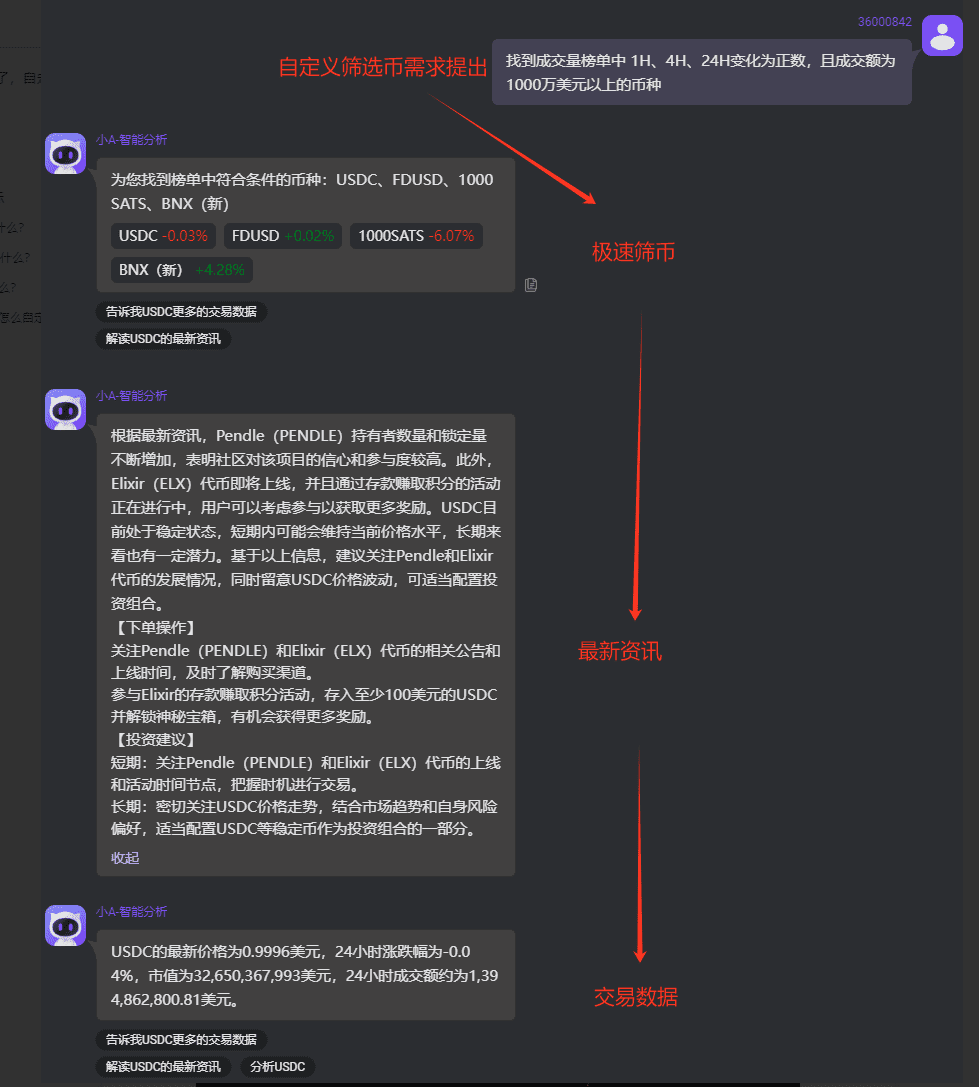
Information interpretation: The feature is speed.
In conclusion, when integrating custom indicators, main force large orders, and Little A analysis tools into your trading strategy, remember that no tool is 100% accurate. Therefore, the best practice is to use a variety of indicators and always maintain risk management measures.
AI writing indicators can meet many conditions, as long as you provide your ideas to AI; our AI tools and custom indicator tools will provide more support to members; if you are interested in AI writing indicators and want to build your own trading strategy, feel free to open Signal Alerts/PRO K-line/Indicator Win Rate, any of the three memberships can be experienced for free for a limited time. Click the link below to open and experience: https://aicoin.app/en/vip/chartpro
Recommended Reading
For more live content, please follow the AICoin "News/Information - Live Review" section, and feel free to download AICoin PC version
免责声明:本文章仅代表作者个人观点,不代表本平台的立场和观点。本文章仅供信息分享,不构成对任何人的任何投资建议。用户与作者之间的任何争议,与本平台无关。如网页中刊载的文章或图片涉及侵权,请提供相关的权利证明和身份证明发送邮件到support@aicoin.com,本平台相关工作人员将会进行核查。


