On the evening of April 16th, AICoin researchers conducted a live graphic and textual sharing of the "Super Band Tracking Strategy (with Membership)" in the AICoin PC-end Group Chat Live. Below is a summary of the live content.
I. Application Effect
1. Usage Scenarios
This strategy, called the "Super Band Tracking System," is particularly effective in identifying trends, especially in band operations.
2. Usage Tips
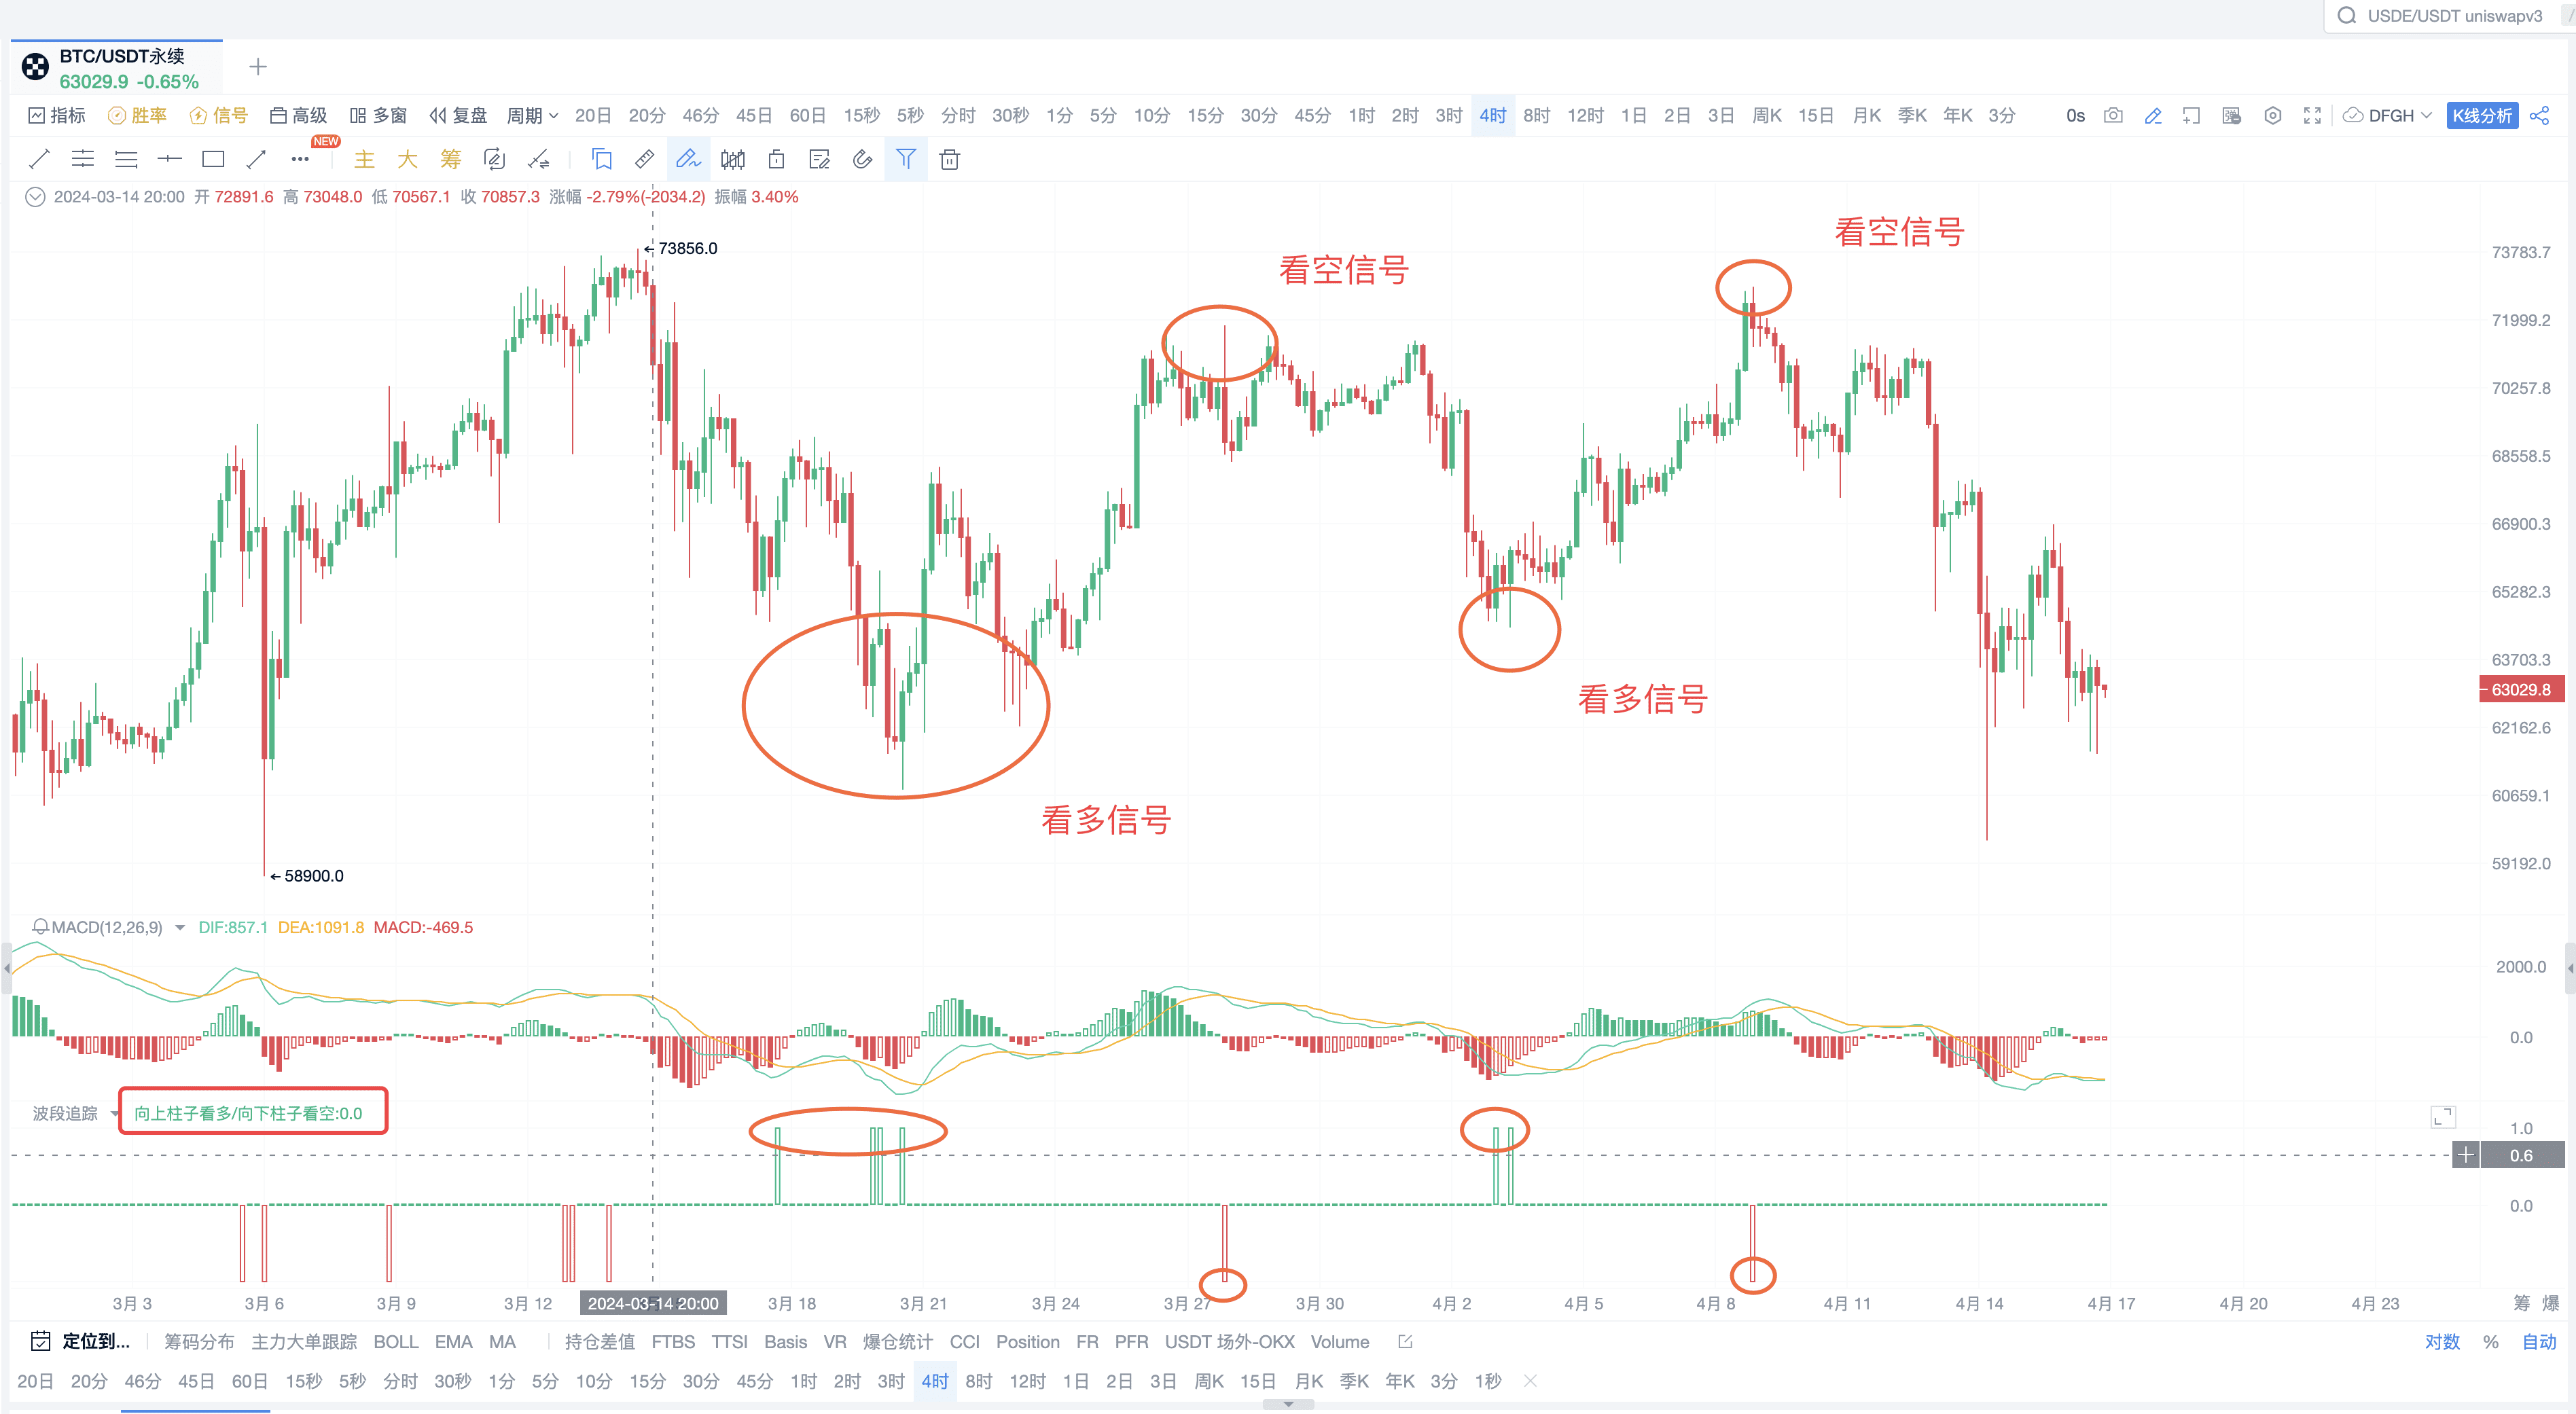
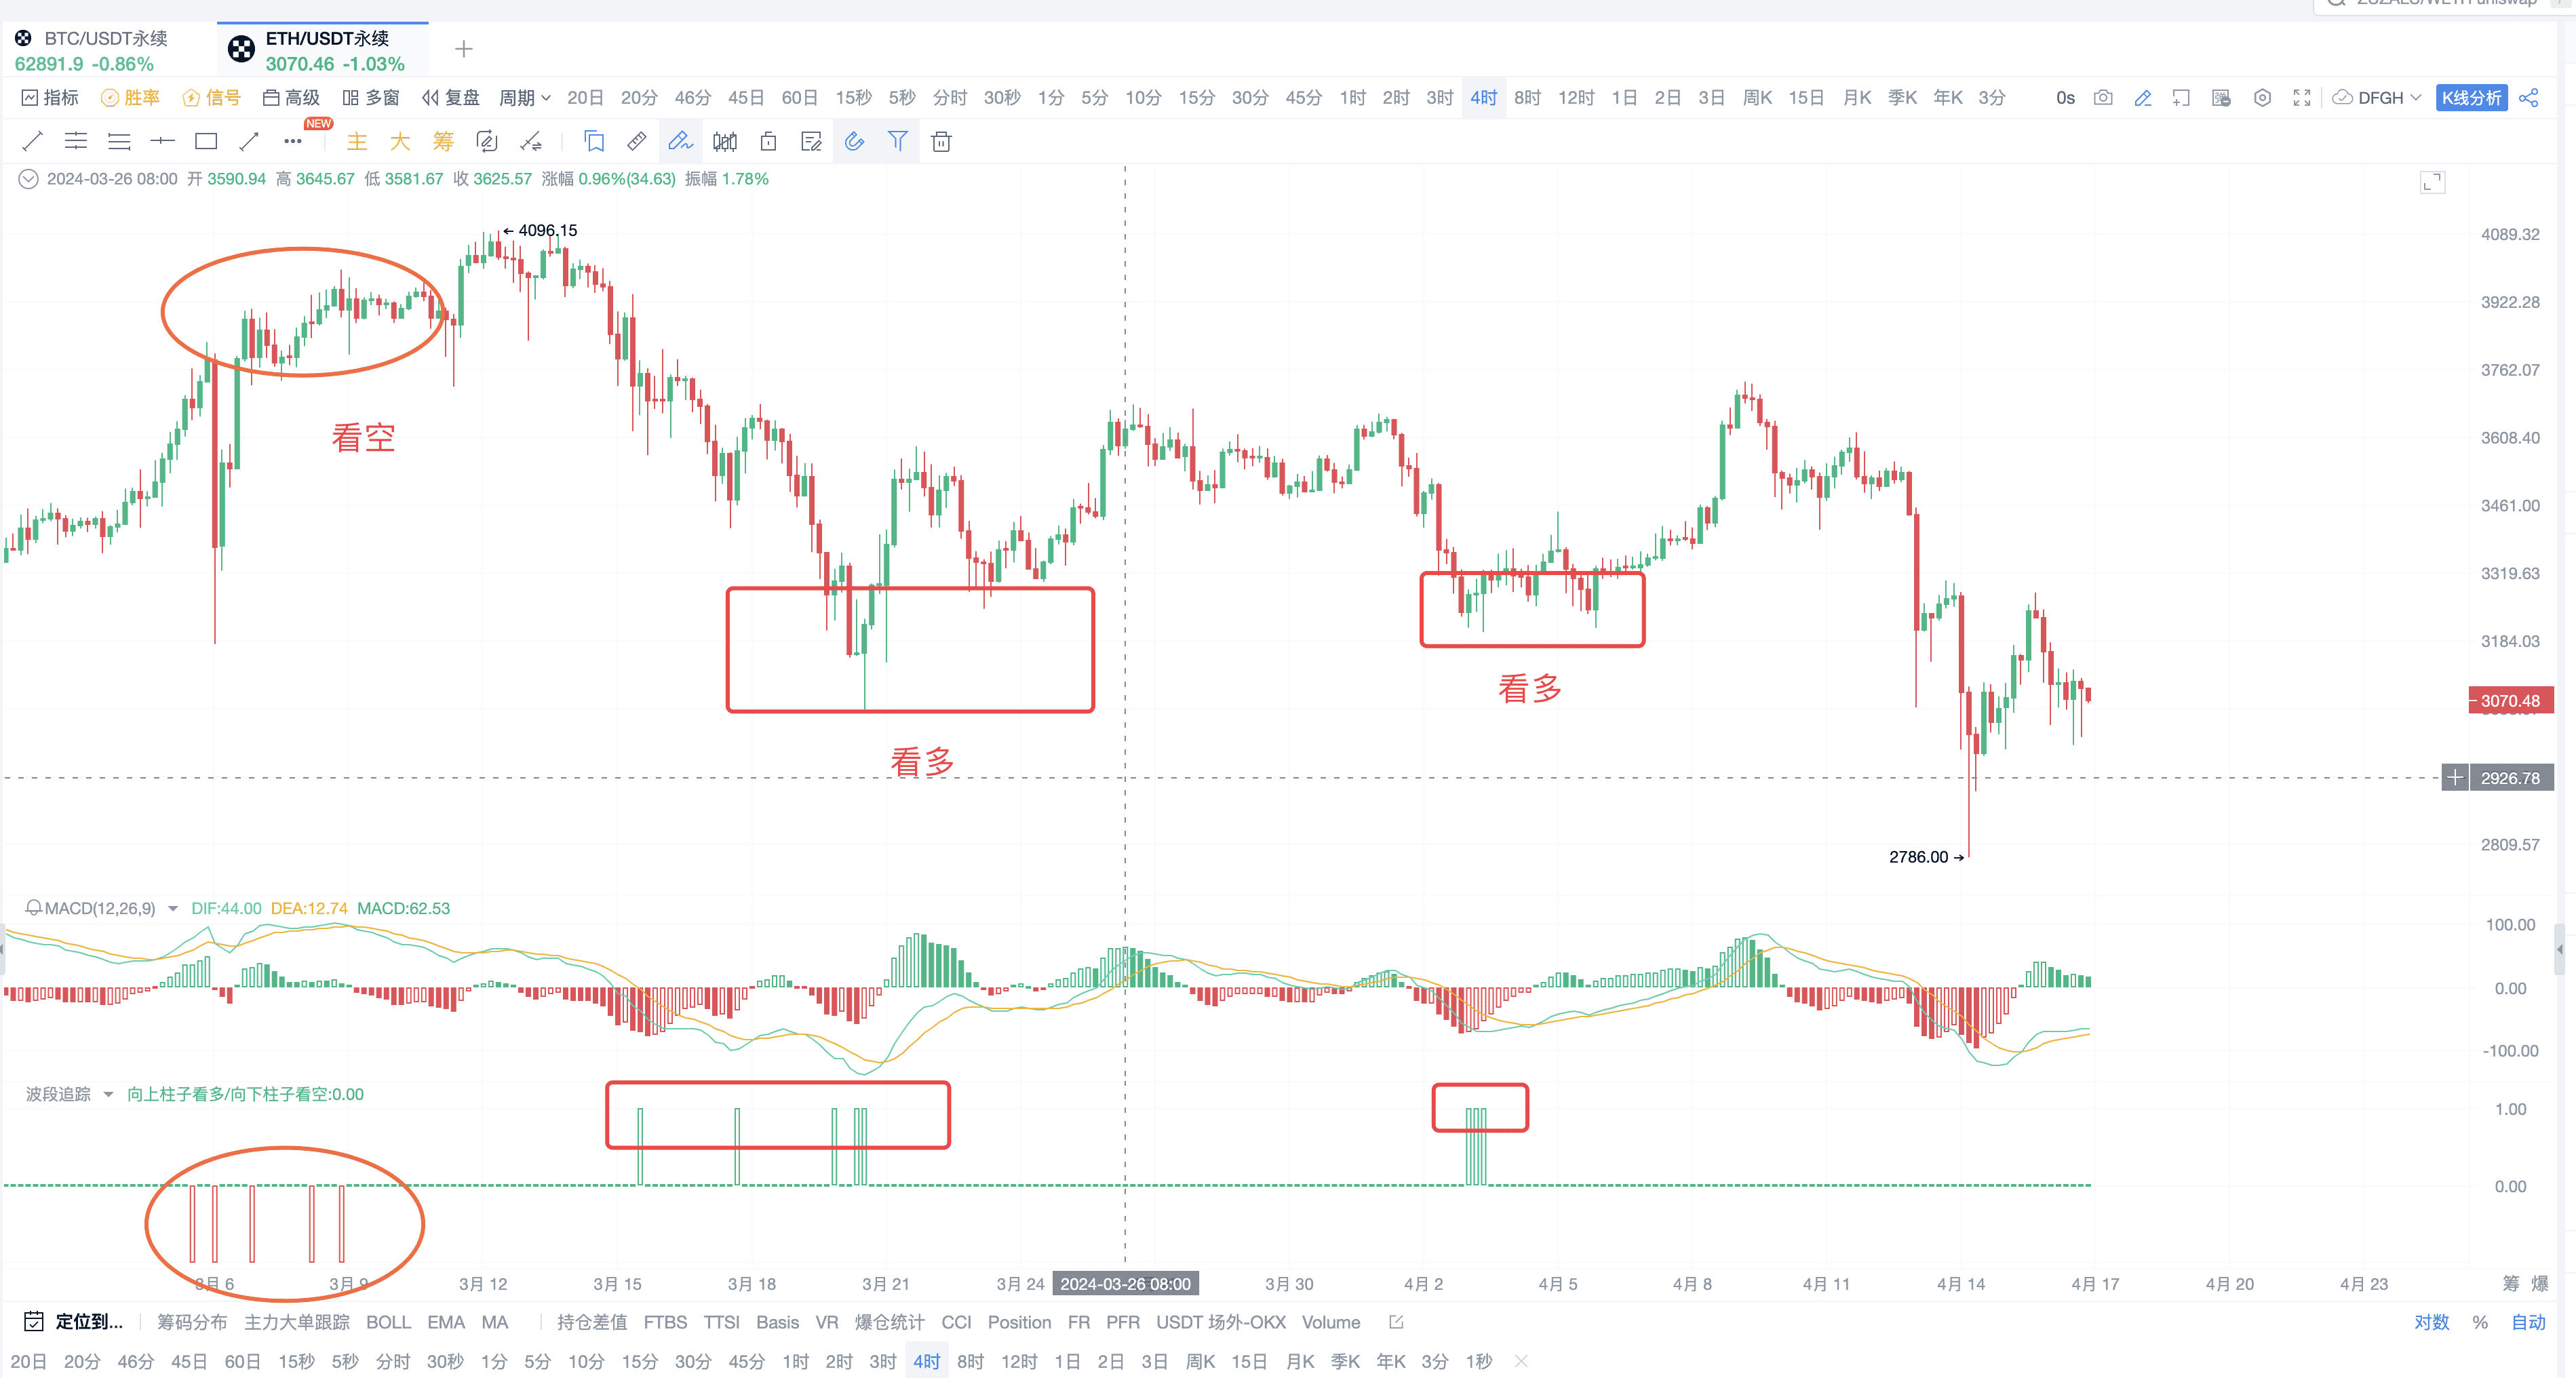
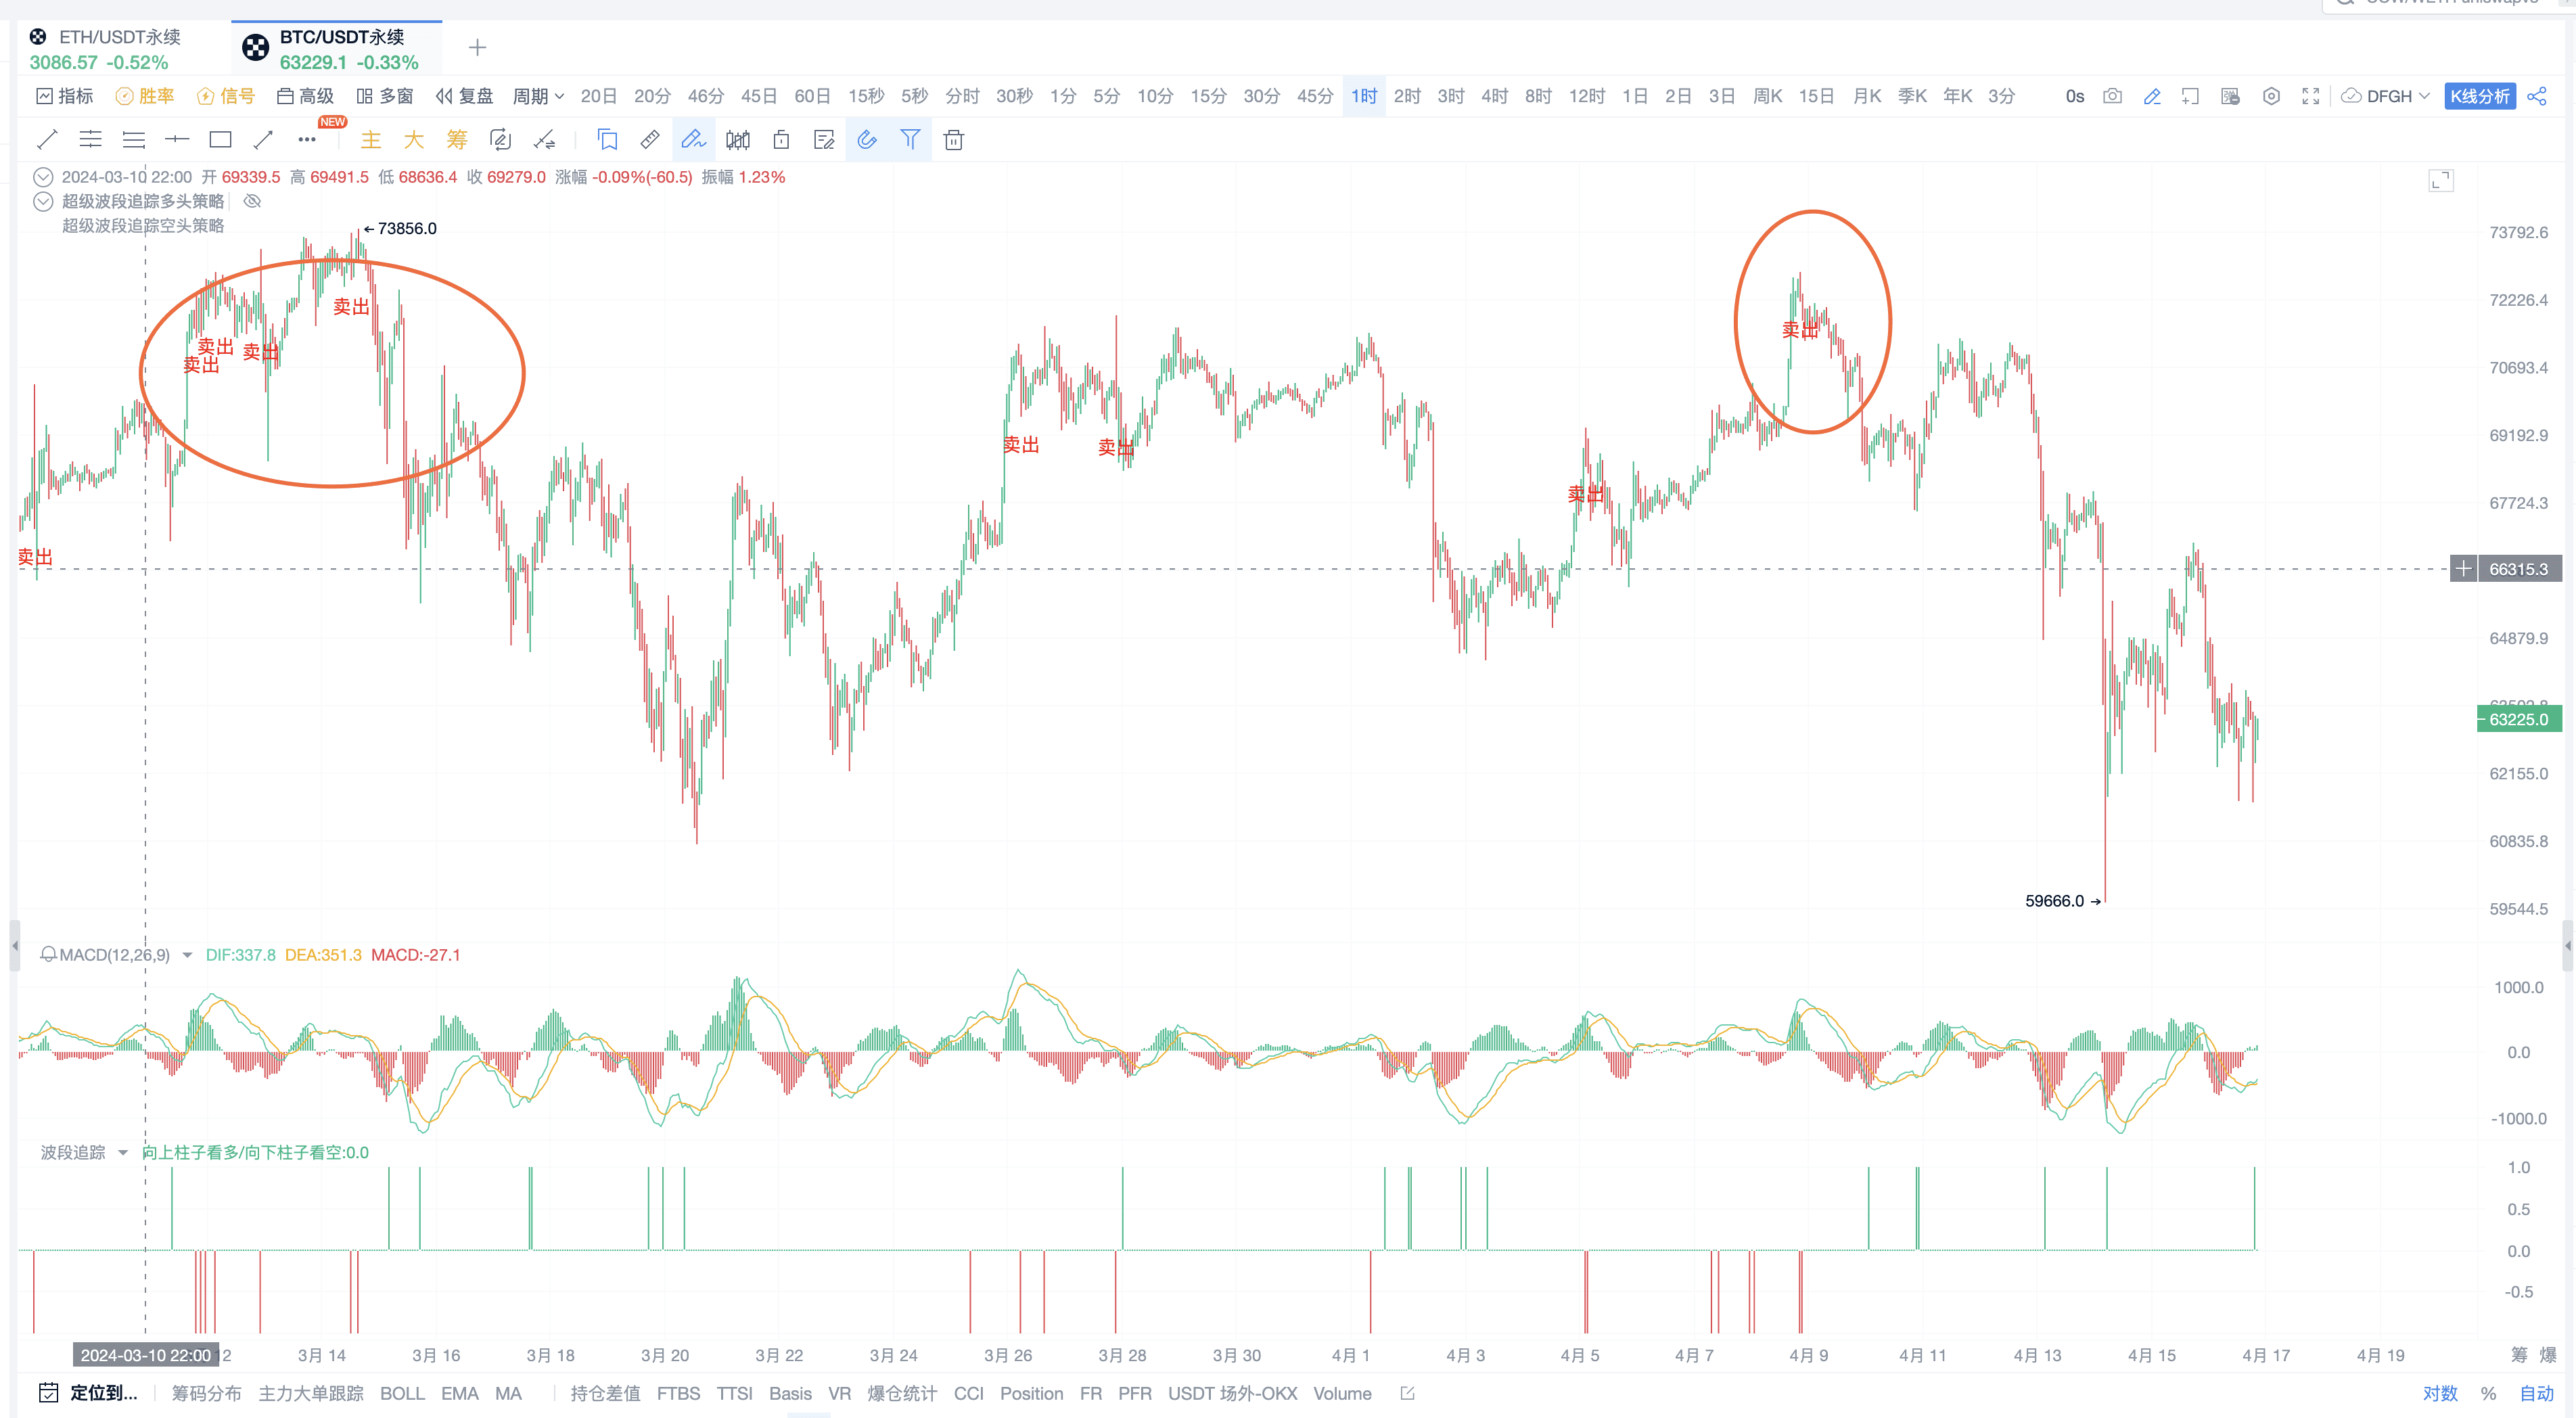
Signal Characteristics: If the column is downward, it indicates a bearish view, and if the column is upward, it indicates a bullish view. The following image shows the performance under BTC.
ETH:
II. Subscription Operation
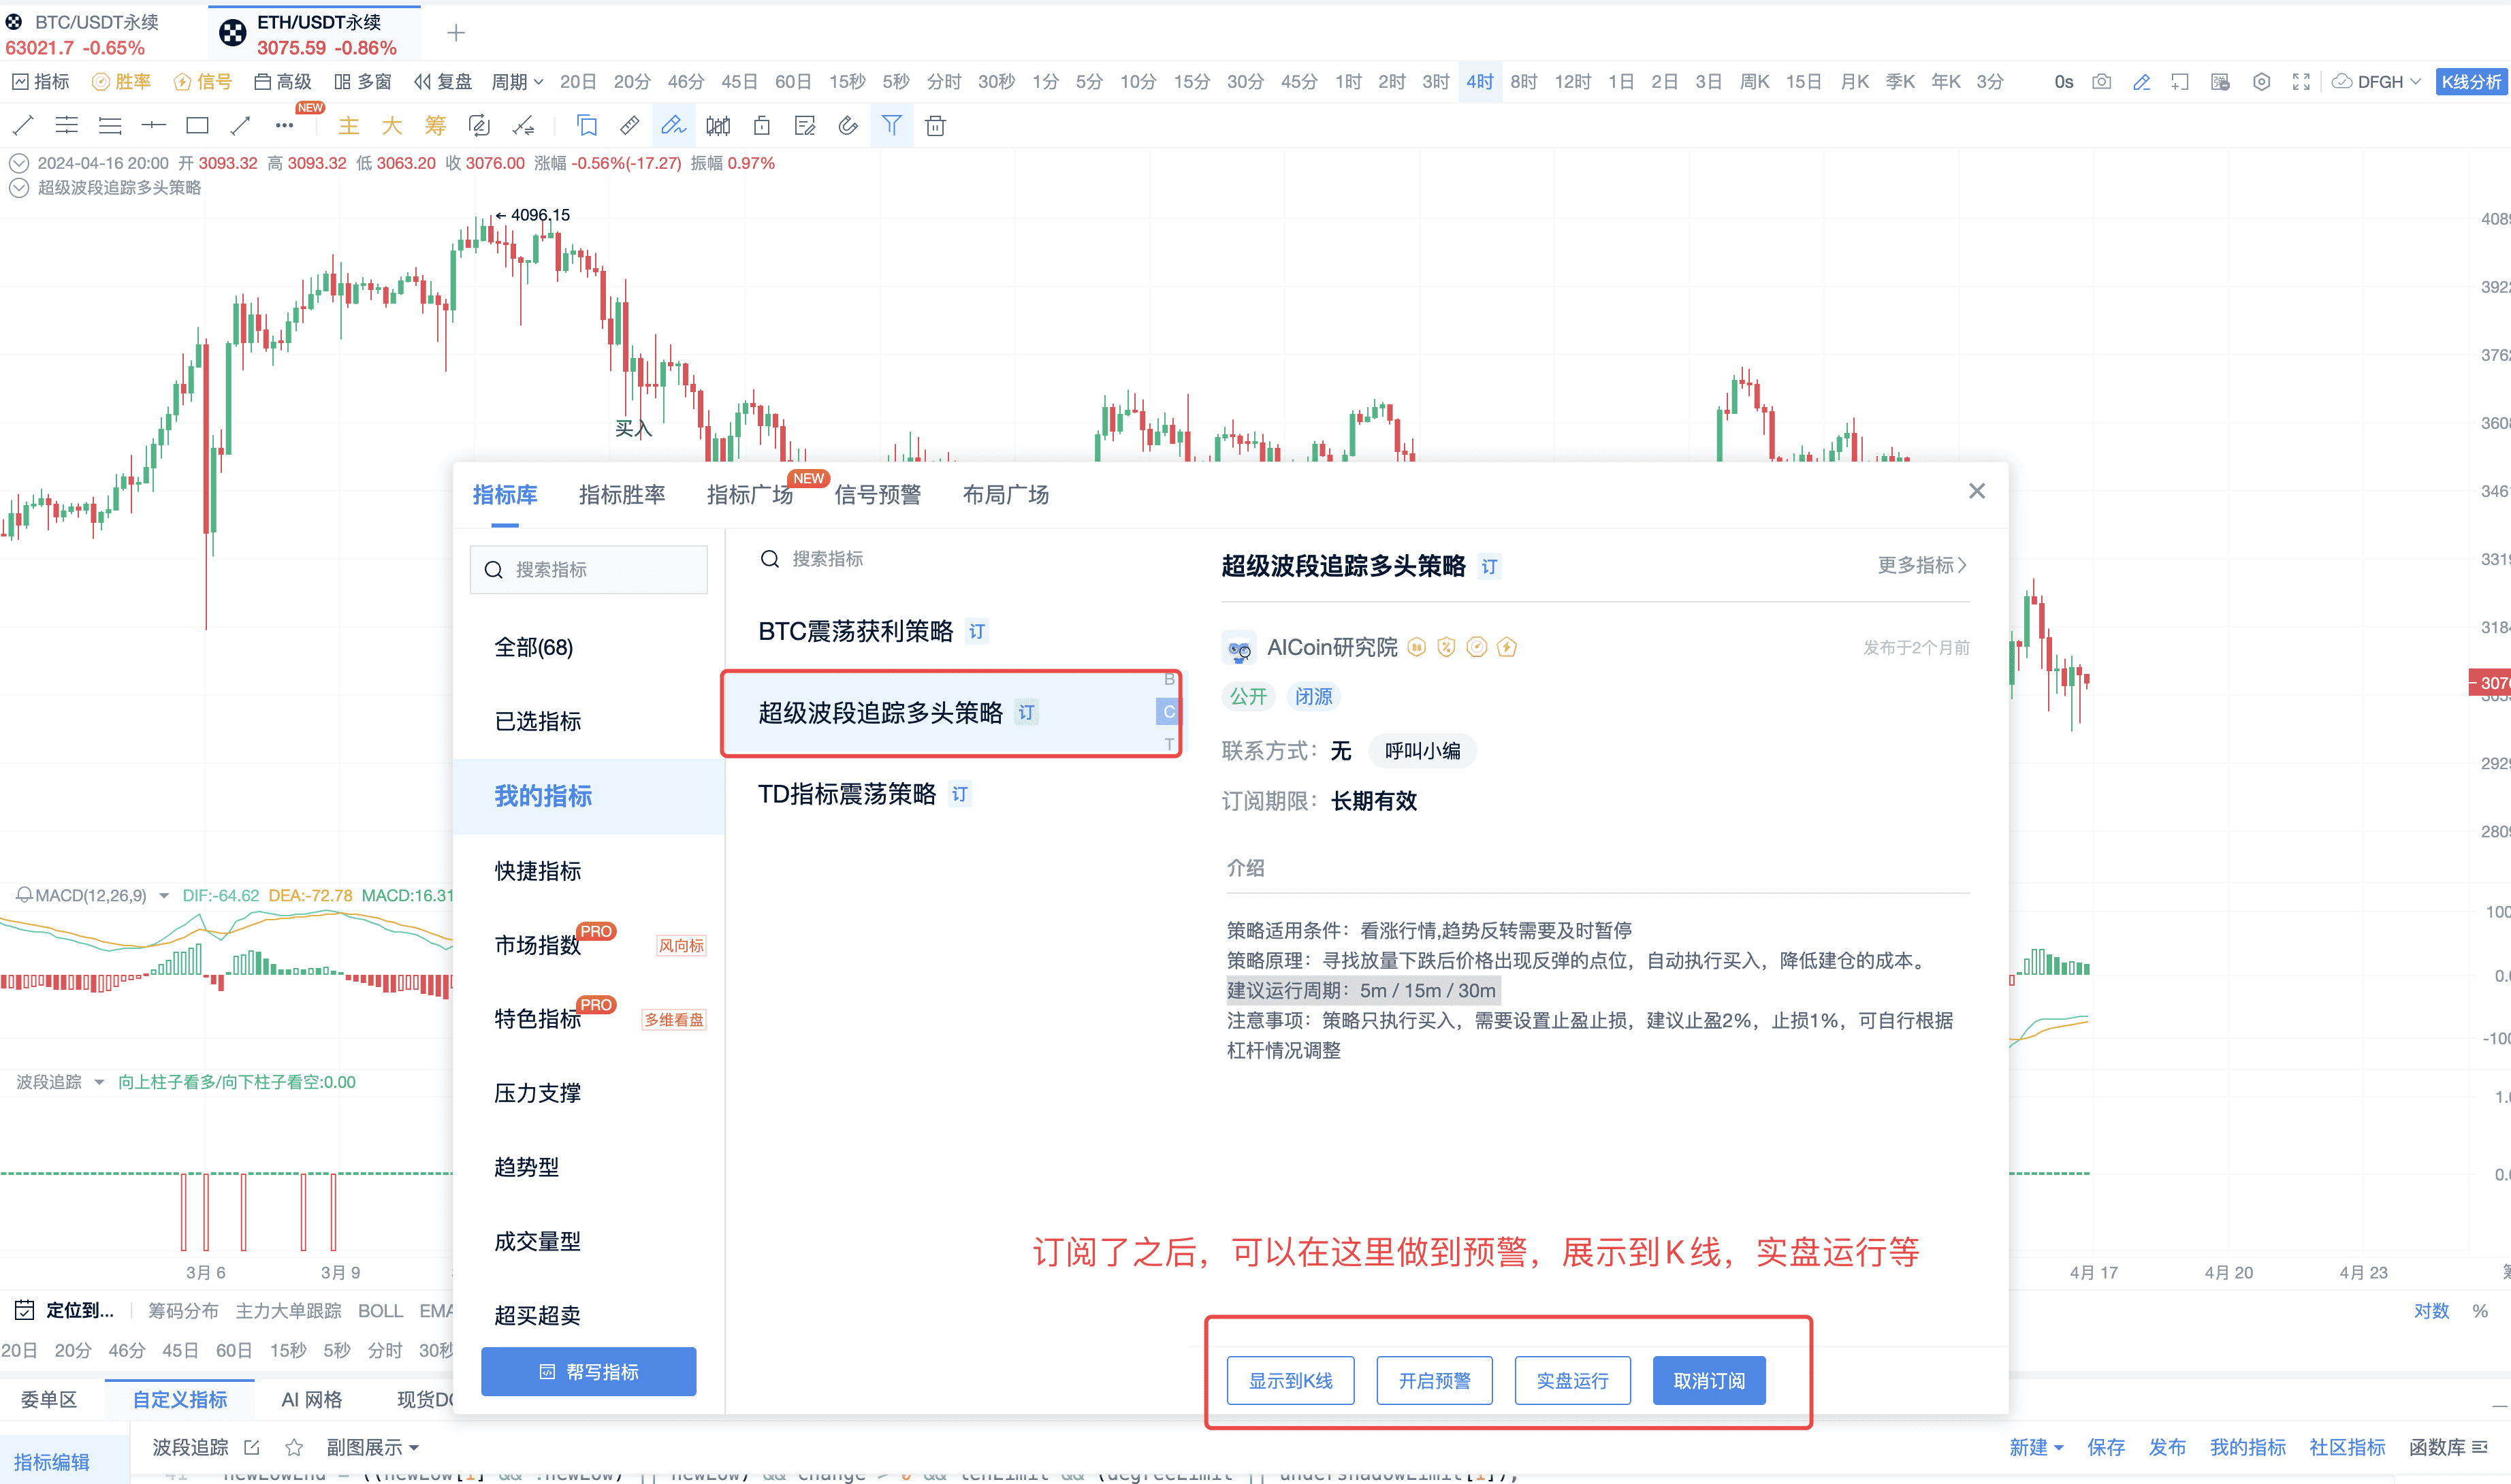
1. Subscribe to Long Strategy for Bottom Fishing
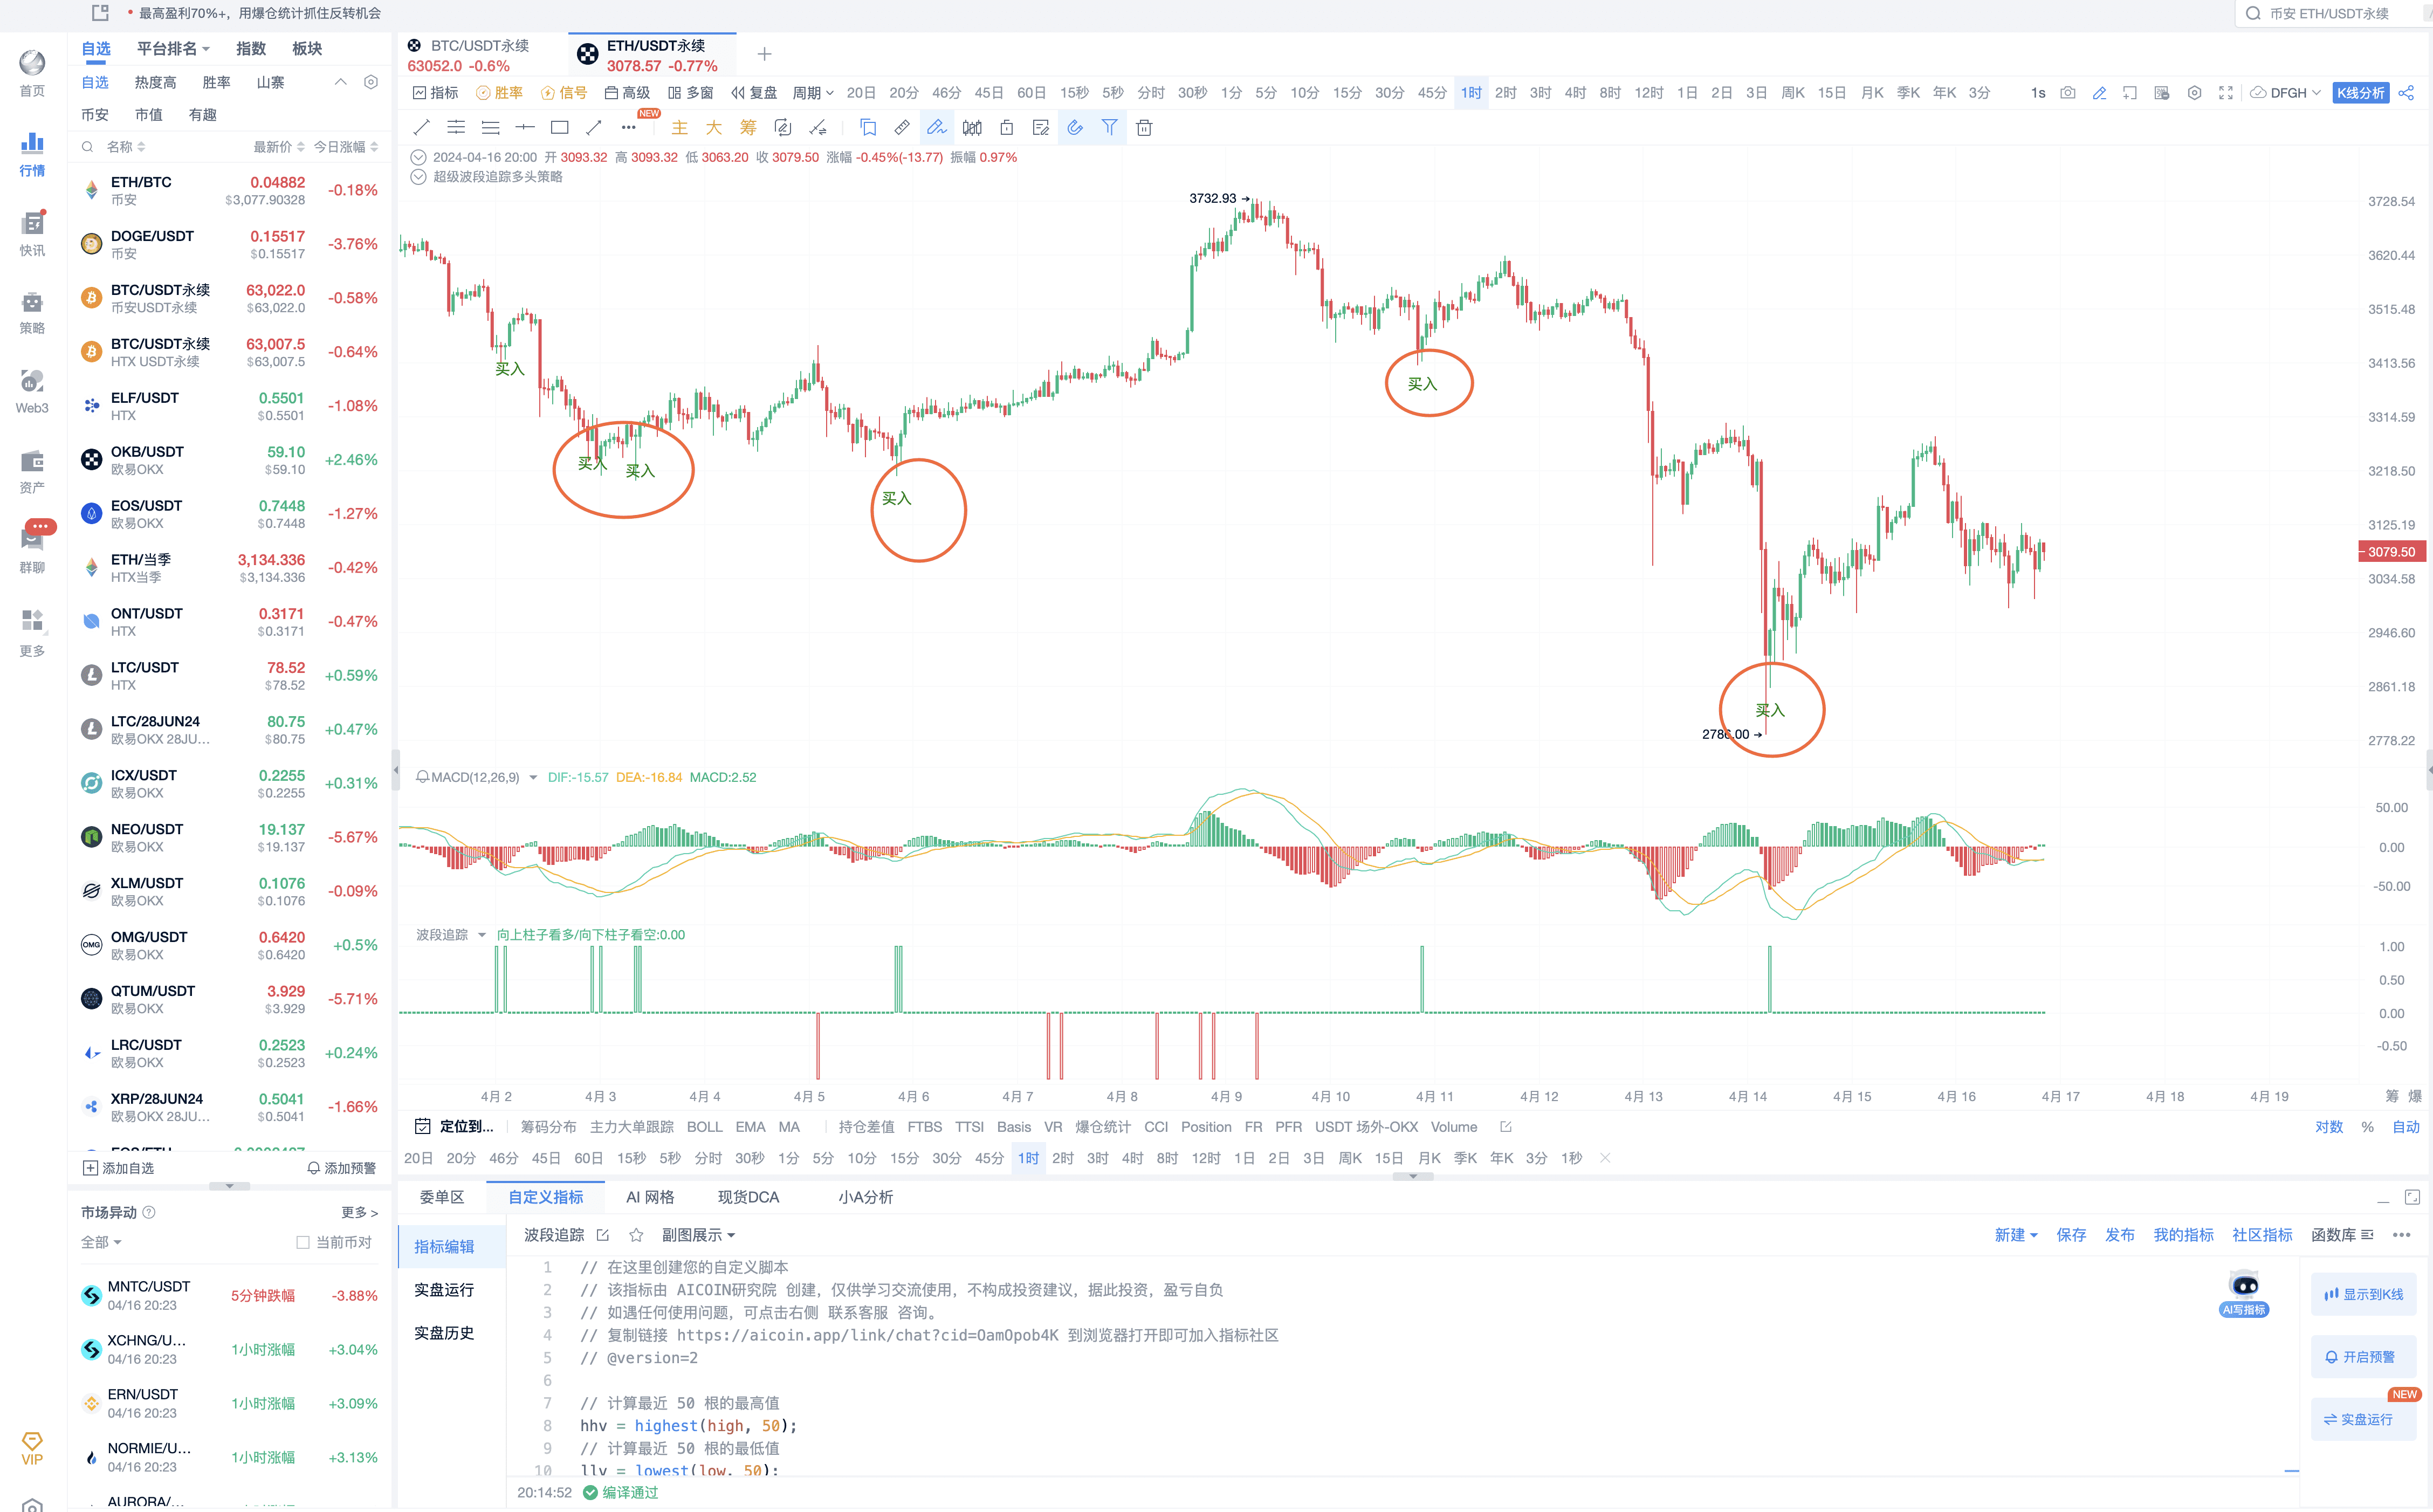
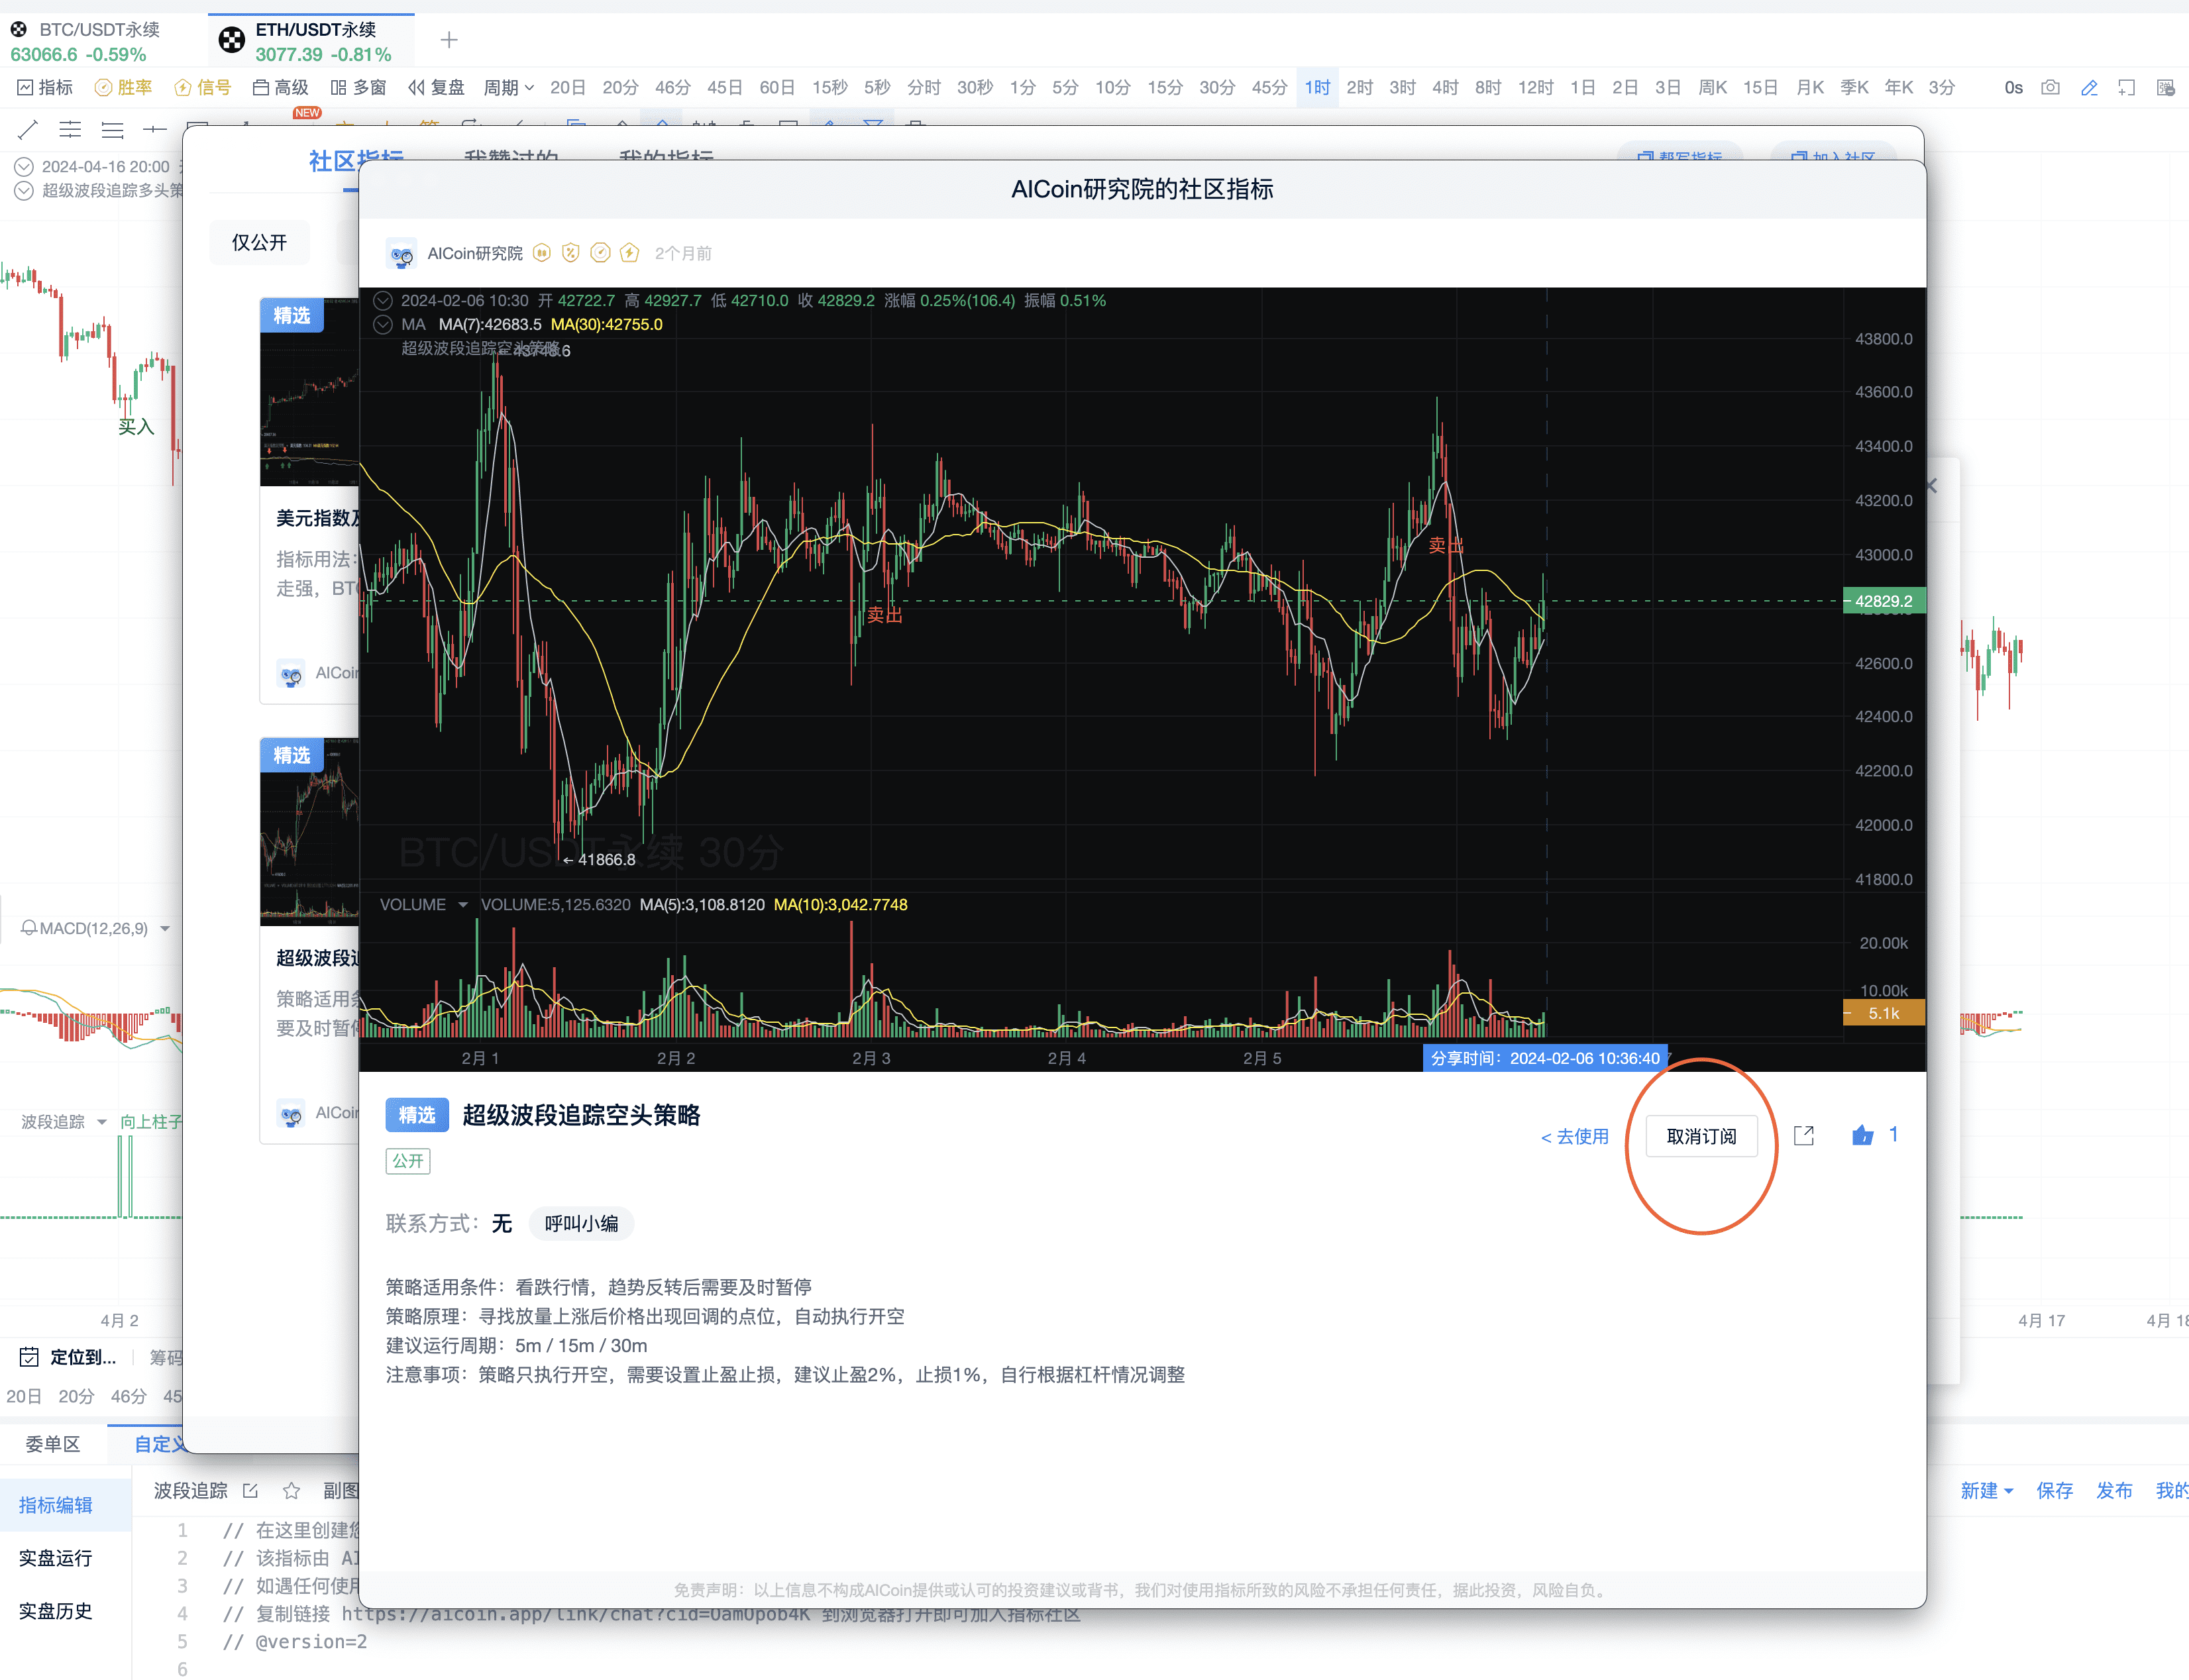
2. Subscribe to Short Strategy
Custom indicators below the K-line - Enter Community Indicators - Featured - Super Band Tracking Short Strategy
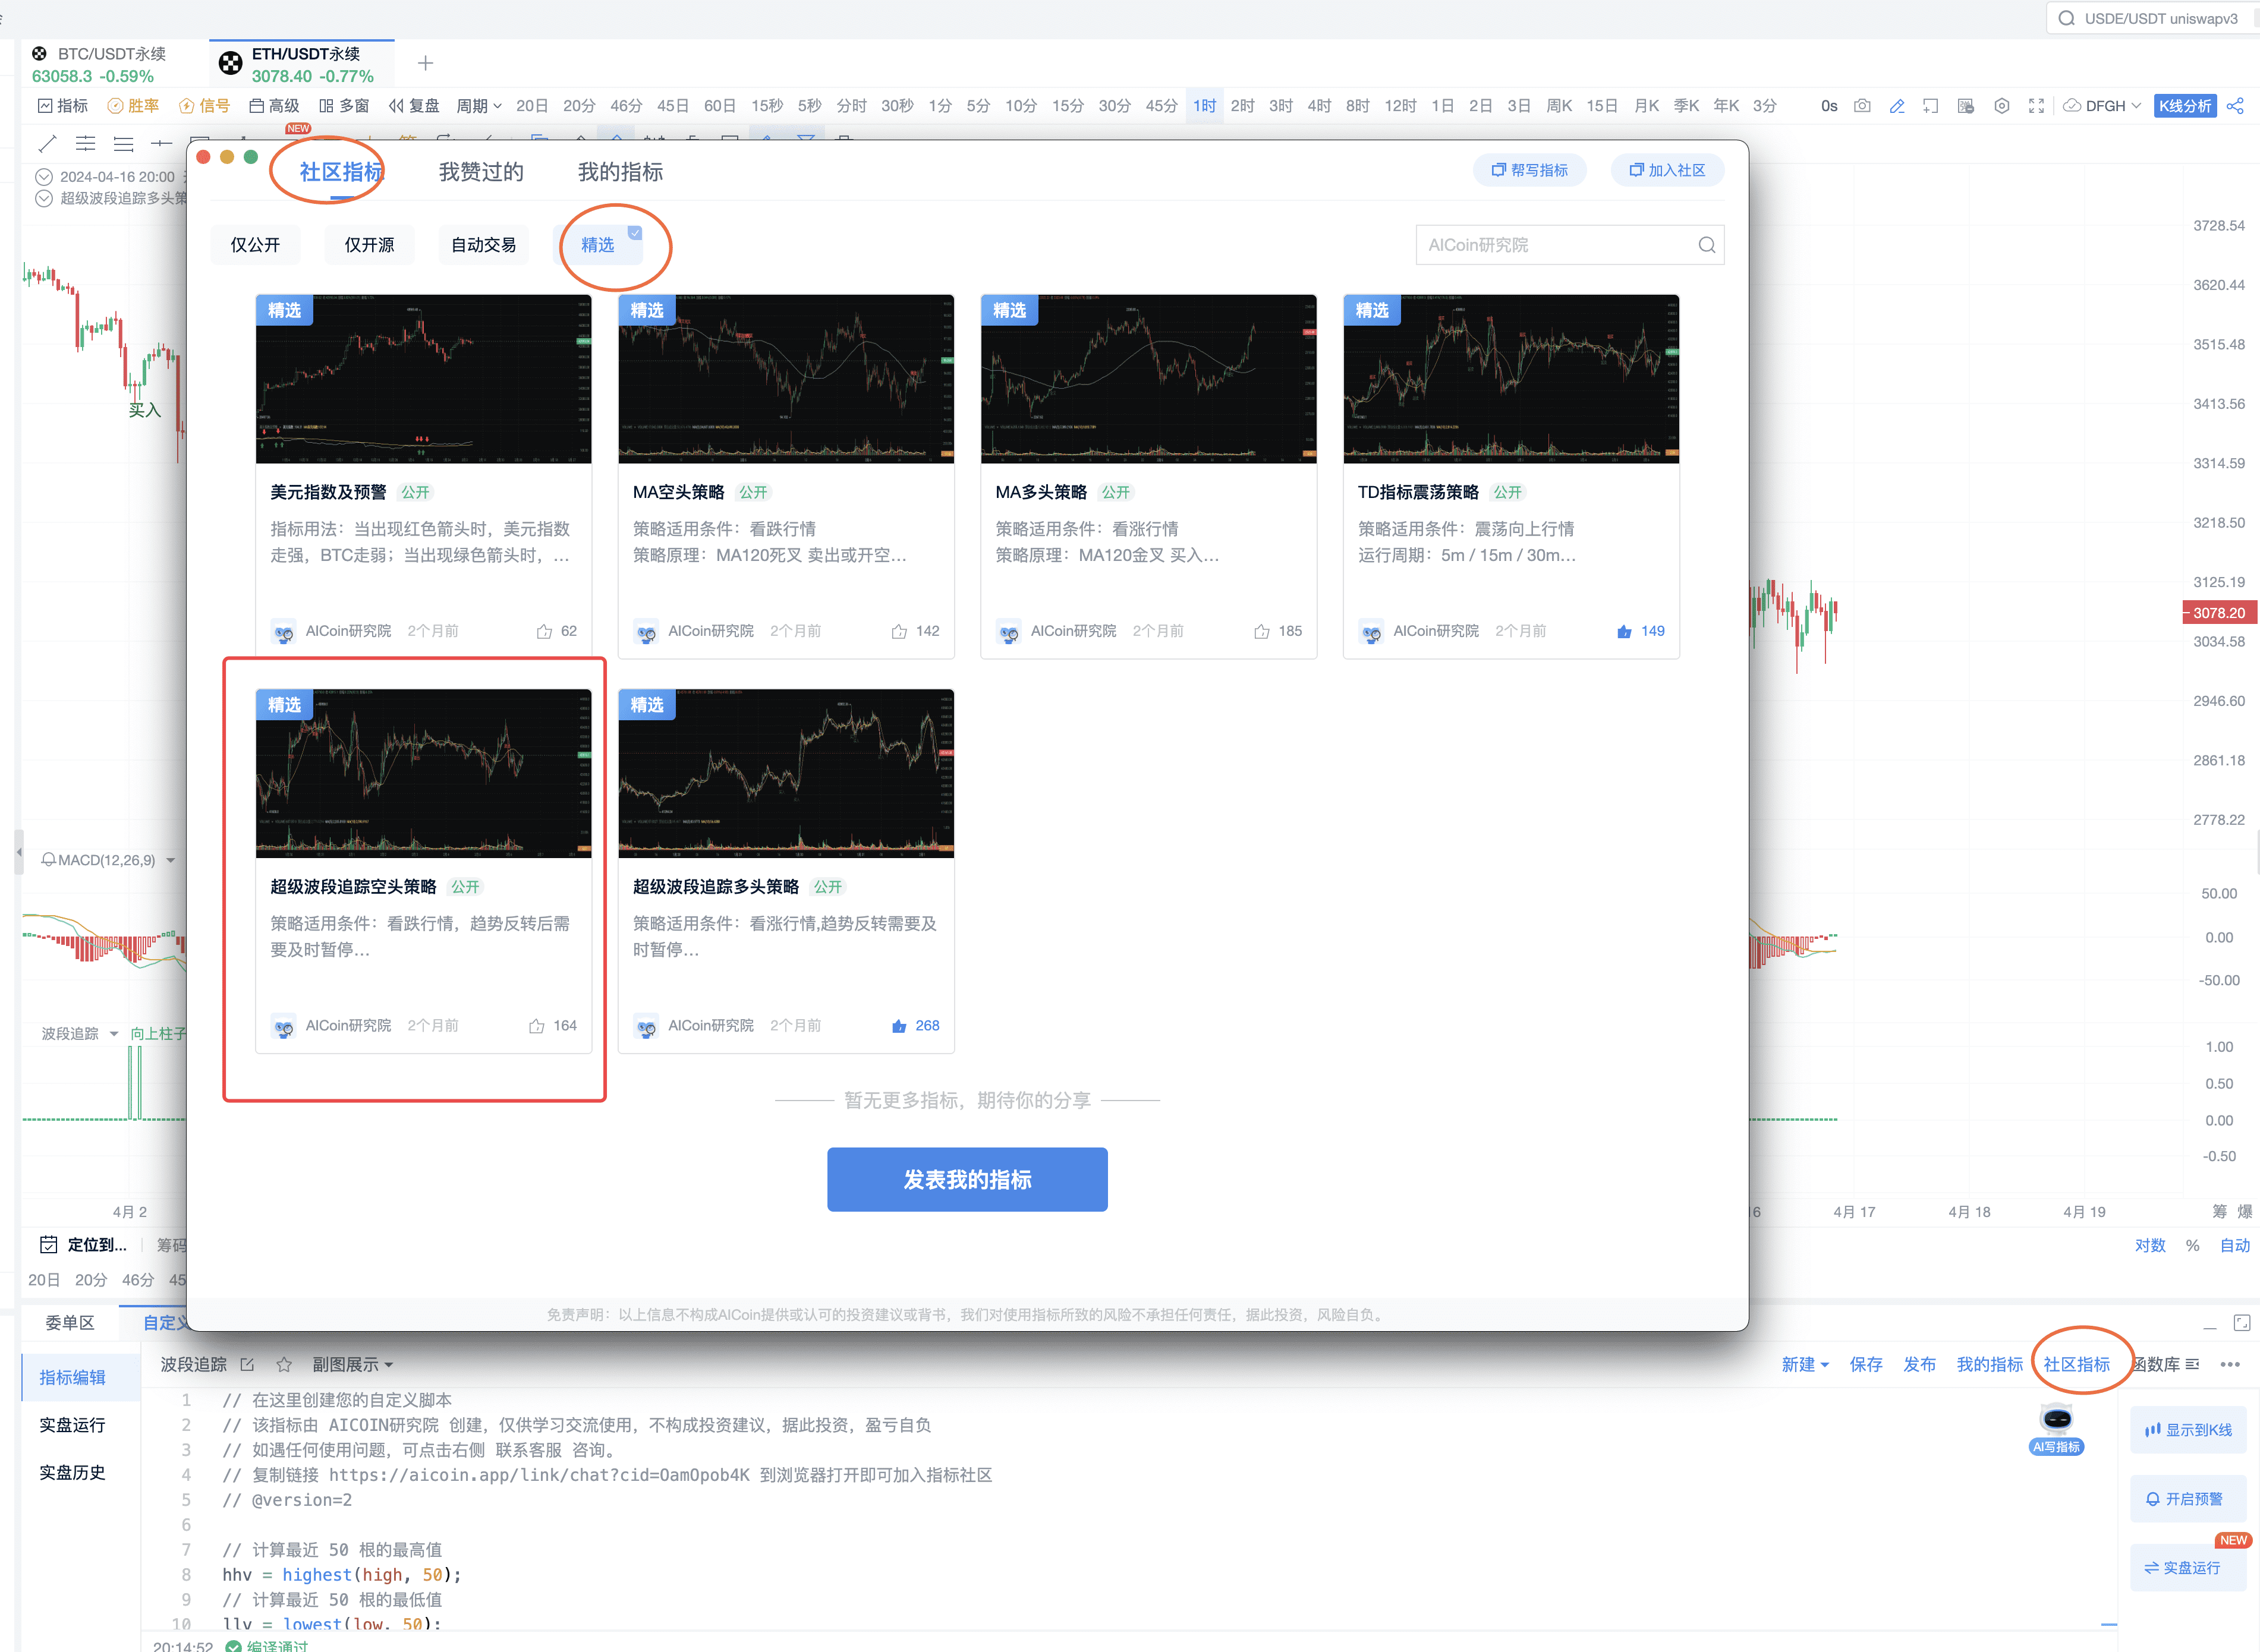
Subscribe to indicators
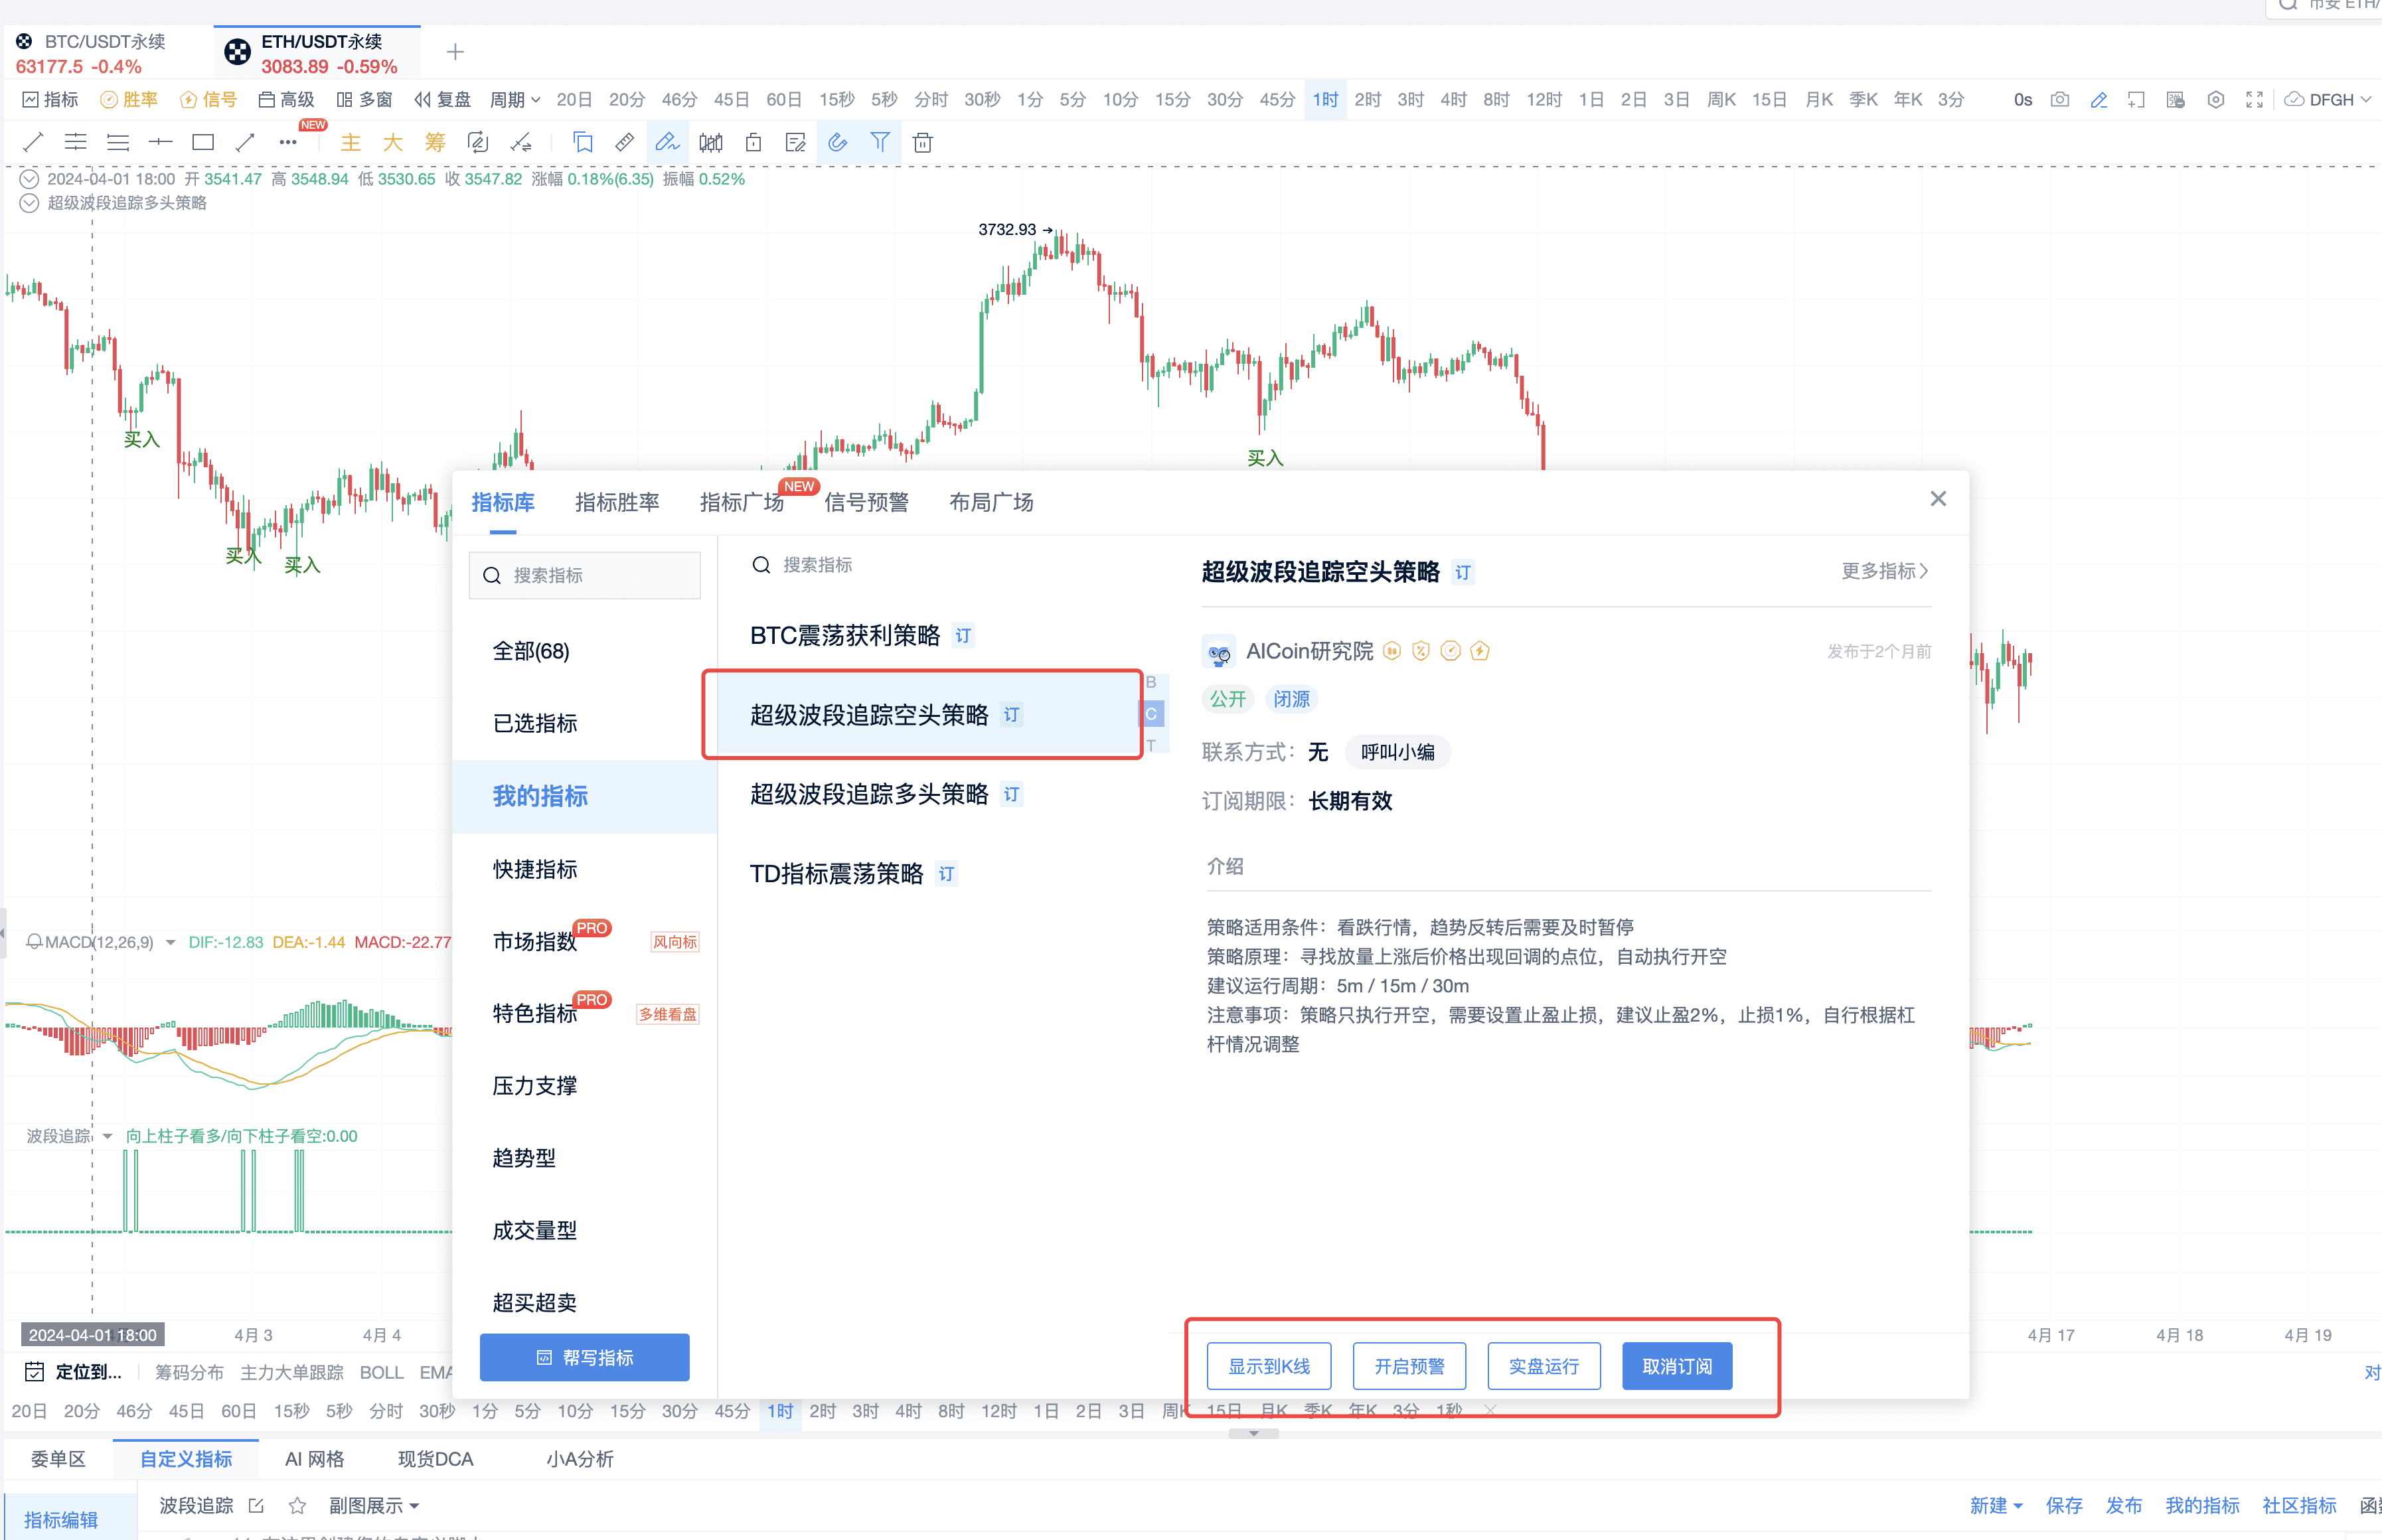
3. Display the Short Strategy on the K-line
The above two operations can be applied to BTC for wealth growth.
III. Principles and Usage of Band Tracking System
The long strategy and source code of the Super Band Tracking 2.0 system have been made public and can be found in the indicator script management panel.
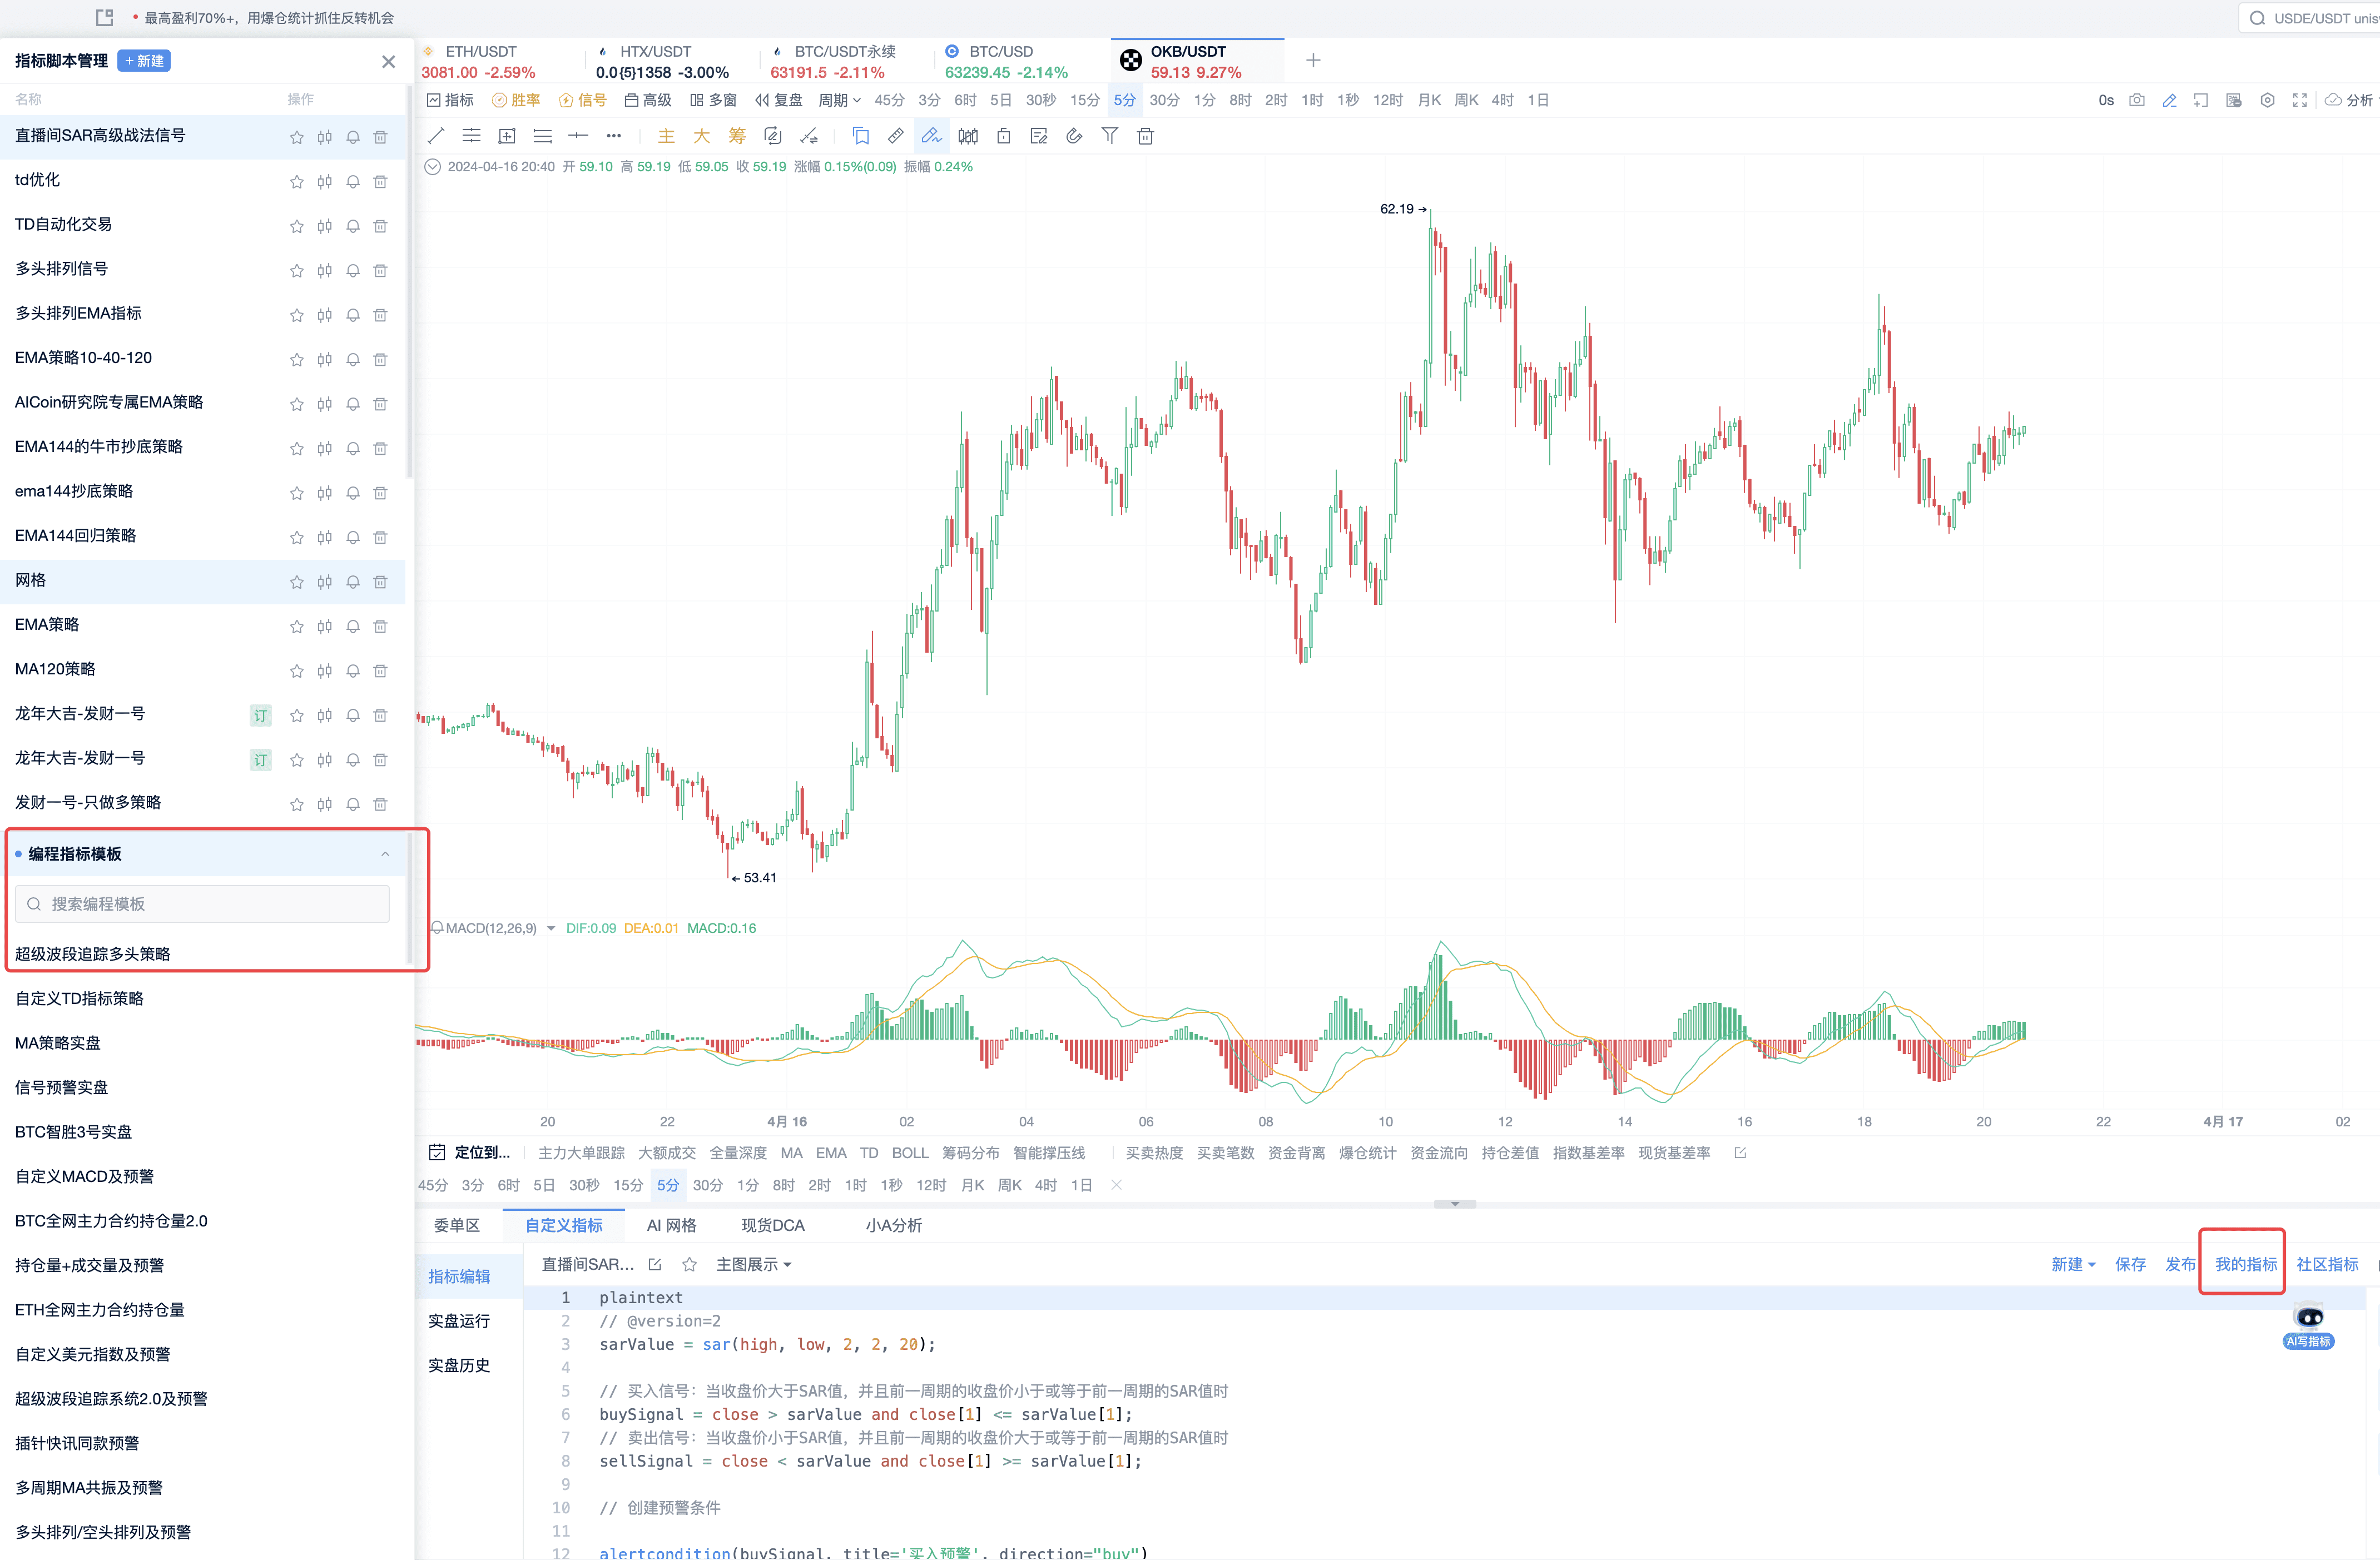
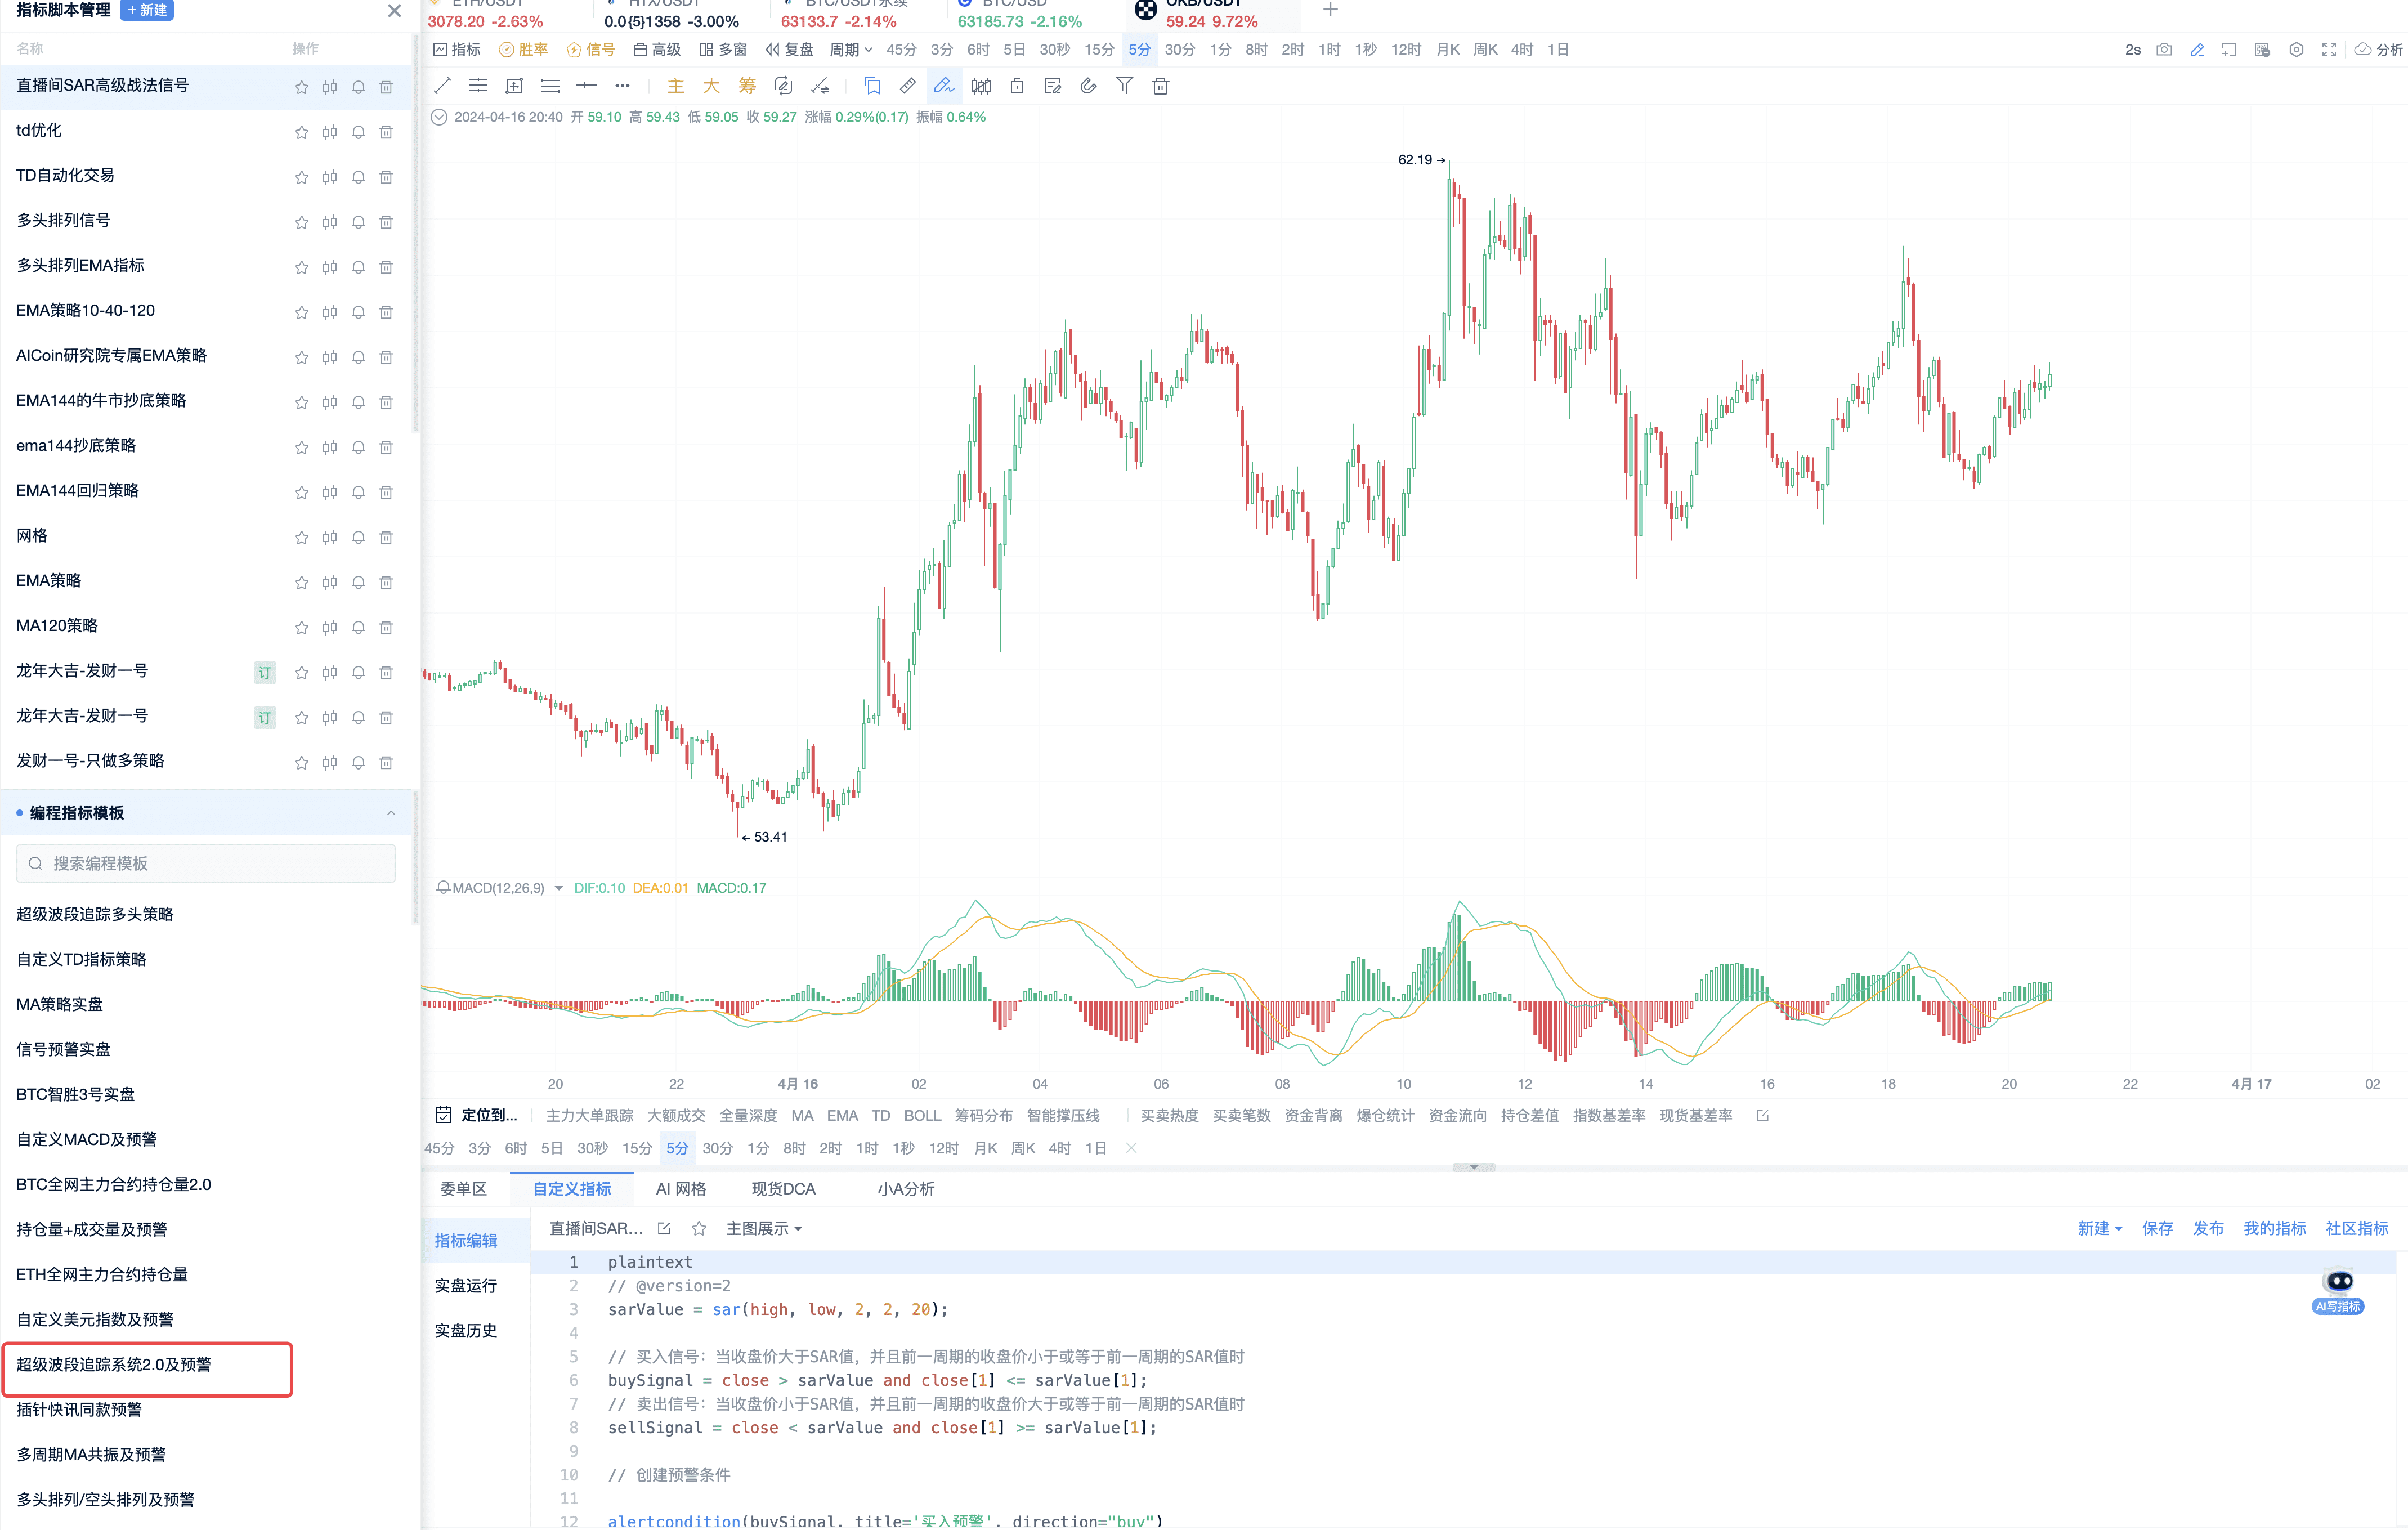
1. Code Principles
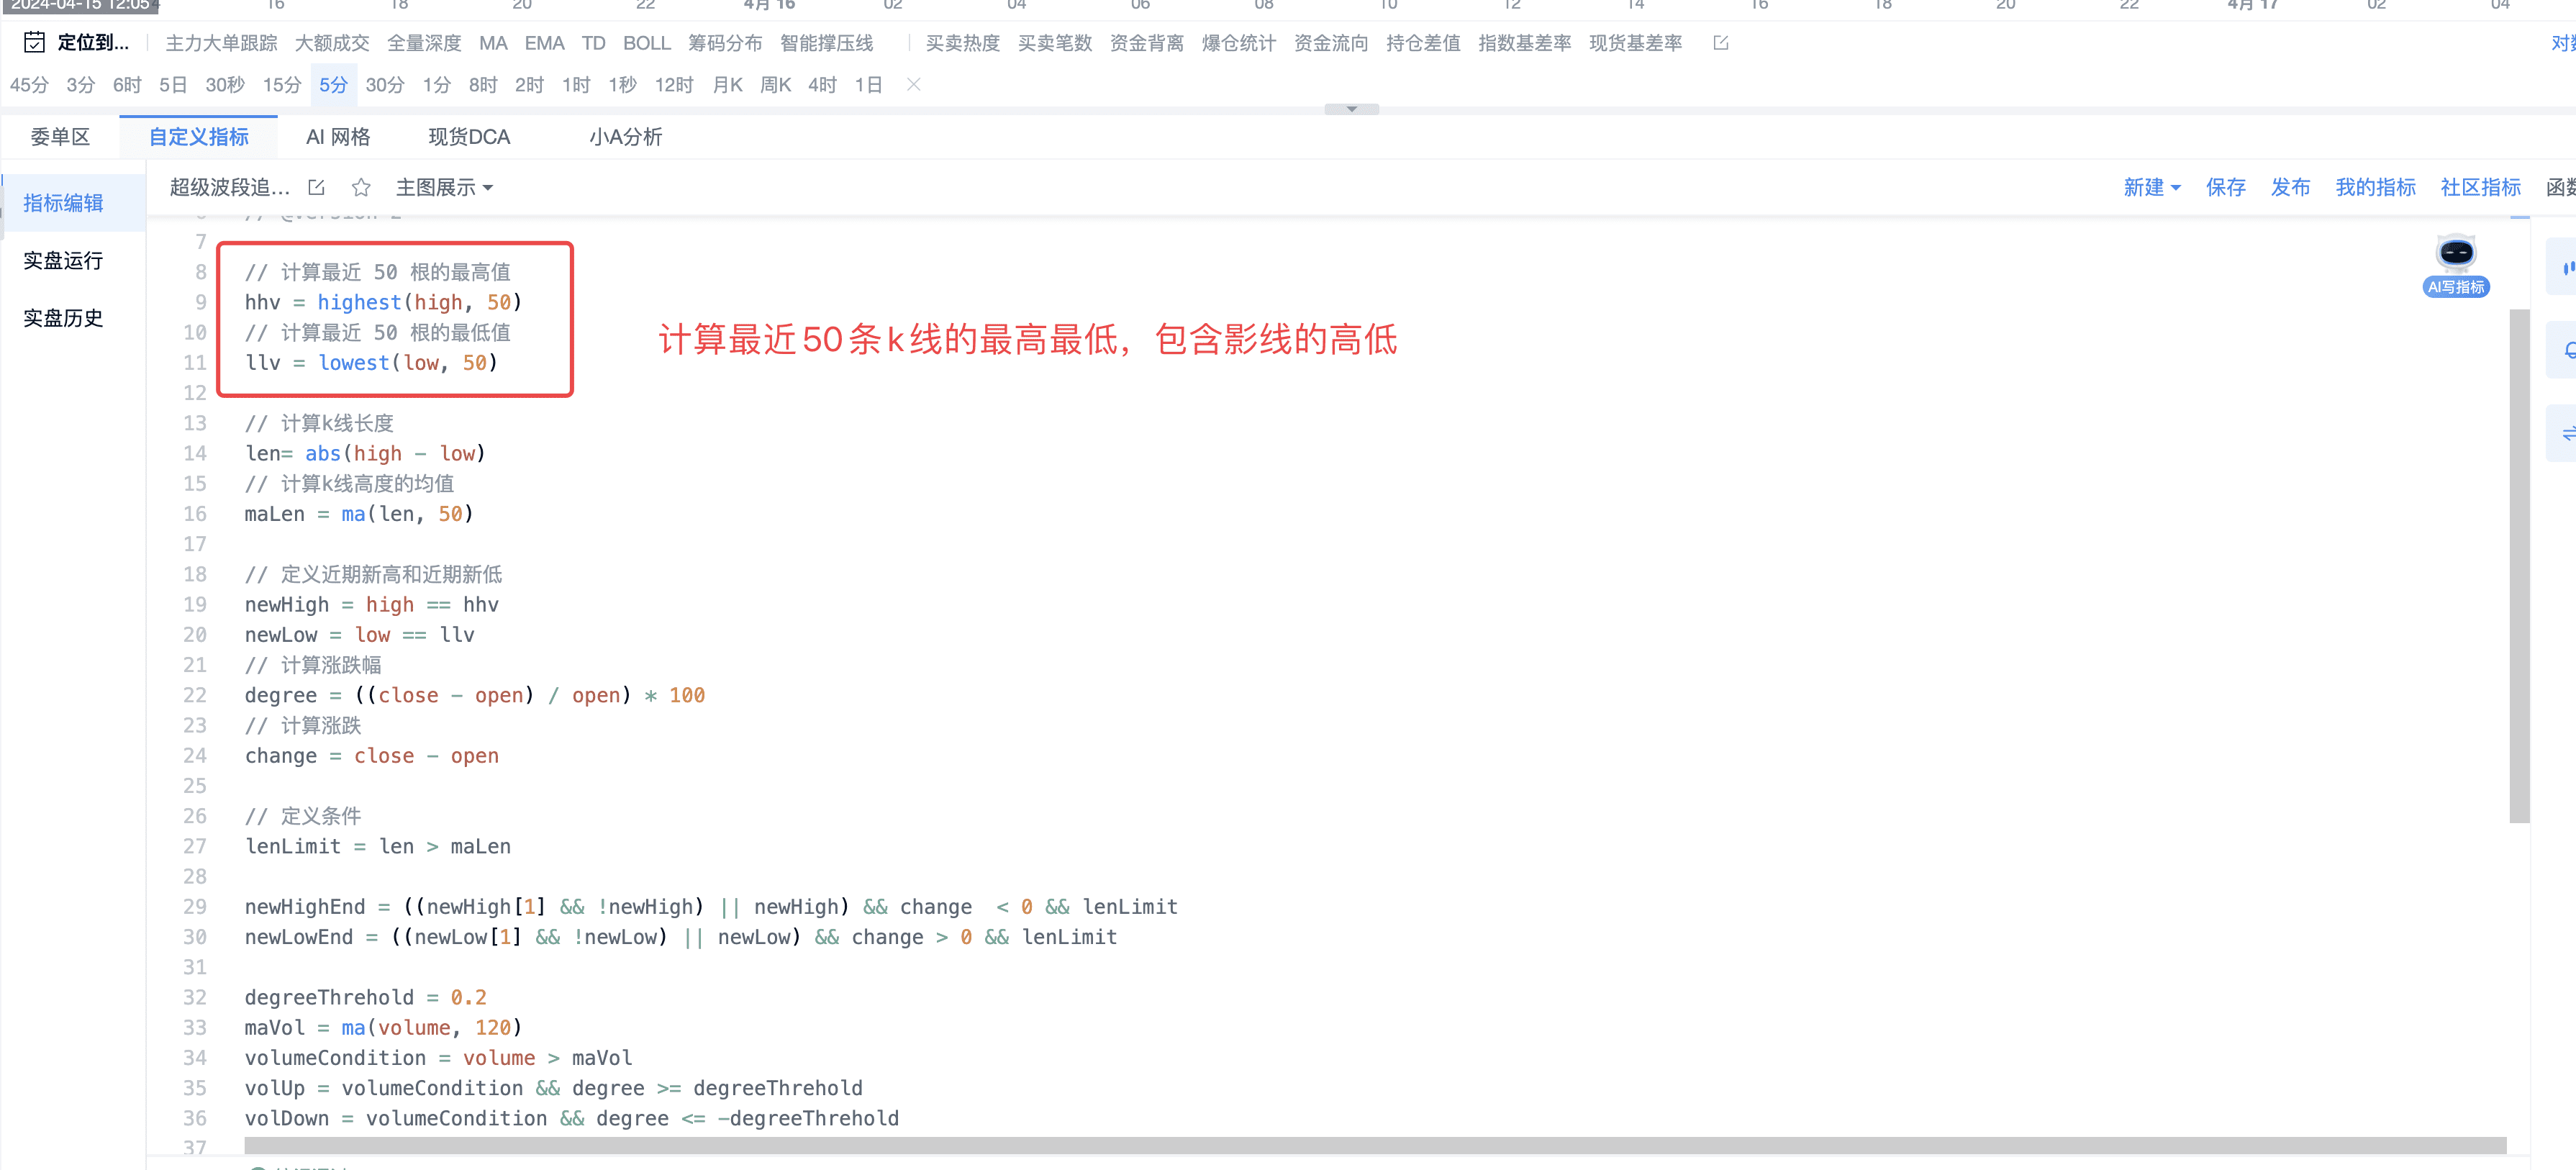
Step 1: Calculate the highs and lows of the most recent 50 candlesticks
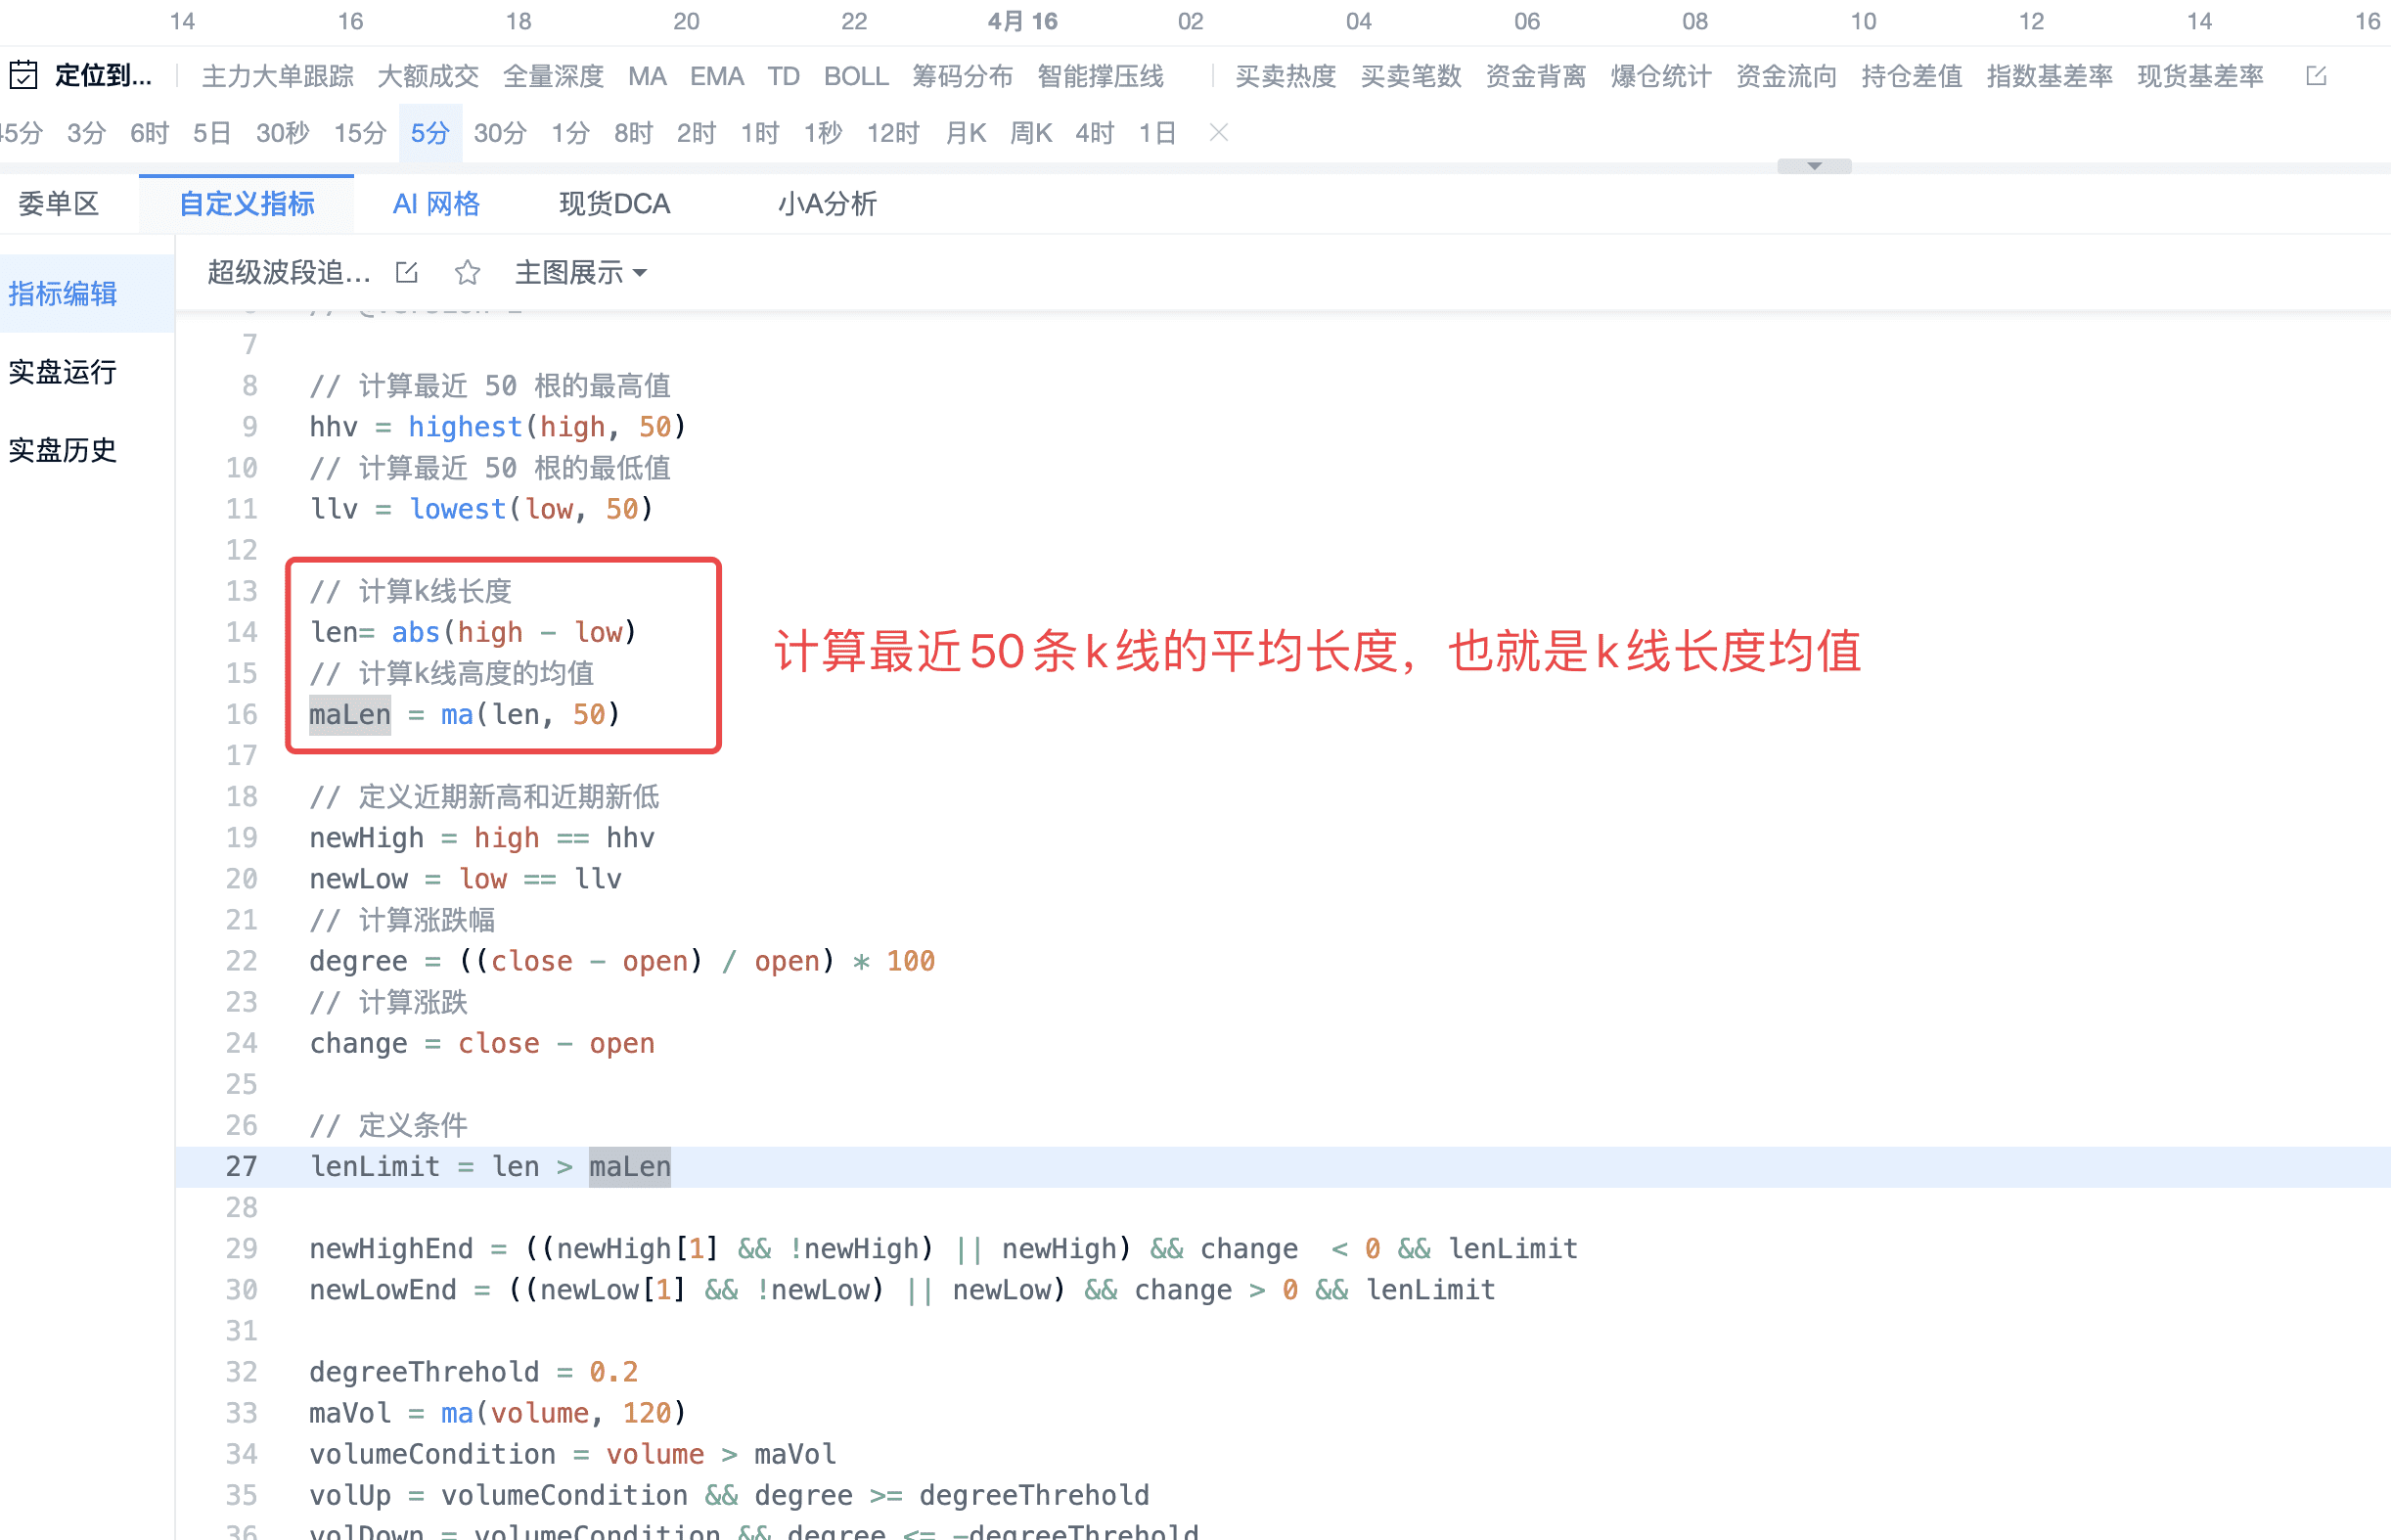
Step 2: Calculate the average length of the most recent 50 candlesticks
Step 3: Calculate recent new highs and new lows
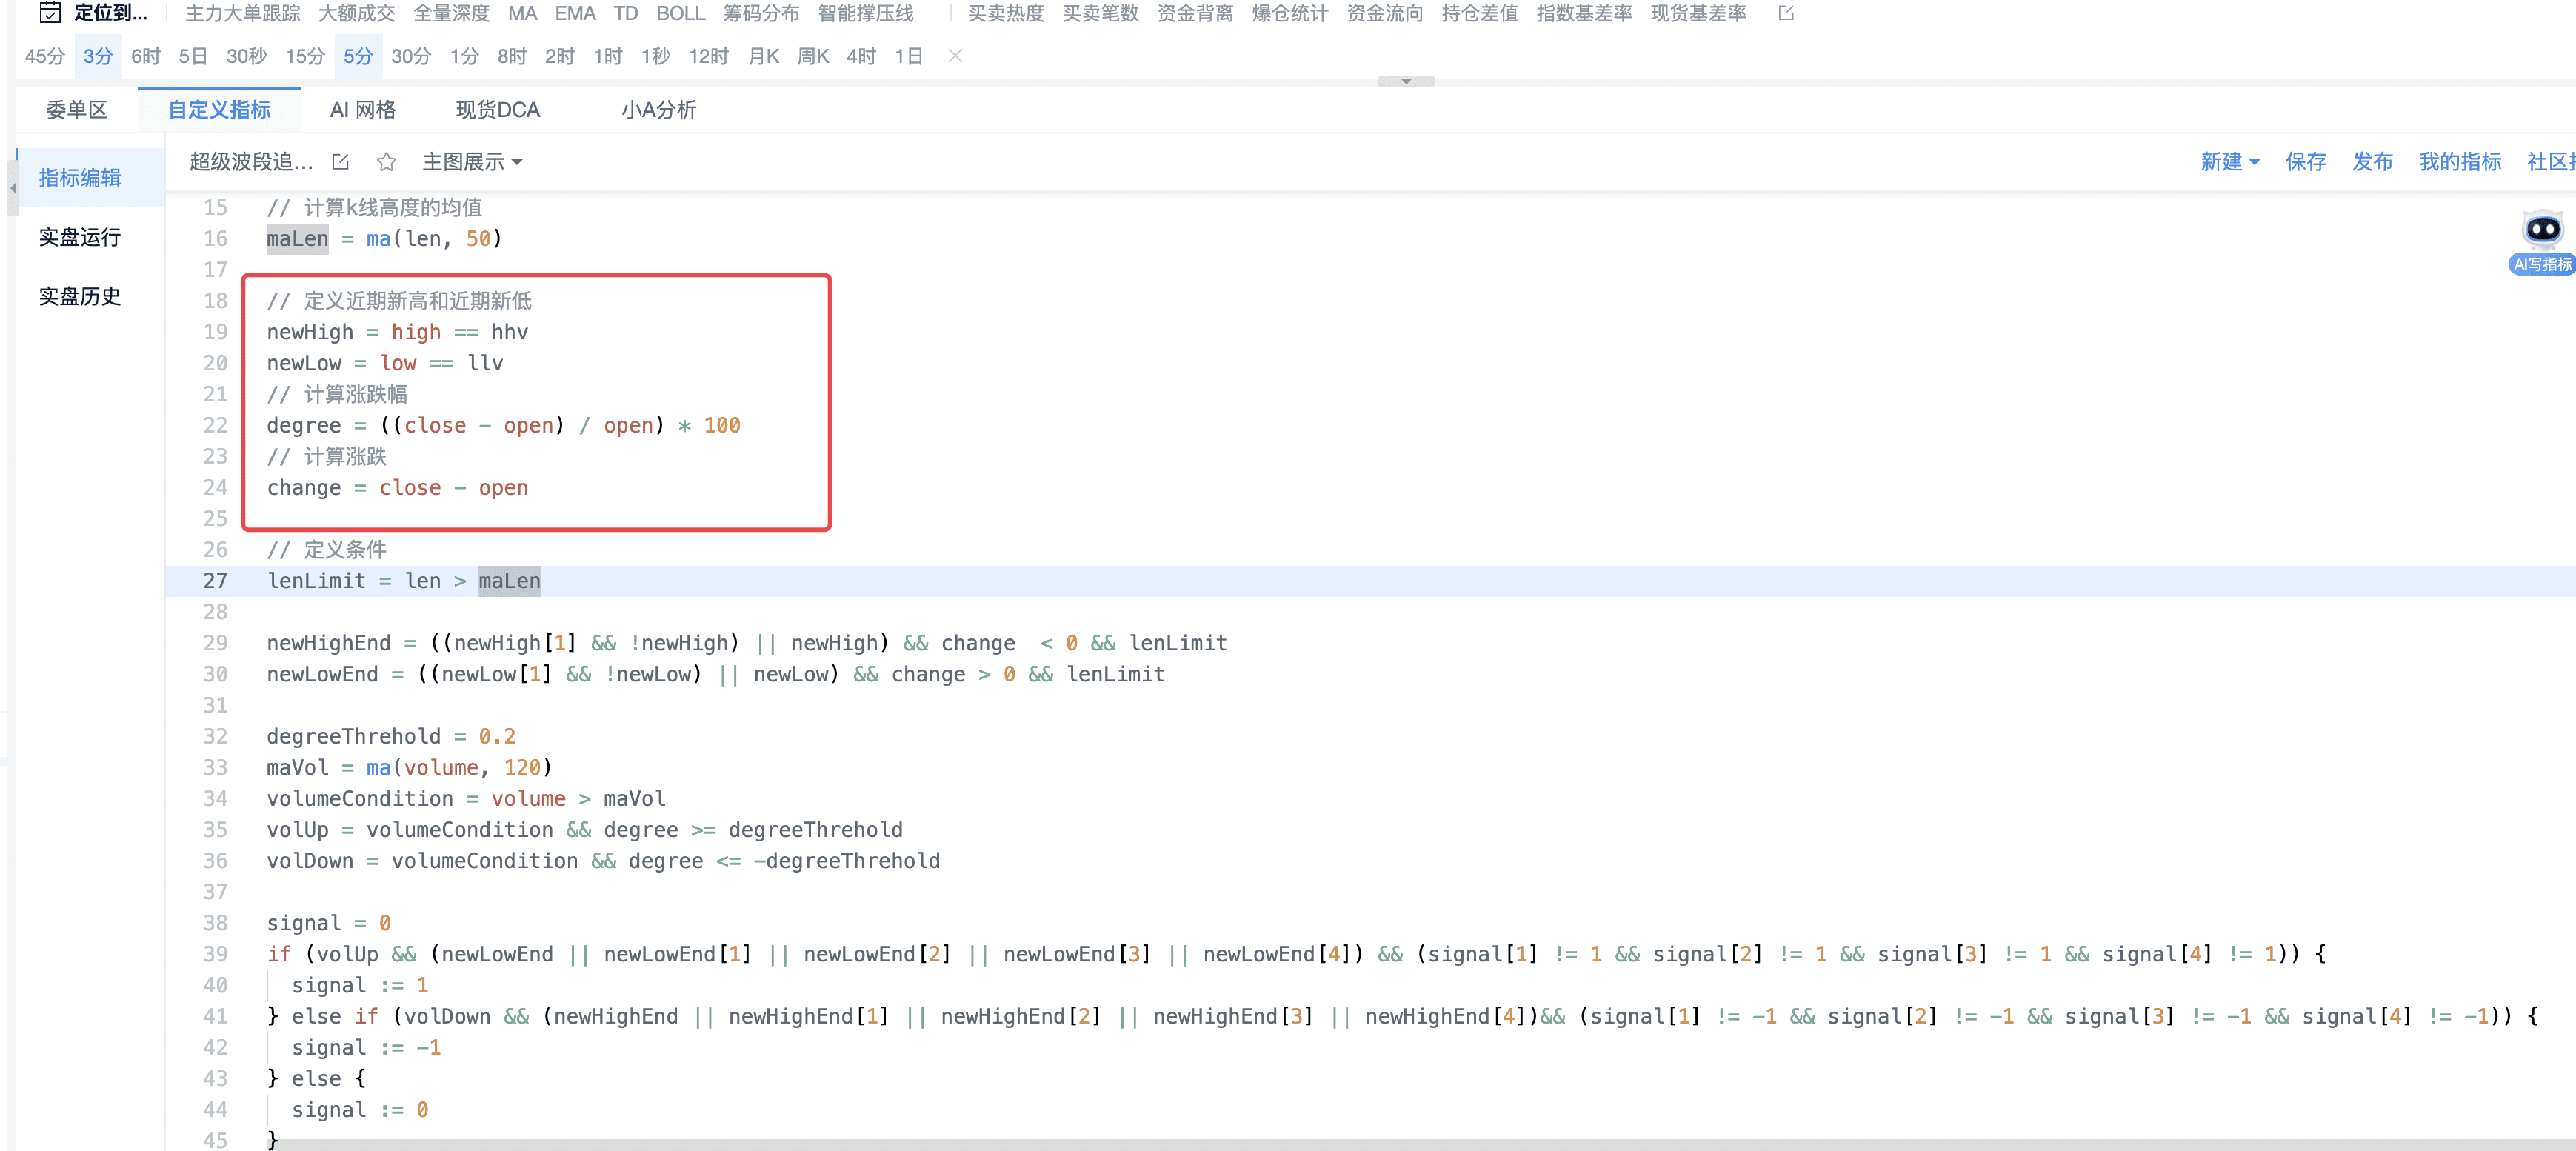
Here is the algorithm for band tracking
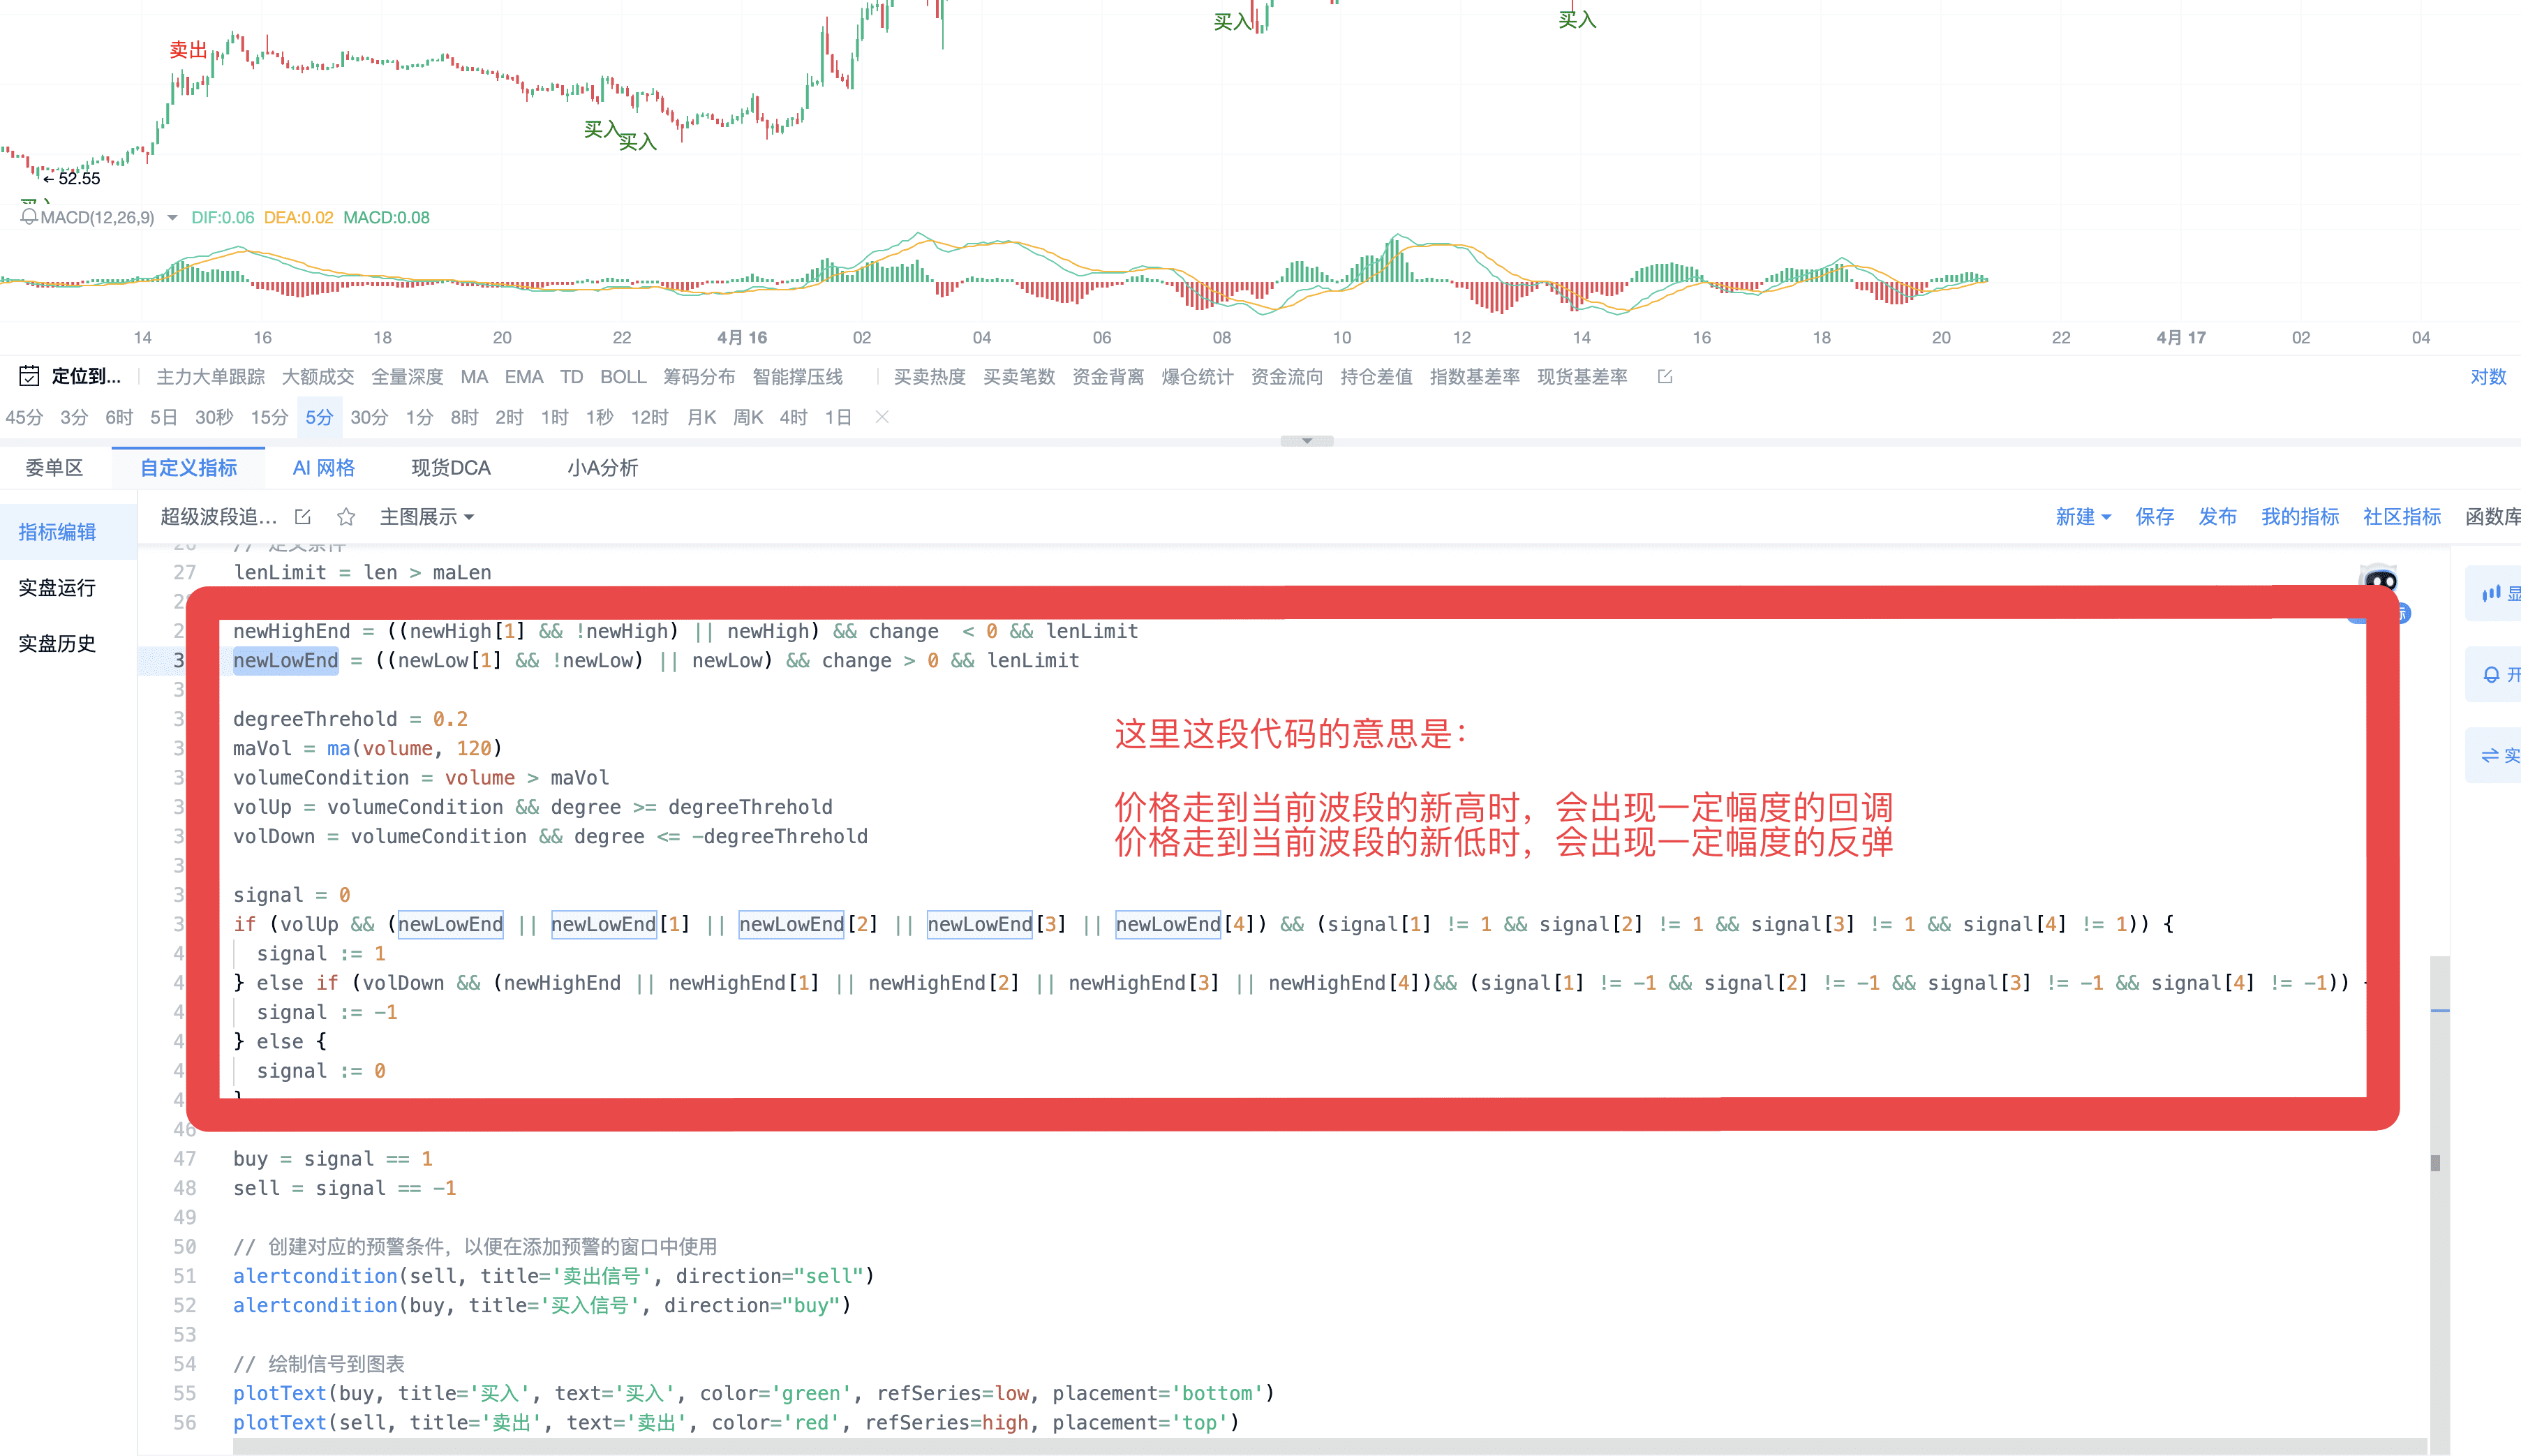
In summary, the core principle: Using the new highs and lows of prices, combined with trading volume, to create a band system.
2. Complete Code (Copyable)
(1) The first set comes from the system
// Create your custom script here
// This indicator is created by AICoin Research Institute, for learning and communication purposes only, and does not constitute investment advice. Any investment based on this is at your own risk
// If you encounter any usage issues, you can join the indicator community for consultation
// Copy the link https://aicoin.app/link/chat?cid=OamOpob4K and open it in a browser to join the indicator community
// @version=2
// Calculate the highest value of the last 50 candles
hhv = highest(high, 50)
// Calculate the lowest value of the last 50 candles
llv = lowest(low, 50)
// Calculate the length of the candle
len= abs(high - low)
// Calculate the average length of the candle
maLen = ma(len, 50)
// Define recent new highs and new lows
newHigh = high == hhv
newLow = low == llv
// Calculate the rate of increase or decrease
degree = ((close - open) / open) * 100
// Calculate the increase or decrease
change = close - open
// Define conditions
lenLimit = len > maLen
newHighEnd = ((newHigh[1] && !newHigh) || newHigh) && change < 0 && lenLimit
newLowEnd = ((newLow[1] && !newLow) || newLow) && change > 0 && lenLimit
degreeThreshold = 0.2
maVol = ma(volume, 120)
volumeCondition = volume > maVol
volUp = volumeCondition && degree >= degreeThreshold
volDown = volumeCondition && degree <= -degreeThreshold
signal = 0
if (volUp && (newLowEnd || newLowEnd[1] || newLowEnd[2] || newLowEnd[3] || newLowEnd[4]) && (signal[1] != 1 && signal[2] != 1 && signal[3] != 1 && signal[4] != 1)) {
signal := 1
} else if (volDown && (newHighEnd || newHighEnd[1] || newHighEnd[2] || newHighEnd[3] || newHighEnd[4])&& (signal[1] != -1 && signal[2] != -1 && signal[3] != -1 && signal[4] != -1)) {
signal := -1
} else {
signal := 0
}
buy = signal == 1
sell = signal == -1
// Create corresponding alert conditions for use in the alert window
alertcondition(sell, title='Sell Signal', direction="sell")
alertcondition(buy, title='Buy Signal', direction="buy")
// Plot the signals on the chart
plotText(buy, title='Buy', text='Buy', color='green', refSeries=low, placement='bottom')
plotText(sell, title='Sell', text='Sell', color='red', refSeries=high, placement='top')
(2) The second set, you can try putting it into custom indicators
// Create your custom script here
// This indicator is created by AICoin Research Institute, for learning and communication purposes only, and does not constitute investment advice. Any investment based on this is at your own risk
// If you encounter any usage issues, you can click on the right to contact customer service for consultation.
// Copy the link https://aicoin.app/link/chat?cid=OamOpob4K and open it in a browser to join the indicator community
// @version=2
// Calculate the highest value of the last 50 candles
hhv = highest(high, 50);
// Calculate the lowest value of the last 50 candles
llv = lowest(low, 50);
// Calculate ma
// ma = ma(close, 120);
// Calculate upper shadow
overshadow = high - max(open, close);
// Calculate candle body
solid = abs(close - open);
// Calculate lower shadow
undershoot = min(close, open) - low;
// Calculate the length of the candle
len= abs(high - low);
// Calculate the average length of the candle
maLen = ma(len, 50);
// Define recent new highs and new lows
newHigh = high == hhv;
newLow = low == llv;
// Calculate the rate of increase or decrease
degree = ((close - open) / open) * 100;
// Calculate the increase or decrease
change = close - open;
// Define conditions
lenLimit = len > maLen;
degreeLimit = abs(degree[1]) >= 0;
overshadowLimit = overshadow > solid * 3;
undershadowLimit = undershoot > solid * 3;
volLimit = volume[1] > volume[2] * 3;
newHighEnd = ((newHigh[1] && !newHigh) || newHigh) && change < 0 && lenLimit && (degreeLimit || overshadowLimit[1]);
newLowEnd = ((newLow[1] && !newLow) || newLow) && change > 0 && lenLimit && (degreeLimit || undershadowLimit[1]);
// 1 is a buy signal
// -1 is a sell signal
// signal = newHighEnd ? (close > ma ? -1 : 1) : (newLowEnd ? (close < ma ? 1 : -1): 0);
signal = newHighEnd ? -1 : newLowEnd ? 1 : 0;
// Create corresponding alert conditions for use in the alert window
alertcondition(newHighEnd, title='Sell Signal');
alertcondition(newLowEnd, title='Buy Signal');
// Plot on the chart
plotColumn(signal, title="Upward column for bullish/Downward column for bearish");
PRO members, signal alert members, are high-quality tools tailored exclusively for lazy friends, and custom indicators can help any AICoin user plan their trades and trade their plans. For more custom indicator strategy displays and multiple alert reminders, feel free to experience the custom indicator membership for a limited time for free by opening the signal alert/PRO version K-line. Click the link below to open and experience: https://aicoin.app/zh-CN/vip/chartpro
Recommended Reading
For more live content, please follow AICoin's "[News/Information-Live Review](https://aicoin.app/news/Live review)" section, and feel free to download AICoin PC-end
免责声明:本文章仅代表作者个人观点,不代表本平台的立场和观点。本文章仅供信息分享,不构成对任何人的任何投资建议。用户与作者之间的任何争议,与本平台无关。如网页中刊载的文章或图片涉及侵权,请提供相关的权利证明和身份证明发送邮件到support@aicoin.com,本平台相关工作人员将会进行核查。


