Like you are a small snowball, there is a starting point in the snowy forest, and you are not sure where to roll. But you might as well start rolling, anyway, there is snow everywhere, and rolling anywhere will make you thicker. You may have taken a detour, or later found that the direction was wrong, but you have become stronger in the end, and finally become a big snowball. After becoming bigger, roll to where you want to go, and you will always be faster.
Bitcoin Market Analysis
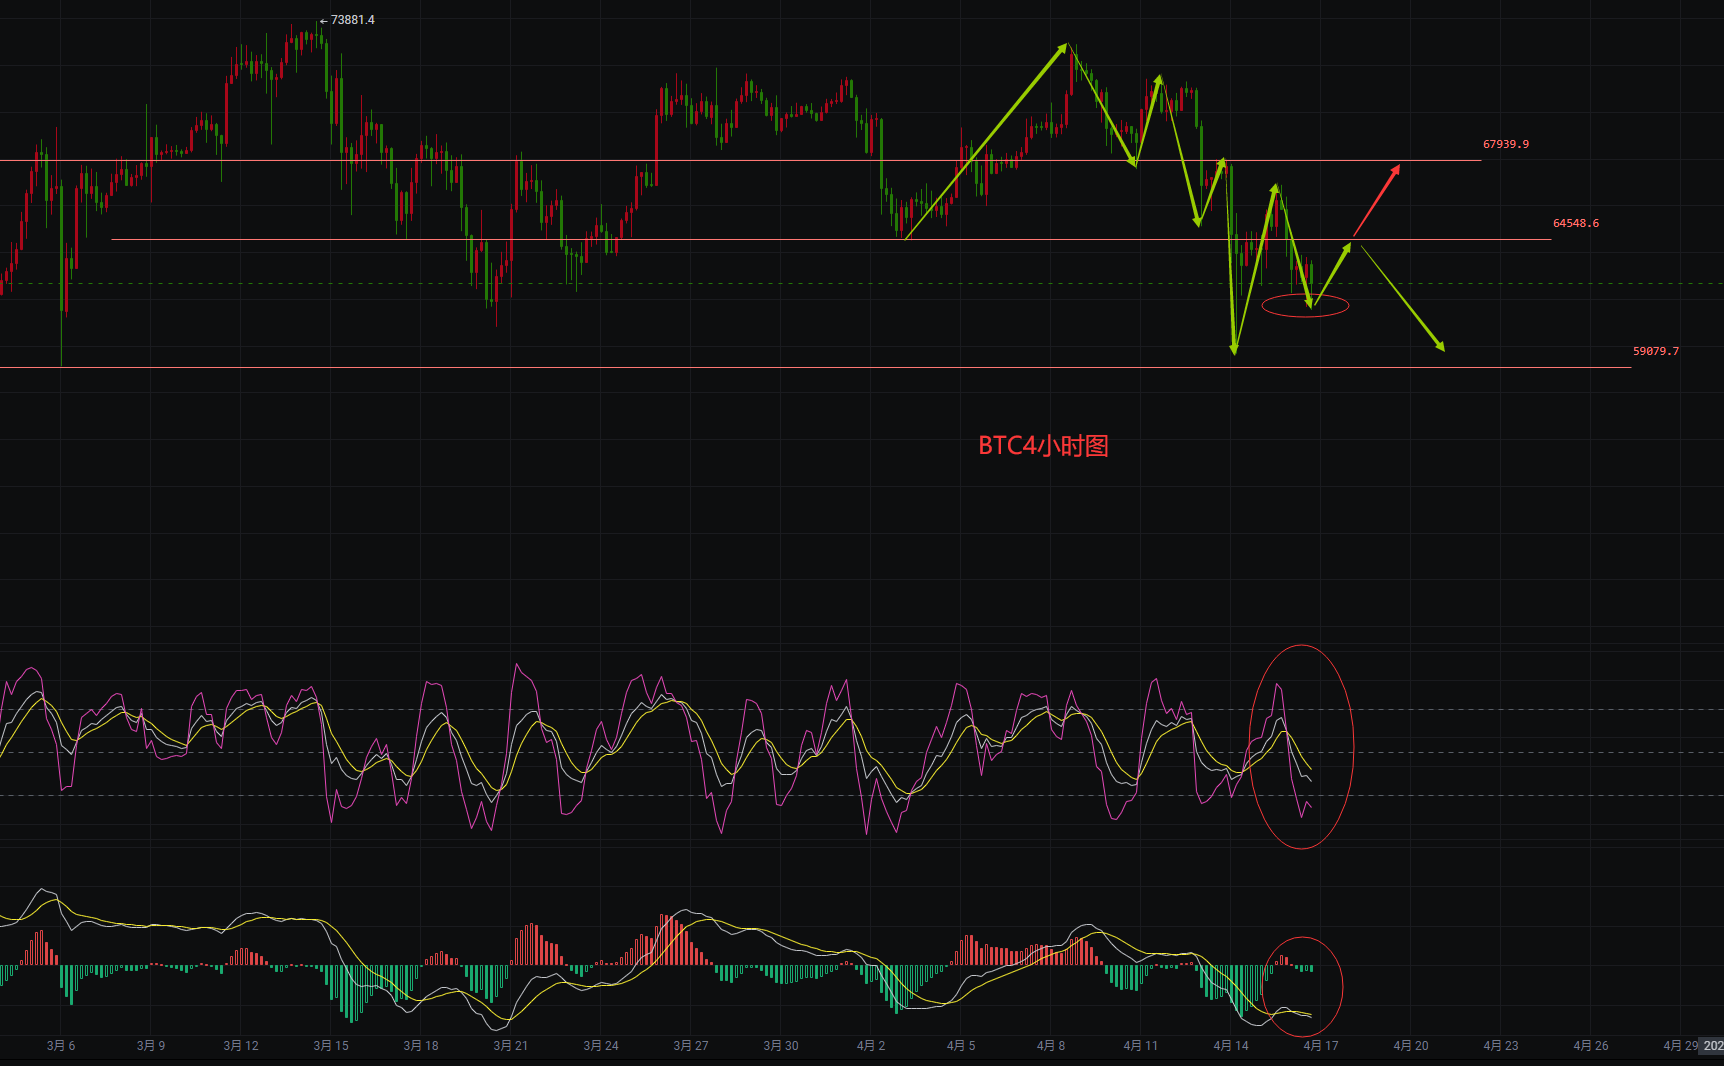
BTC's weekly K-line is currently showing three consecutive declines. The K-line last week showed a pin-shaped bearish candlestick, and the market has been oscillating widely in the range of 59,000 to 73,000 over the past 7 weeks. The KDJ indicator's three lines have formed a dead cross below the 85 axis, and the MACD indicator's red solid kinetic energy column has shrunk. From the weekly K-line perspective, if the market falls below the strong support level of 59,000, there is a trend of further retracement. After the market tested the resistance level of 73,000 for the second time, it fell again, breaking the support level of the round number 60,000. The KDJ indicator's three lines are diverging downwards, and the MACD indicator's green solid kinetic energy column has increased. Looking at the trend of the K-line over the past month and a half, there is currently a trend of profit-taking and exiting in the range of 60,000 to 70,000. Currently, the upper resistance is focused on the 64,500 level, and if it breaks, attention will be on the 68,000 resistance level. The lower support is focused on the 59,000 level. If it breaks, the market will most likely retrace to the 54,000 level. In summary, the current market shows signs of distribution by the institutions, so it is advisable to be cautious about chasing long positions and be careful of getting trapped at high levels. It is recommended to focus on short positions.
BTC Strategy Short at 64,300-64,600, stop loss at 65,600, targeting a profit range of 1000-1500
ETH Strategy Short at 3,180-3,200, stop loss at 3,280, targeting a profit range of 100-150 points

For real-time guidance, you can follow the public account: "币圈周胜男" or scan the QR code below to find "胜男" for real-time guidance.

It is often the last key that opens the door.
免责声明:本文章仅代表作者个人观点,不代表本平台的立场和观点。本文章仅供信息分享,不构成对任何人的任何投资建议。用户与作者之间的任何争议,与本平台无关。如网页中刊载的文章或图片涉及侵权,请提供相关的权利证明和身份证明发送邮件到support@aicoin.com,本平台相关工作人员将会进行核查。


