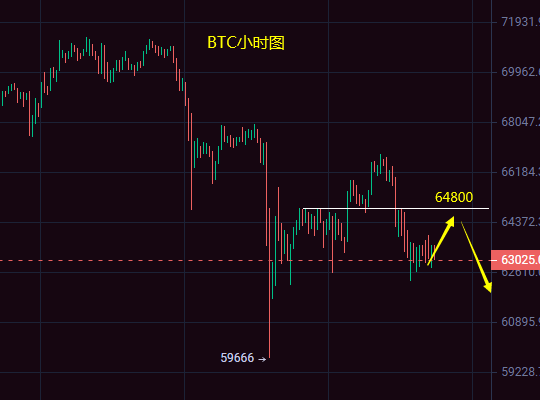
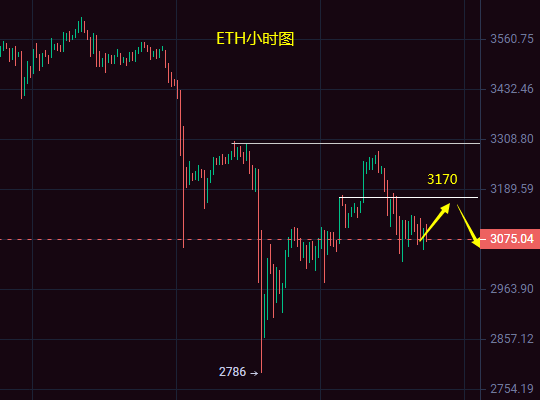
This week, Bitcoin is still leading with a bearish trend. The rebound from the day before yesterday did not continue, so the rebound is still a correction within the phase of decline. At least for now, the market has not given a short-term upward signal. However, yesterday's decline also needs attention. Although it retraced the gains from Sunday, it did not break the low. In our analysis of the trend, it is crucial to judge the continuity of the trend based on whether it breaks the high or low. Because not breaking the previous low during a decline means that the previous low serves as support. Support has two functions: first, it restrains the downward movement of the bears, and second, it provides a foundation for the bulls' rebound.
Looking back at yesterday's analysis, we emphasized that the current decline is not a reversal on the daily chart. The daily chart is still maintaining a high-level oscillating trend. The key support level at the bottom of the daily range is around 60800. Only when the daily chart effectively breaks this level in the form of a solid candlestick, does it constitute a breakthrough condition. Then the trend structure on the daily chart can confirm the breakthrough. In fact, judging this kind of pattern is just like predicting the breakthrough of 73000 in the previous bullish trend, they are just two completely opposite directions! Therefore, a rational analysis of the current market situation indicates that the bears have touched the bottom support and tested it, but it has not broken through yet. After the collapse at the top of the range last week, the bears naturally formed significant pressure in the short term. Some external factors also led to strong bearish sentiment in the market. Talking about breakthroughs is just a prediction, and specific accurate judgments can only be made based on the actual trend.
In the short term, yesterday Bitcoin surged and then fell back, retracing its gains. The key support level on the daily chart is at 68000. The price did not test this level yesterday. After the fall, the key short-term support below needs to focus on 62300. The four-hour chart has tested this level multiple times and has not been breached so far. If it is effectively broken, the bears will inevitably further decline. On the upside, the second drop yesterday was at 64850, which was also the resistance conversion level that was broken in the early trading yesterday. Therefore, intraday trading will continue to focus on this level for short positions, short-term rebound at 64850.

As for Ethereum, the breach of 3200 actually means a breakthrough. Last week, it directly fell below the previous low of 3050, while Bitcoin is still struggling at high levels. Ethereum simply laid its cards on the table. Since the unilateral continuous rise and breakthrough of the 4000 mark in February, it has been showing weakness, especially after the pullback from the peak, each wave is more aggressive than the last. Yesterday, it fell just above 3250 under pressure. This level was the key resistance level on the daily chart that we emphasized yesterday, and it is also a short position. The decline at this level indicates that the daily chart is still maintaining a downward trend. Intraday, focus on 3150-3170 for short-term rebound and short positions.

This article is an original creation by myself, Xiao Feng. The above analysis is only for personal reference. Investment carries risks, and entering the market requires caution. Please indicate the source if reposted!
免责声明:本文章仅代表作者个人观点,不代表本平台的立场和观点。本文章仅供信息分享,不构成对任何人的任何投资建议。用户与作者之间的任何争议,与本平台无关。如网页中刊载的文章或图片涉及侵权,请提供相关的权利证明和身份证明发送邮件到support@aicoin.com,本平台相关工作人员将会进行核查。


