This article is only a personal opinion on the market and does not constitute investment advice. If you operate according to this, you are responsible for your own gains and losses.
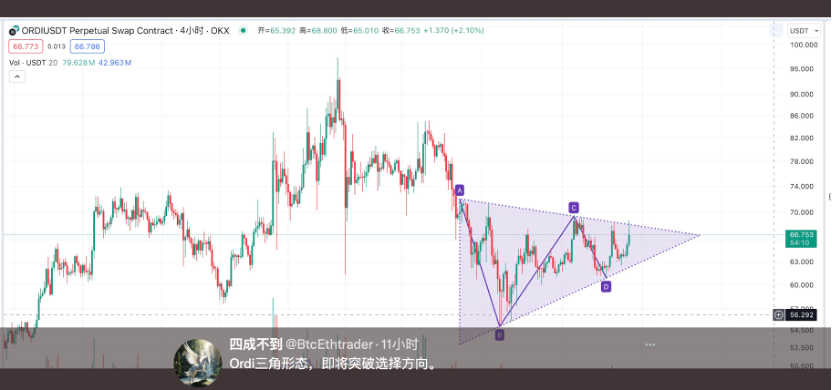
Yesterday, I hinted on Twitter that Ordi was on the verge of a triangle breakout, with the price around 66 at the time. Shortly after, the price completed its breakout, reaching a high of around 74.8 within the day.

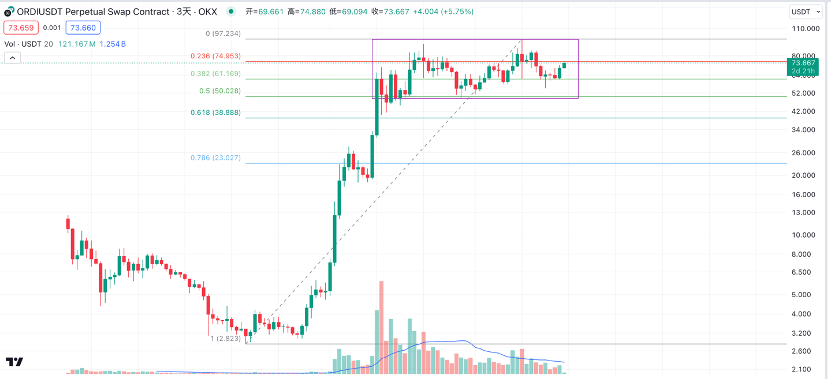
The price of 75 is just a Fibonacci technical resistance level. It is expected to continue the breakout soon. Just from the triangle pattern in the chart, a breakout could correspond to a price around 84.
More importantly, since reaching a high in December last year, Ordi has been oscillating widely for over four months, both in terms of time and magnitude. Previously, I mentioned my view on Ordi, believing that it could only reach 50 with a pin. Buying at the levels of 75 and 61 during the decline is quite good.
In fact, looking at the 3D level candlestick chart, the closing price has remained above 61, with the lowest pin dropping to around 55. As long as leverage is not used, spot trading at low levels has provided enough time for buying.

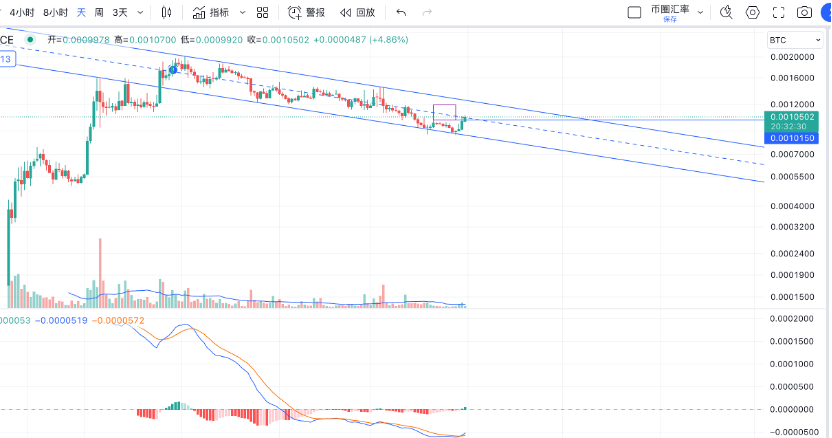
In general, for most currencies, the price bottom signifies the bottom of the BTC exchange rate. The price top also signifies the top of the BTC exchange rate. Due to the various ways of drawing waves and countless possibilities of changes during the process, having a relatively clear reference for the price top and bottom is very instructive for drawing waves.
From the chart below, it can be seen that Ordi's exchange rate peaked on January 2, when Ordi also reached a high of 92 on the same day, so January 2 is considered the end of an uptrend. The exchange rate reached its low on March 19 and March 28, forming a very clear double bottom structure, and has completed the breakout of the double bottom. Therefore, it can be considered that the low point on March 28 is the start of a new trend. In reality, Ordi's price reached its low on March 19.

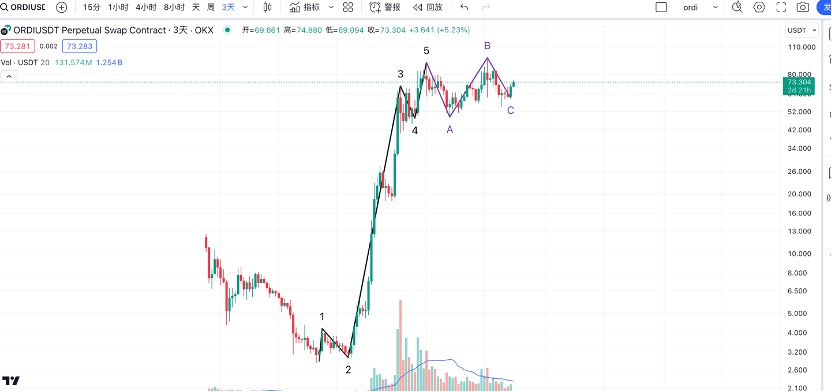
Based on the judgment of the above time points, I drew the waves of Ordi. The chart below shows the waves I drew at the 3D level. Ordi has completed a complete 5-wave uptrend. Considering the previous mention of the triangle breakout and the exchange rate's double bottom breakout, Ordi has likely completed its 2-wave correction and a new uptrend has begun.
The cryptocurrency market has always been about hyping the new, not the old. As a new concept in this round, the inscription sector should be given a certain amount of holding and patience. As a leader in this sector, Ordi is expected to provide corresponding returns.

Follow me to maximize trend profits with minimal operations.

免责声明:本文章仅代表作者个人观点,不代表本平台的立场和观点。本文章仅供信息分享,不构成对任何人的任何投资建议。用户与作者之间的任何争议,与本平台无关。如网页中刊载的文章或图片涉及侵权,请提供相关的权利证明和身份证明发送邮件到support@aicoin.com,本平台相关工作人员将会进行核查。


