On the evening of March 26th, AICoin researchers conducted a live graphic and text sharing of "The Magical Nine Transformations, TD Automated Profit Rule (with Membership)" in the AICoin PC-end Group Chat Live. Here is a summary of the live content.
I. Sharing of Functions
Using Xiao A to view BTC
Asking Xiao A: BTC

Xiao A's reply:
Xiao A provides buy and sell points
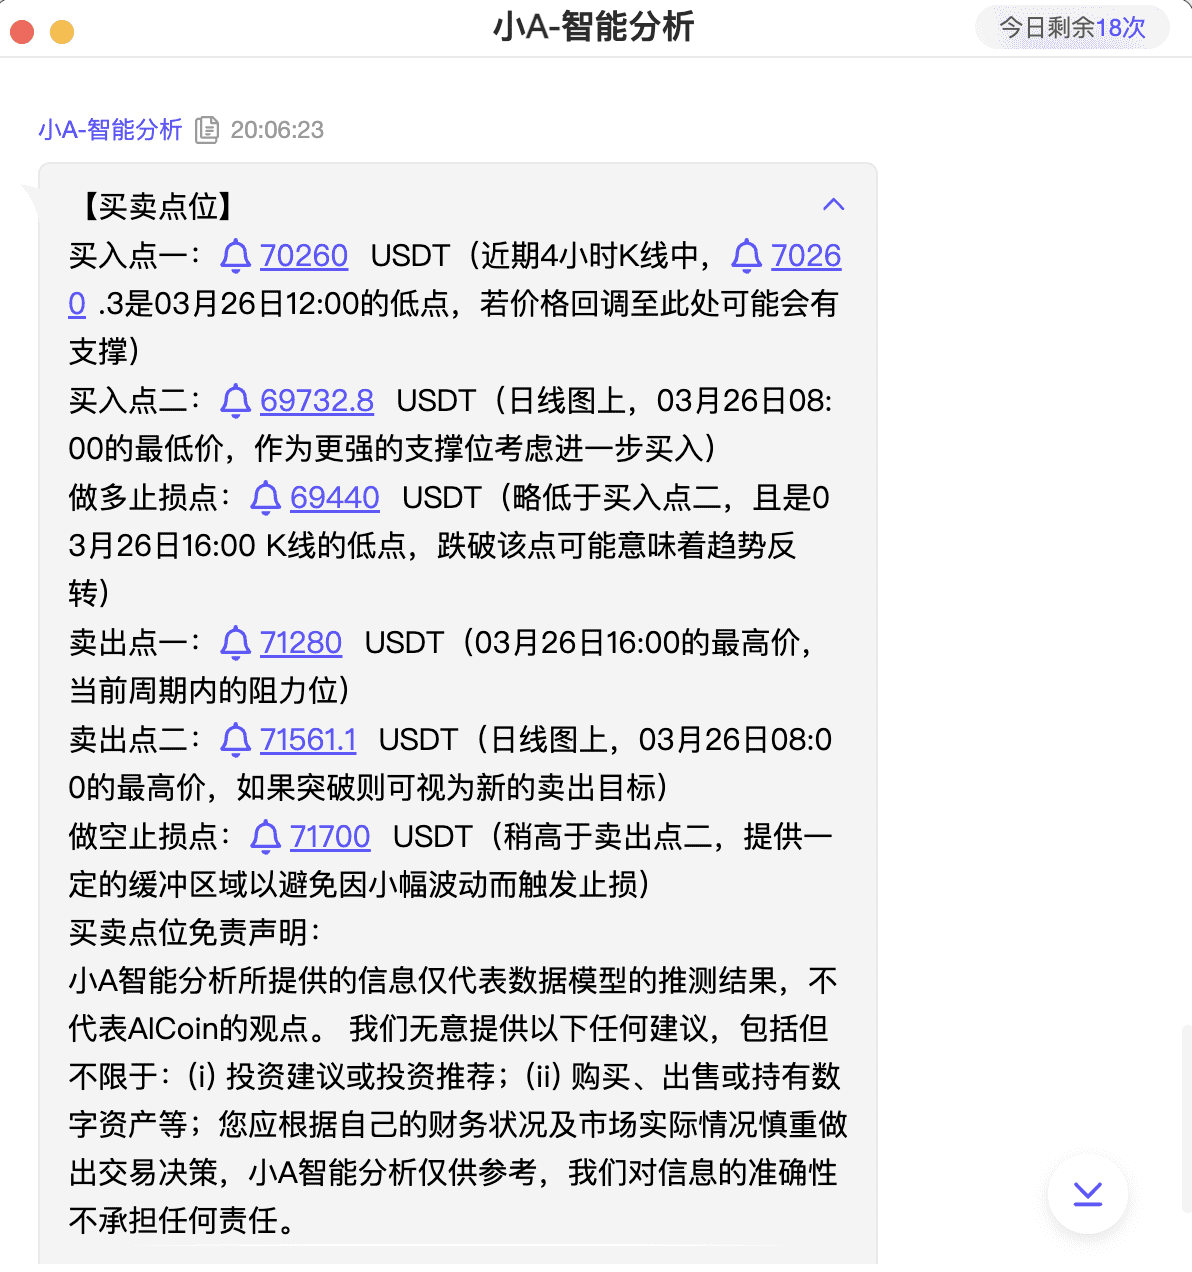
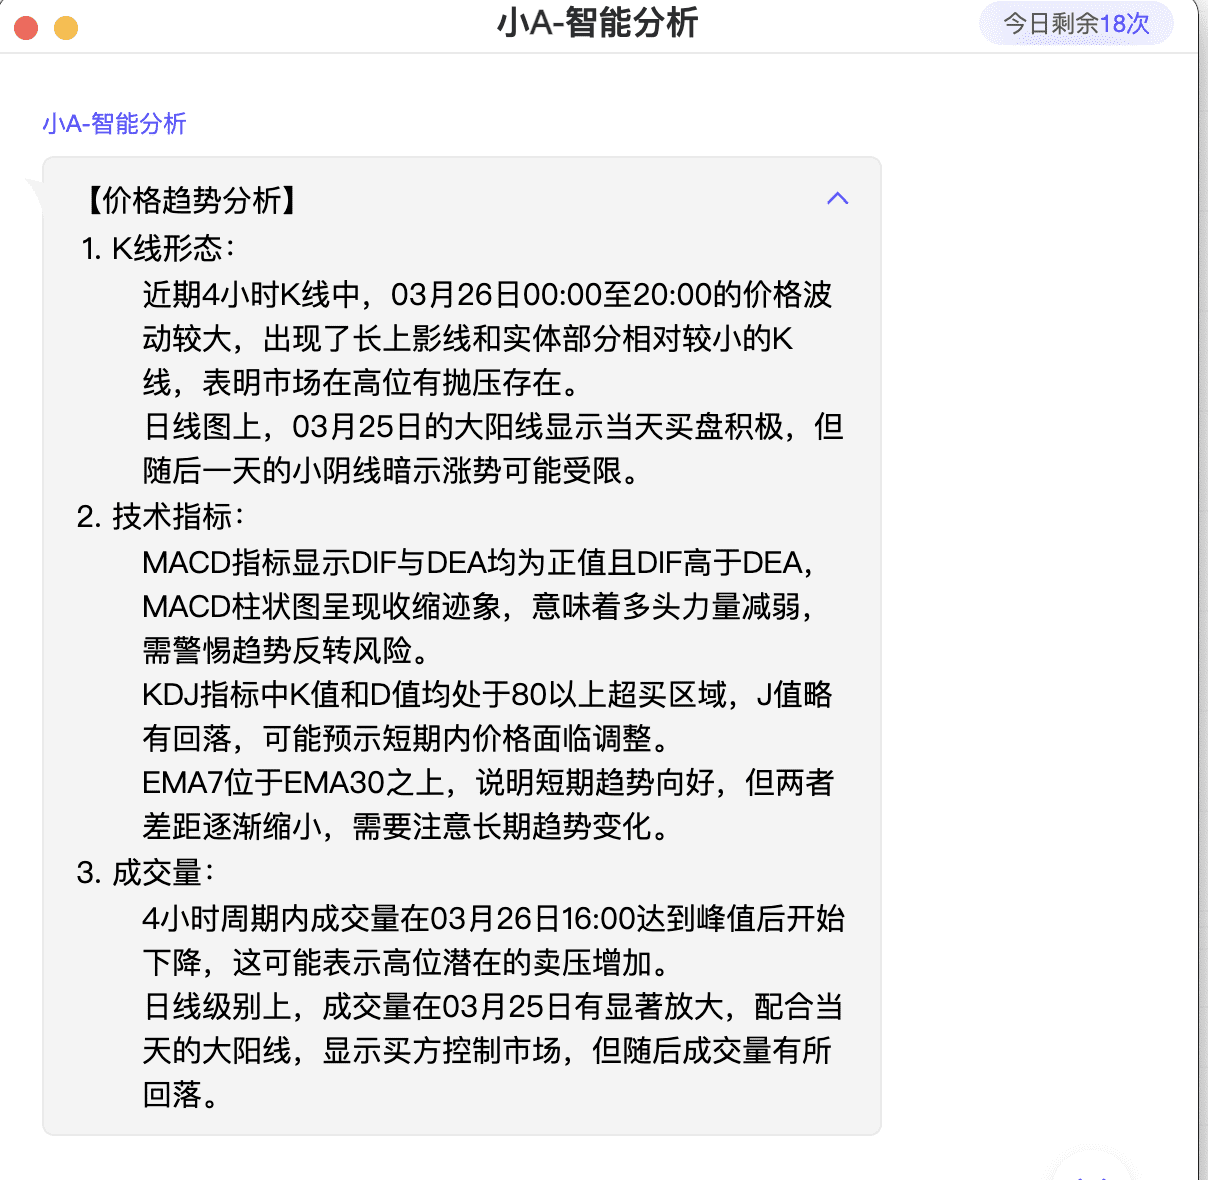
Analysis results by Xiao A

Xiao A's analysis of market positioning
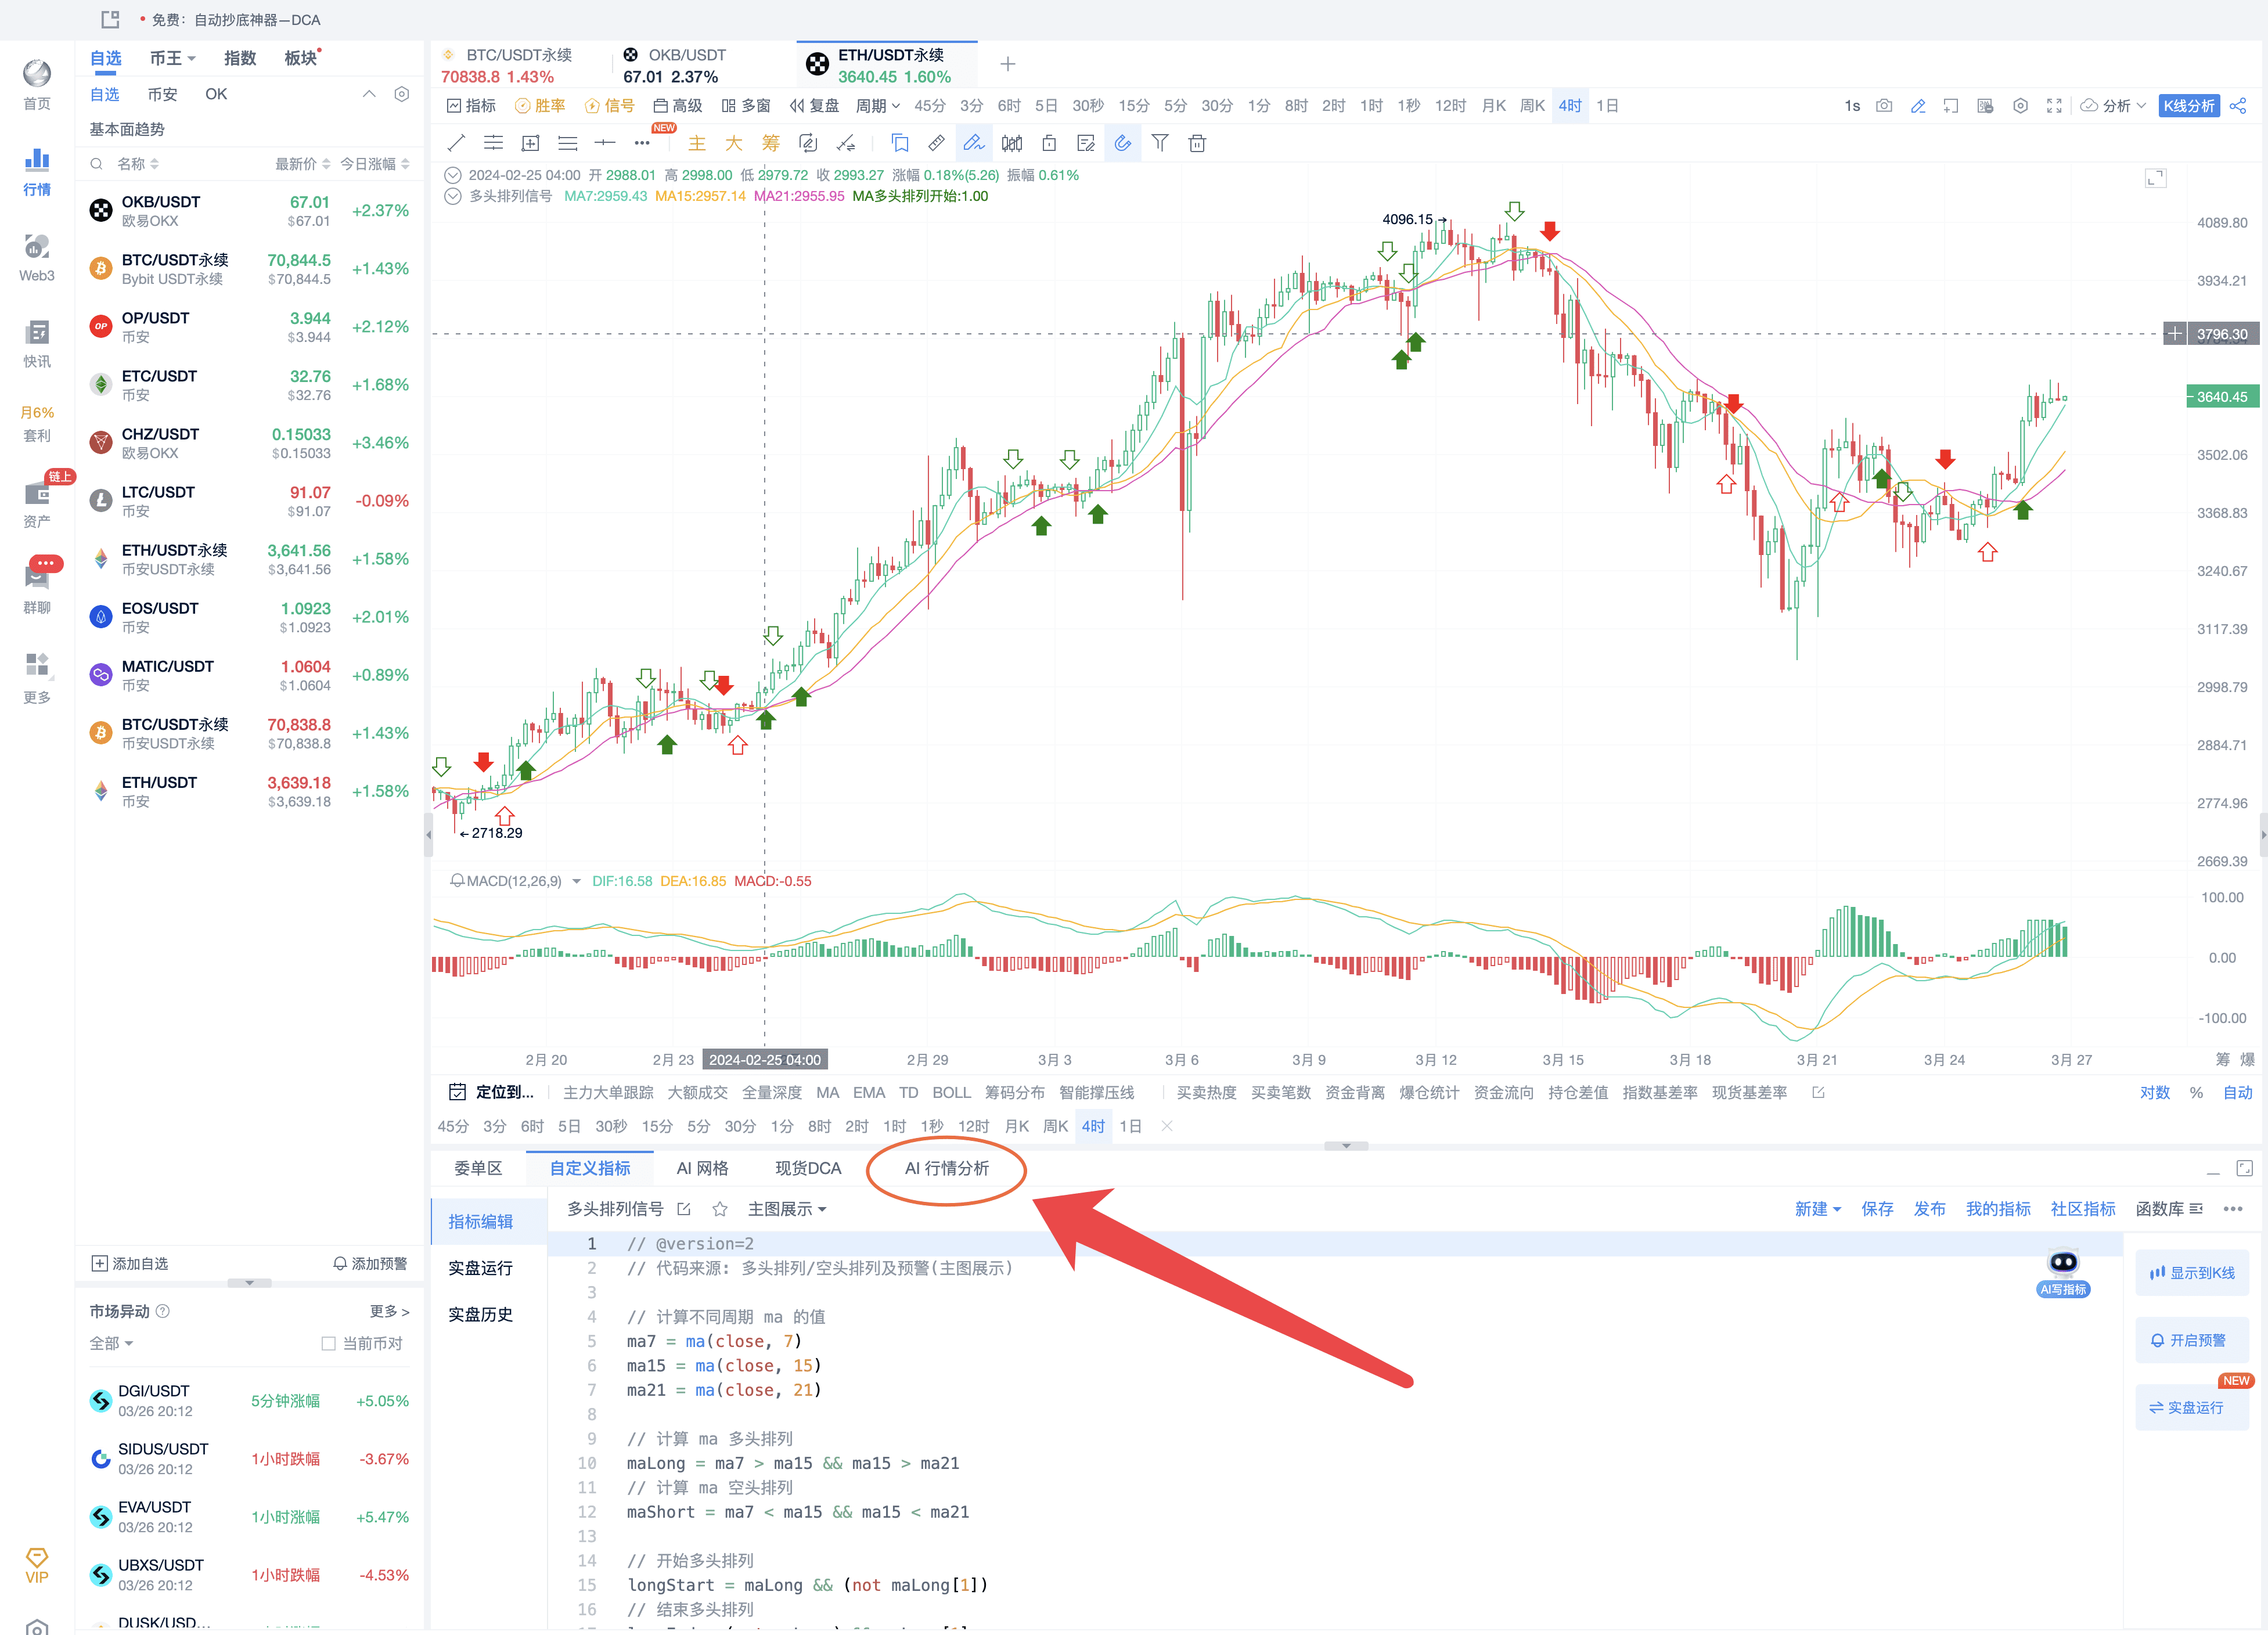
Opening PRO allows for more Xiao A analysis of currency pairs, analyzing positions at any time; there are at least 8 position analyses per day, making it easy for novice users to grasp the market; for experienced traders with their own trading systems, they can customize their own indicators with the help of the editor, which can help them place orders automatically. Click the link below to open and experience: https://aicoin.app/zh-CN/vip/chartpro
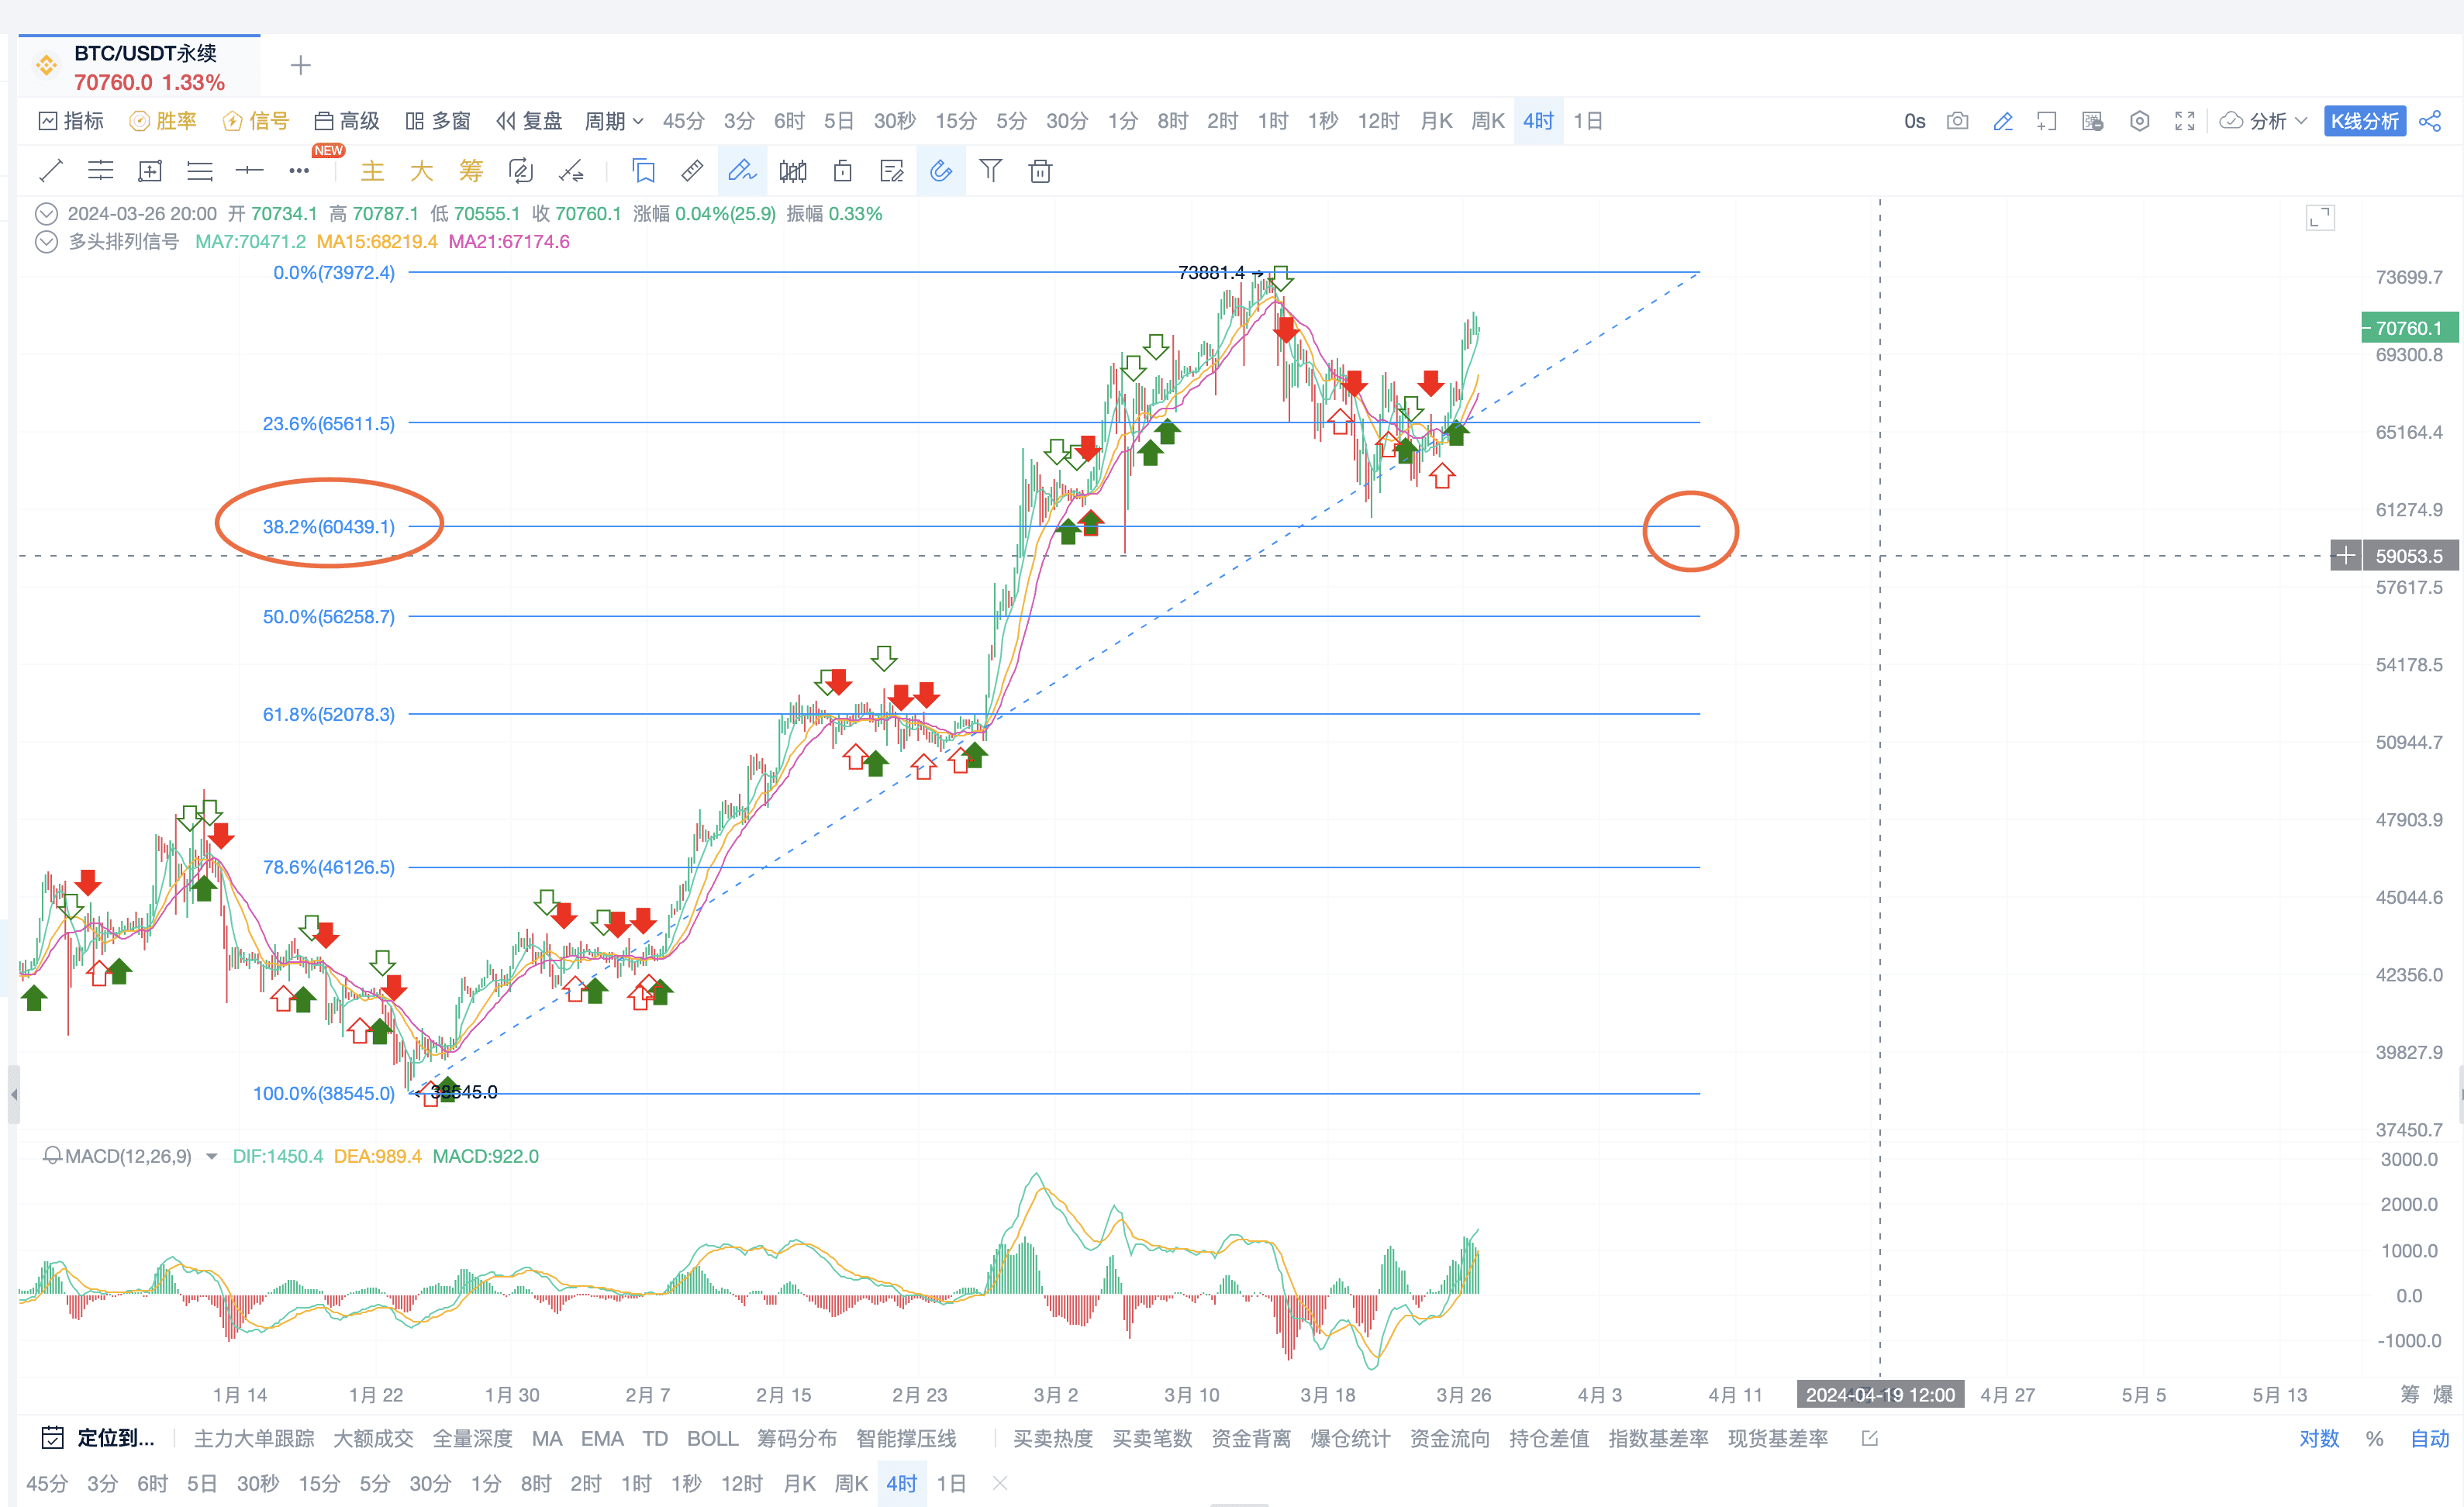
Using Fibonacci
Click to use the Fibonacci retracement line as shown in the figure
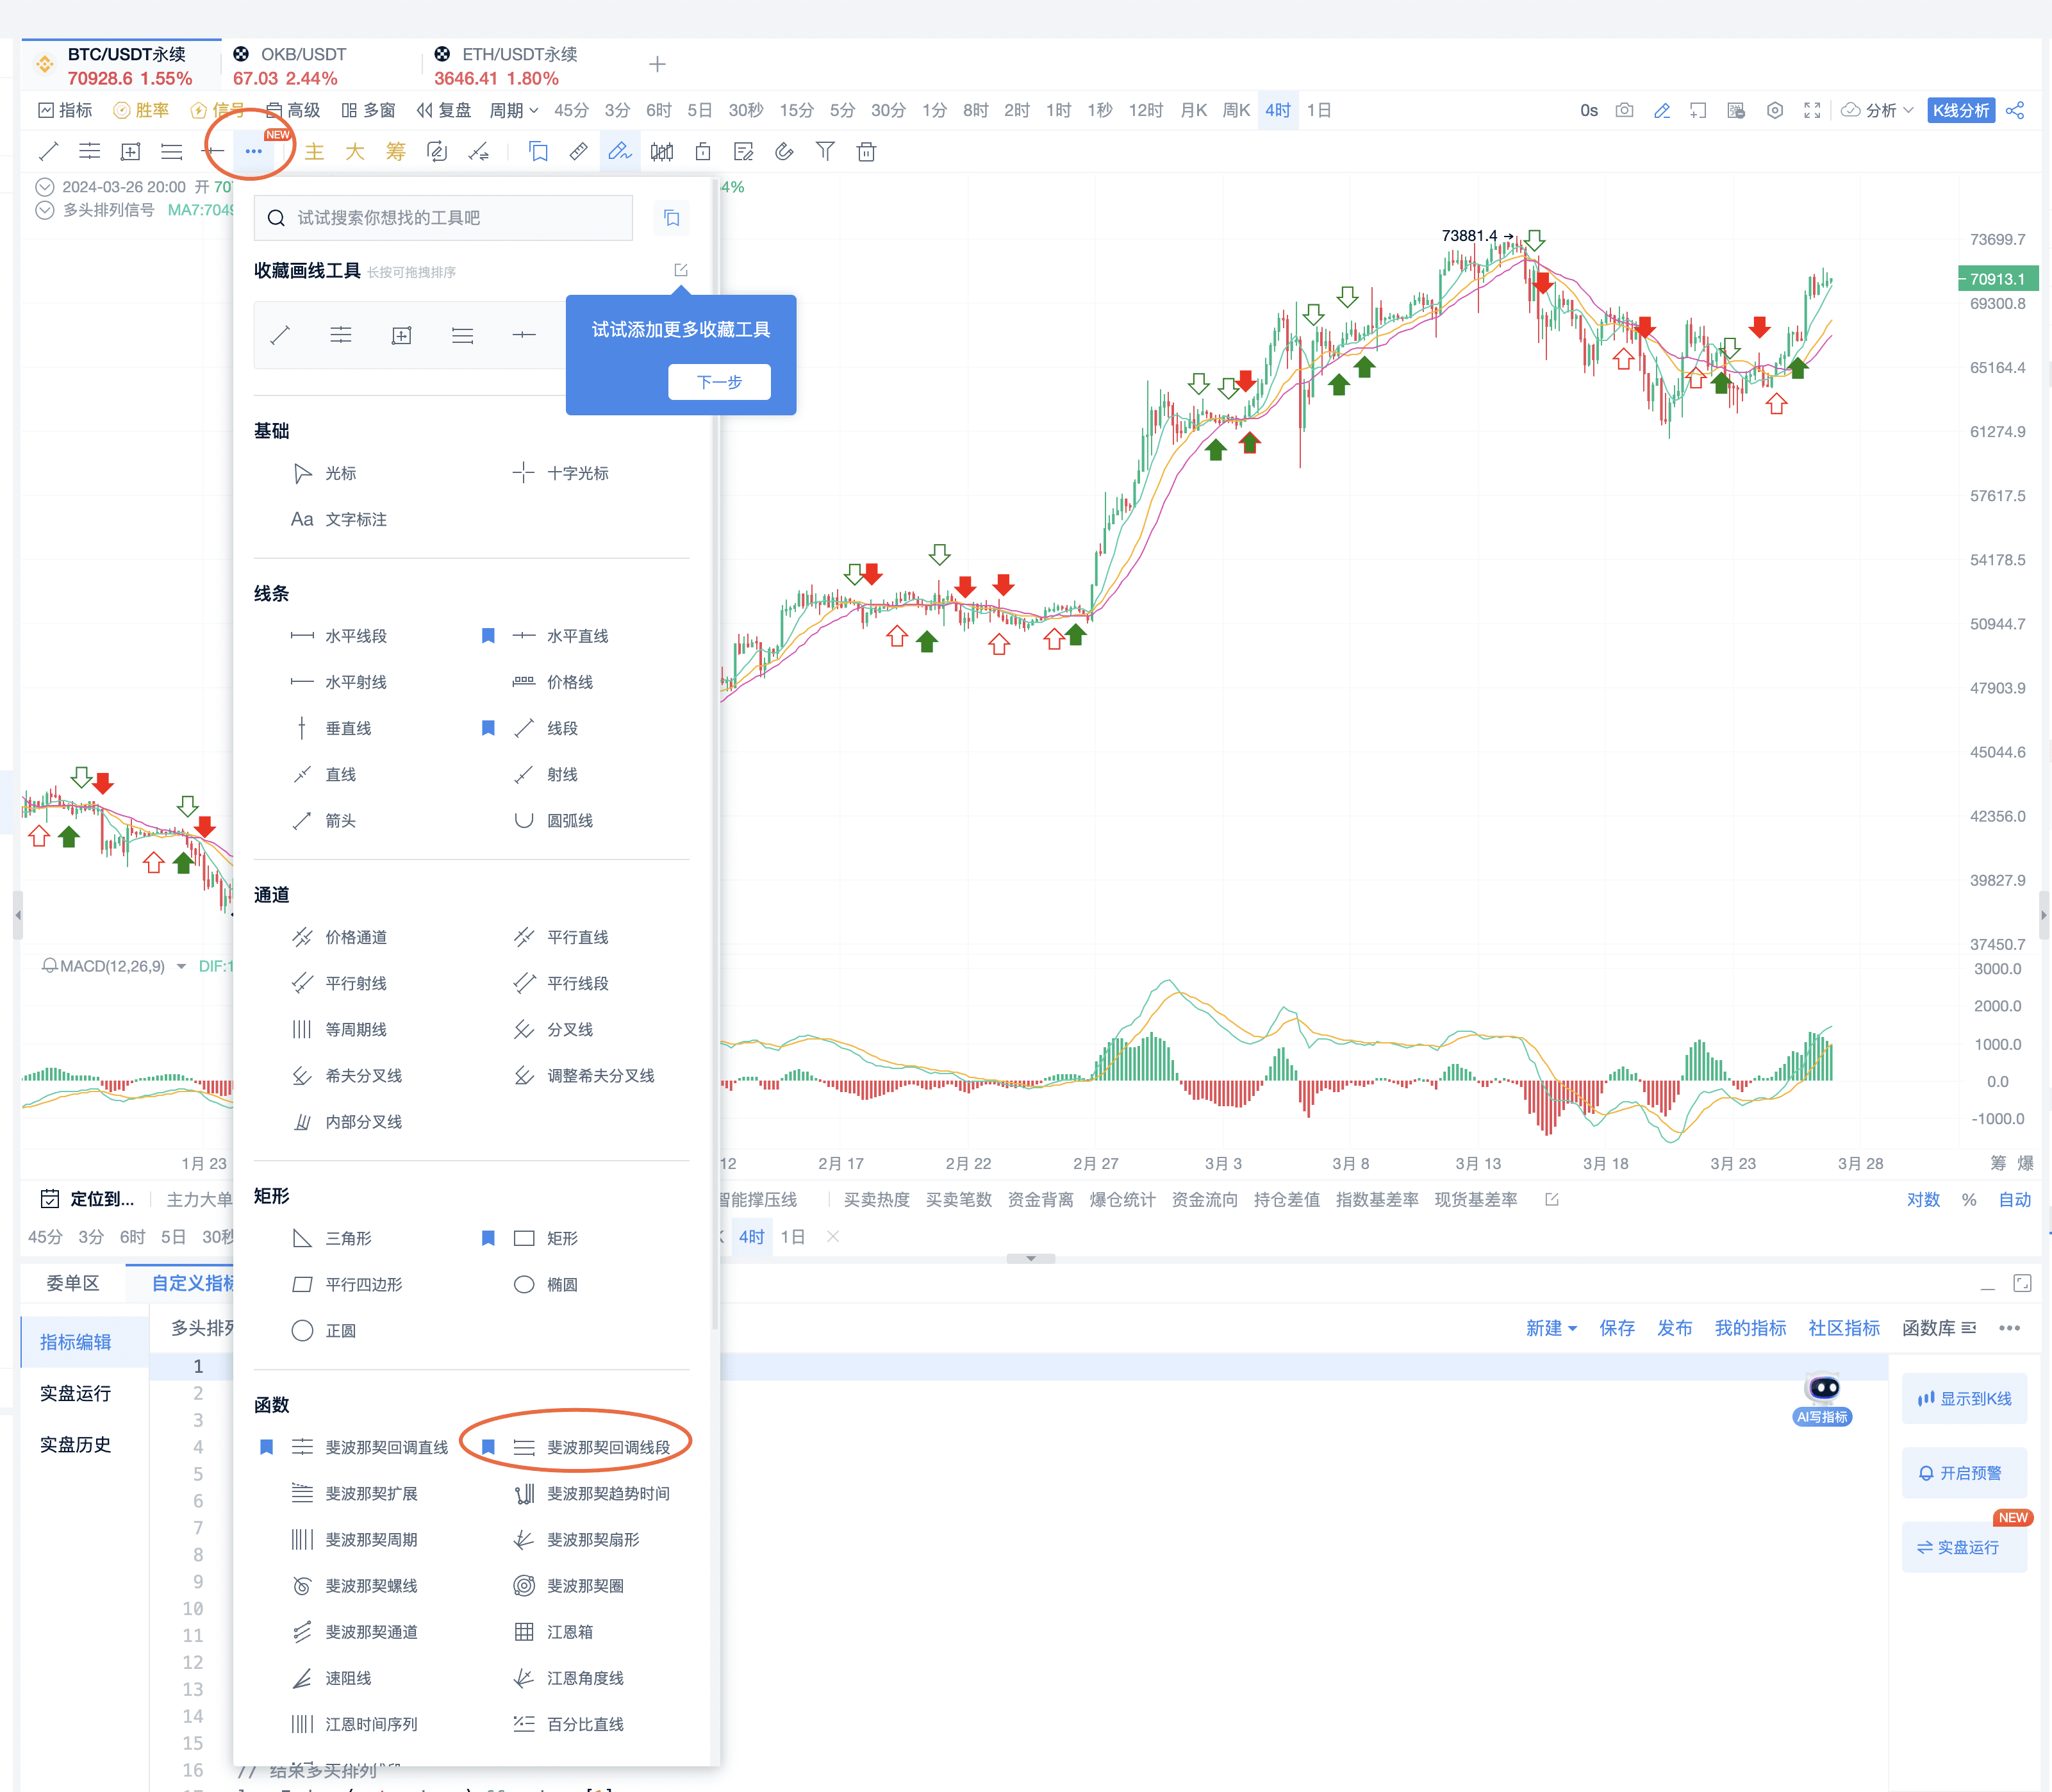
Then select a period, find the starting point of the next market movement within this period, pull upwards, and find the high point of this market movement
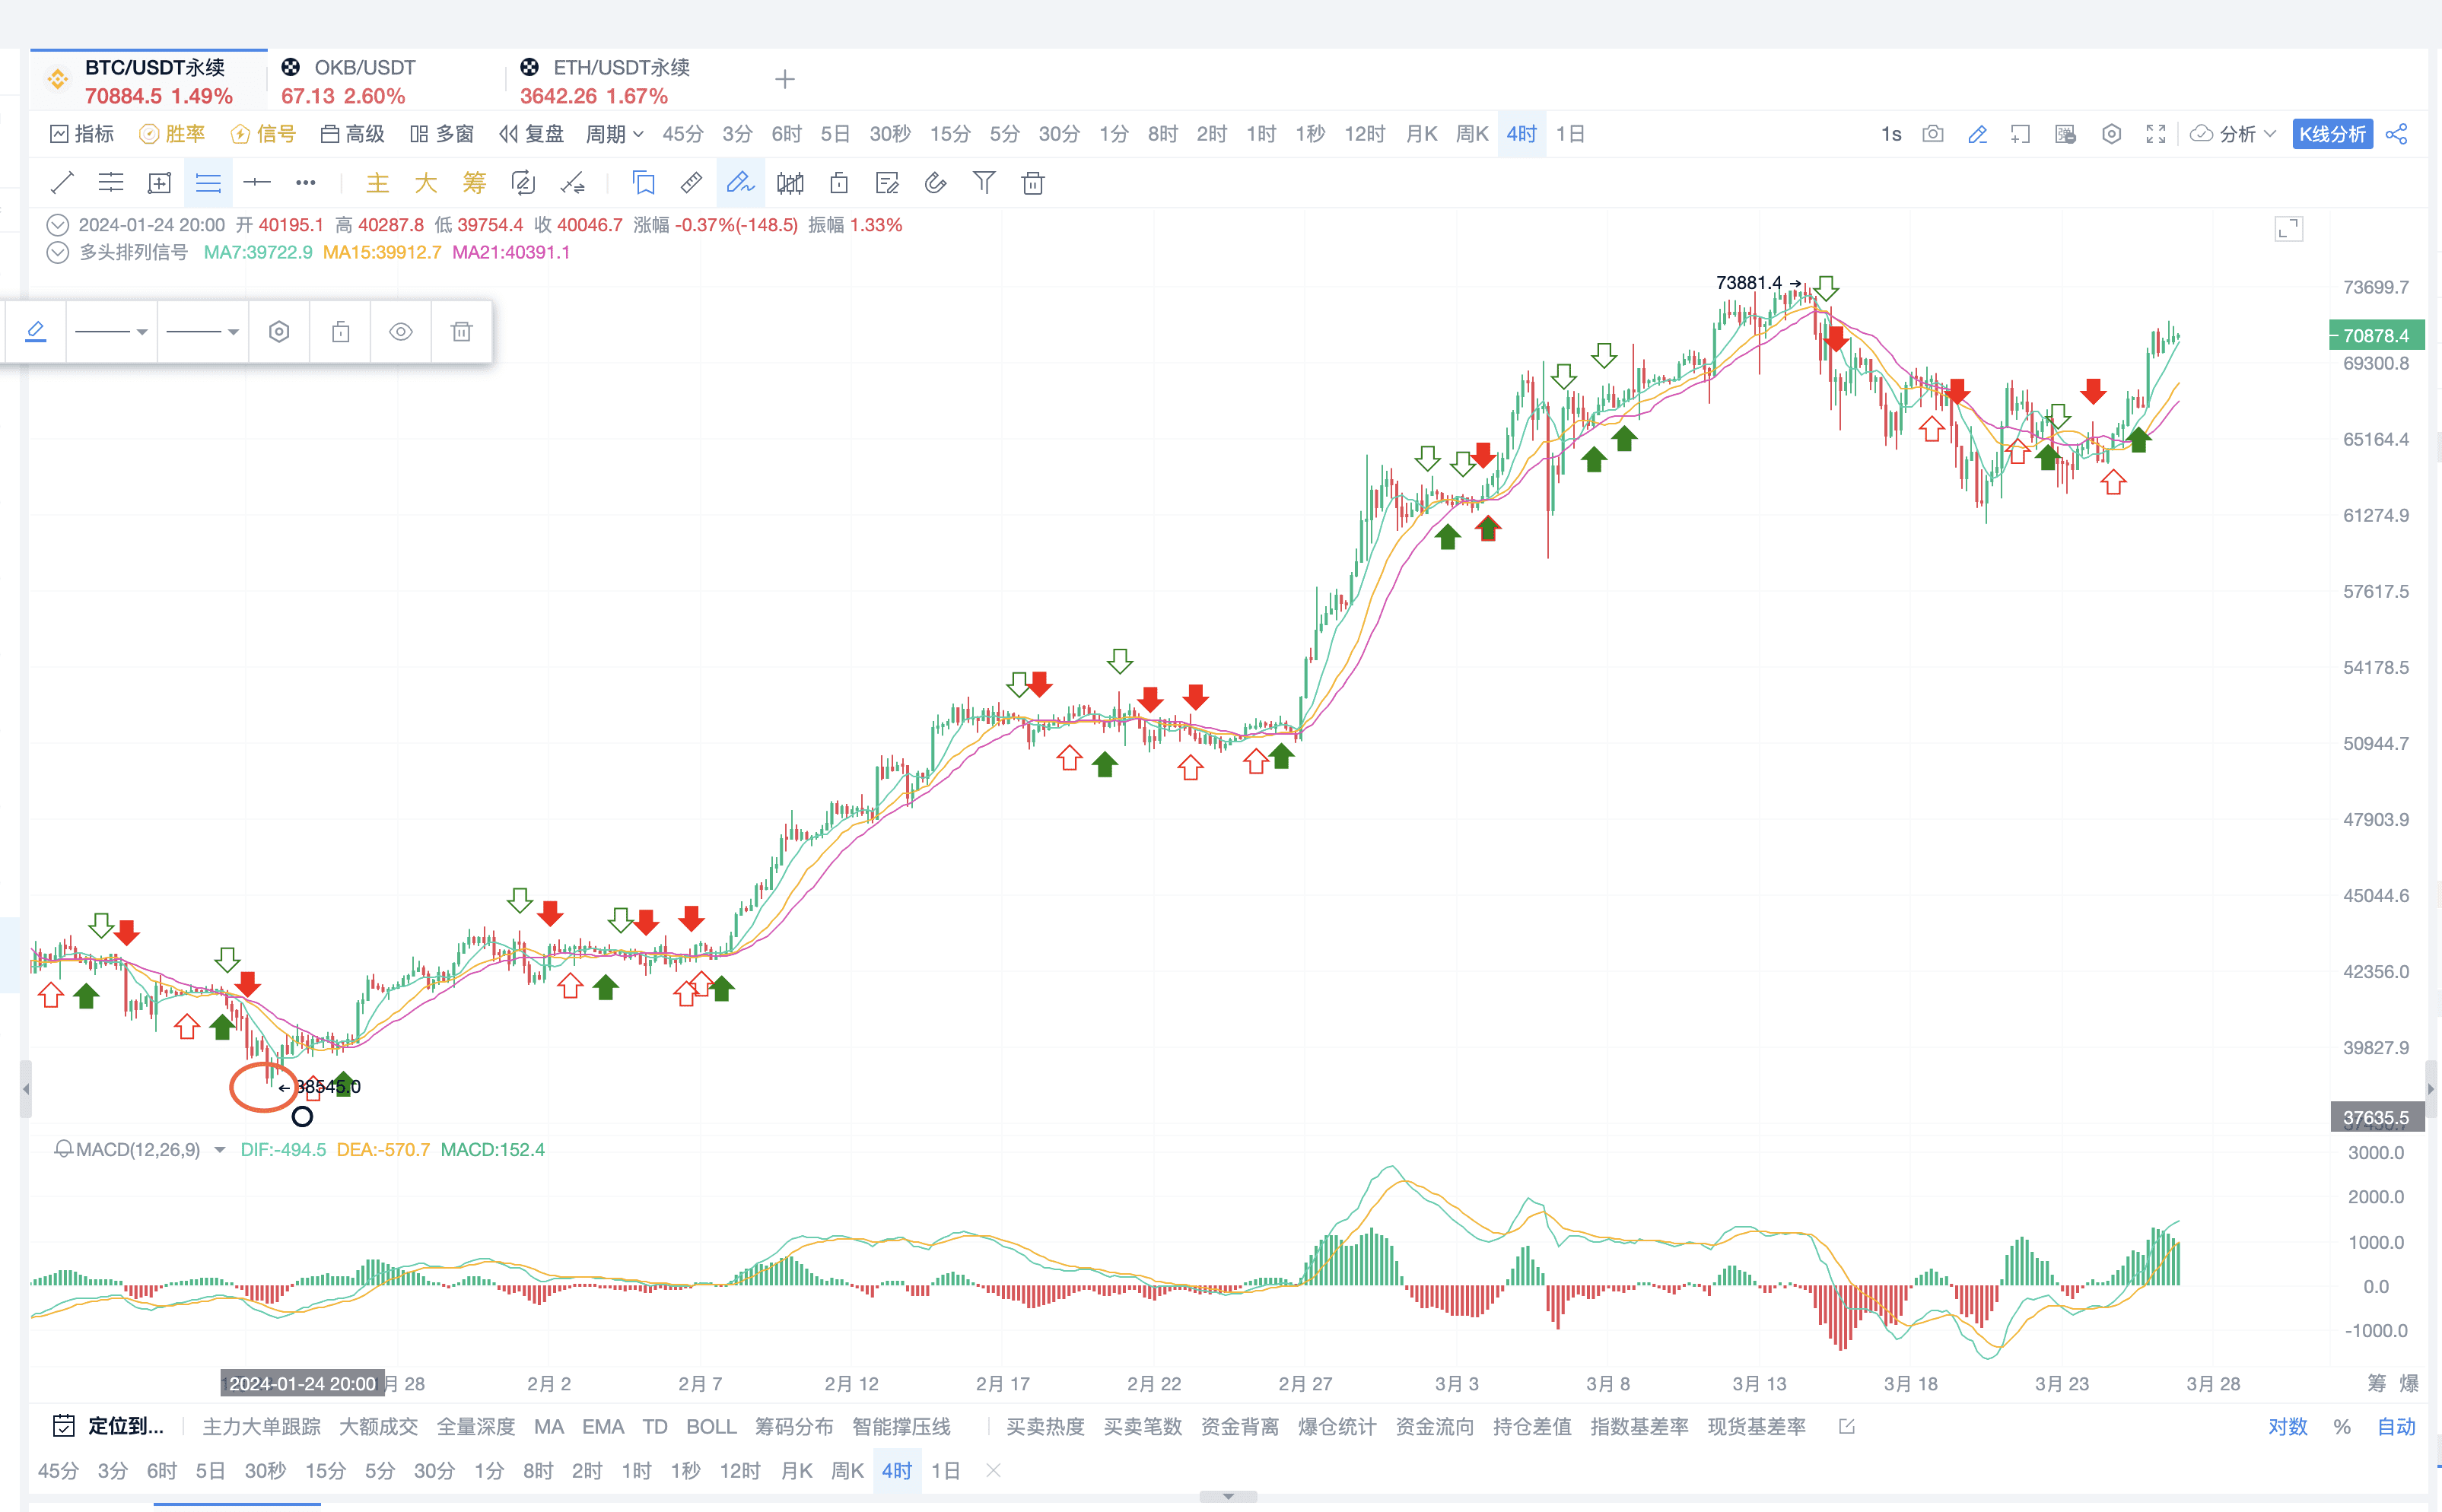
When this market movement retraces above 0.382, strong support appears; combined with Xiao A's analysis, it is possible to go long on the retracement.
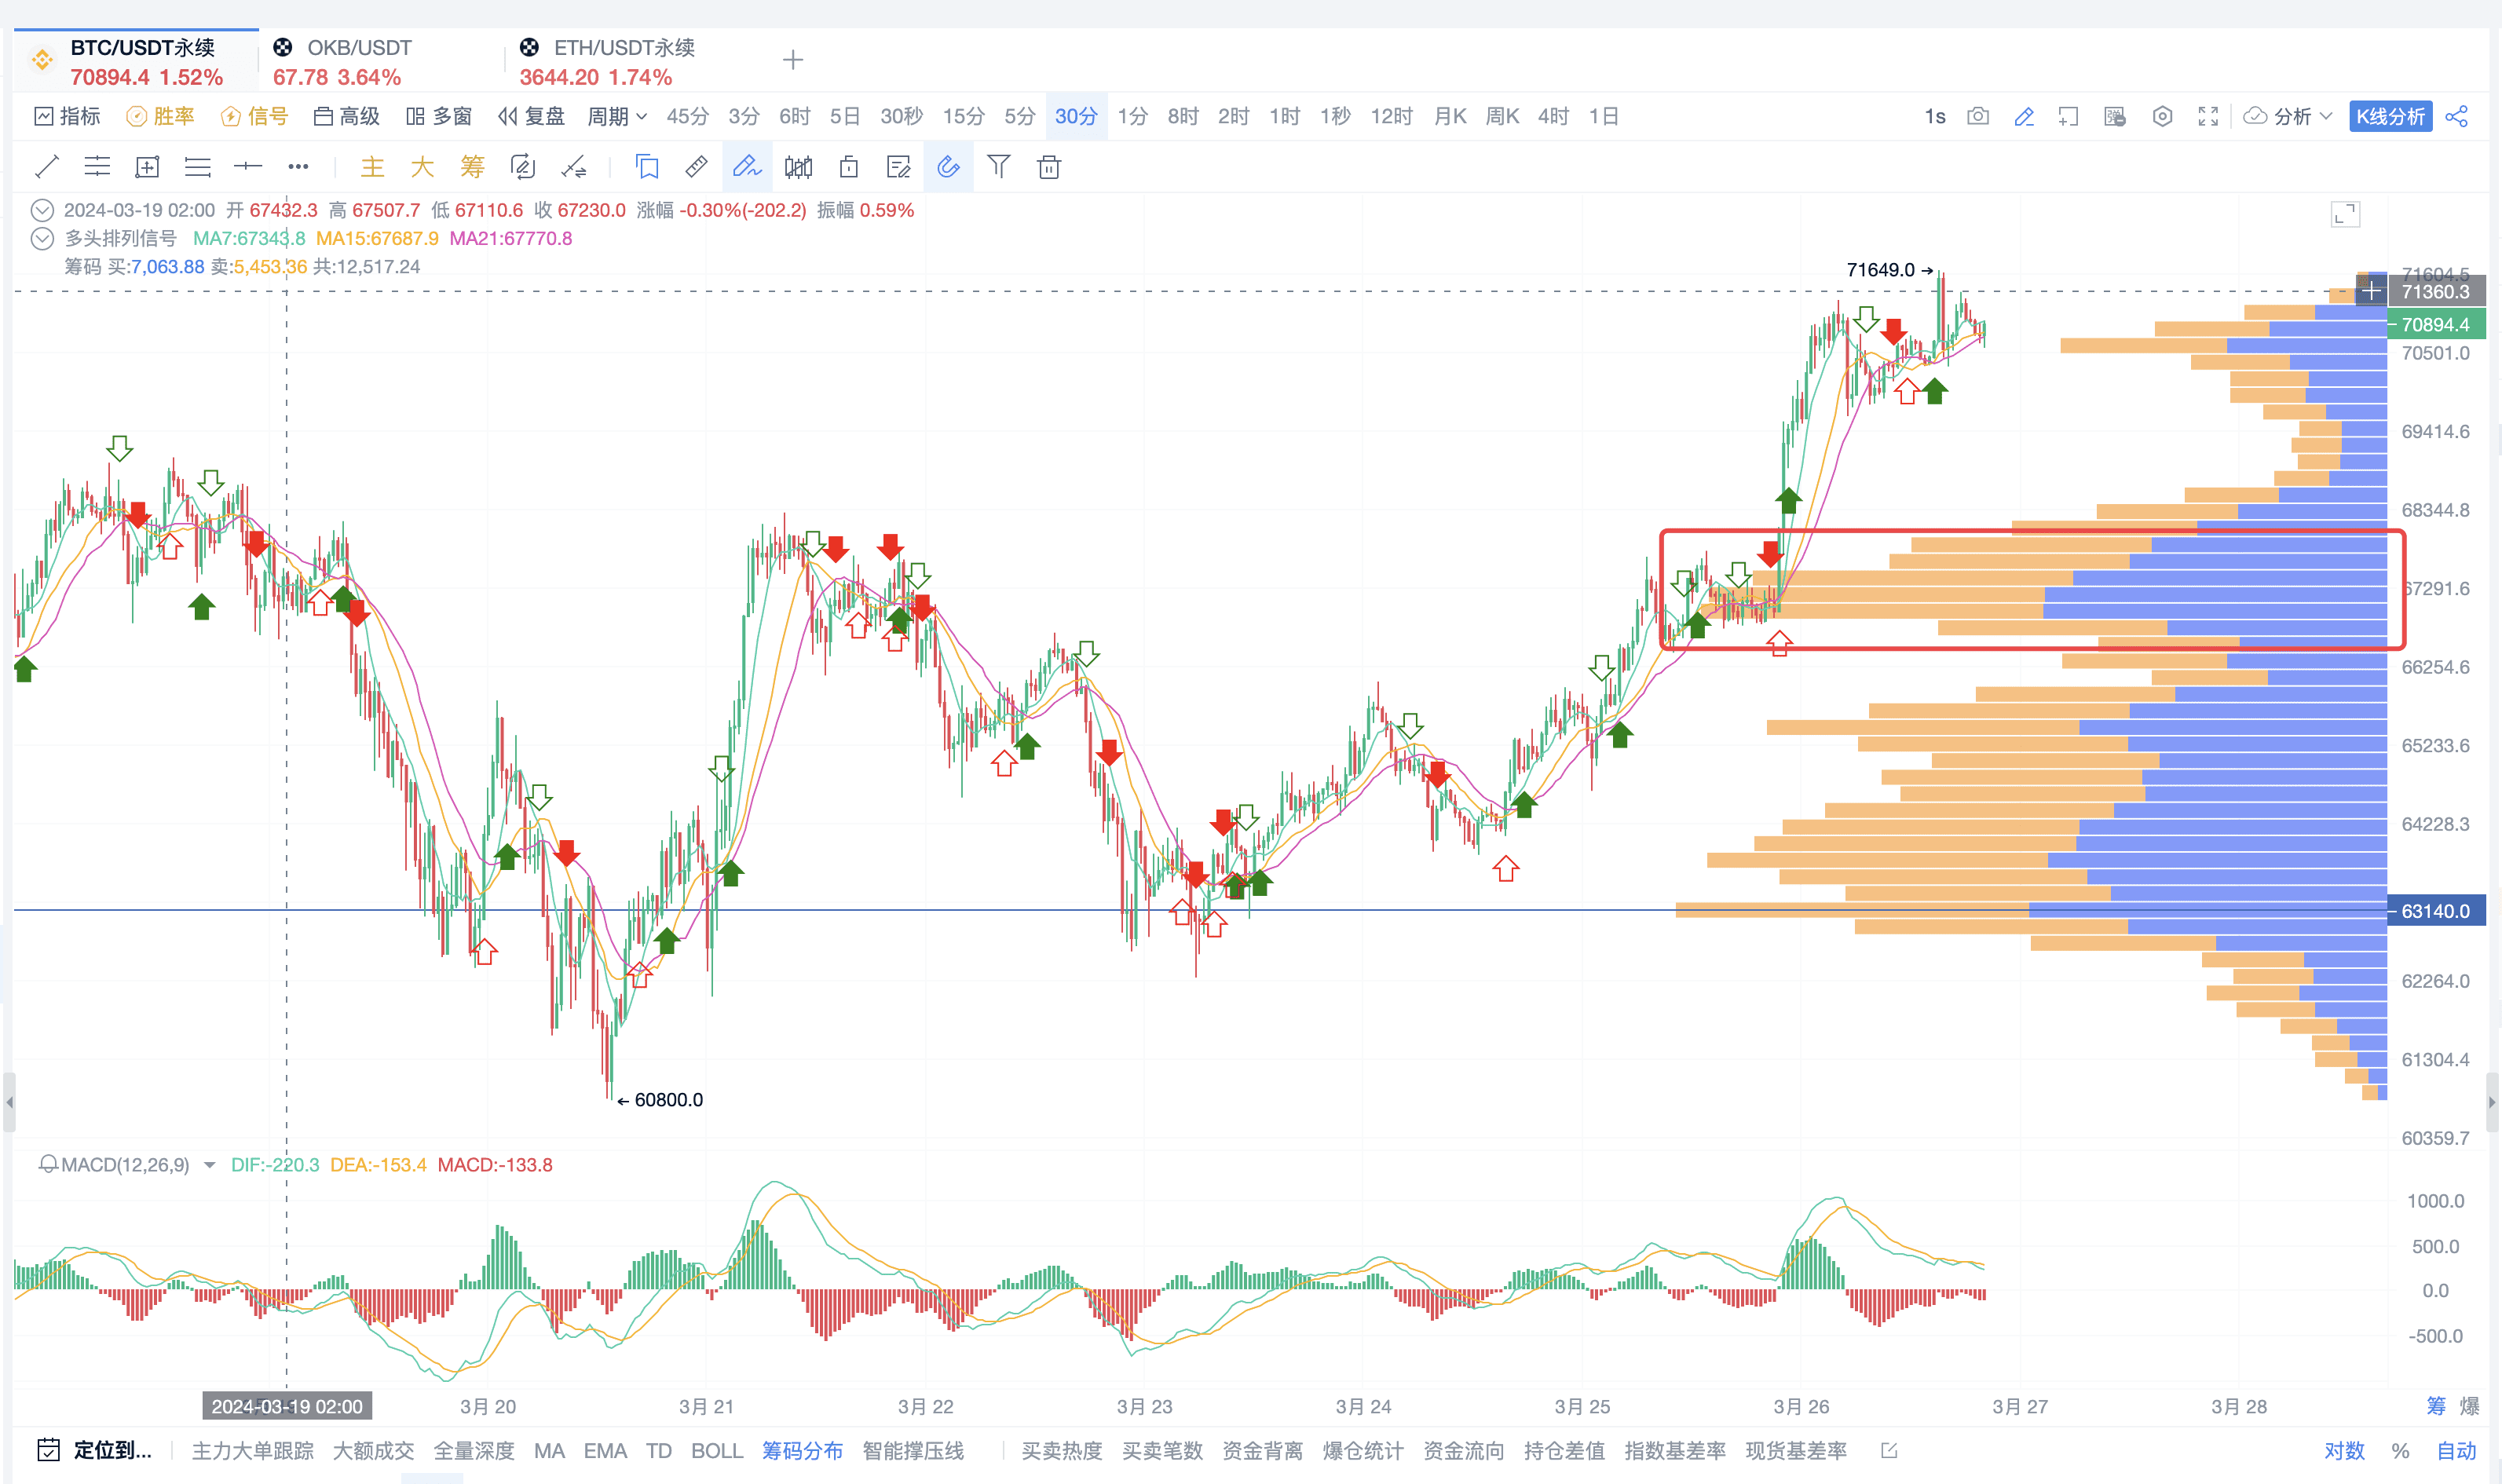
Chip distribution
It is recommended to look at the chip peak for chip distribution
Application method: If the price falls below the chip peak, there will be strong support here; it can be used as a reference for opening positions, calculating stop-loss and take-profit, and profit-loss ratio.
For example, in the 30-minute chart below, there is strong support here
Teach you how to identify main force behavior with chip distribution
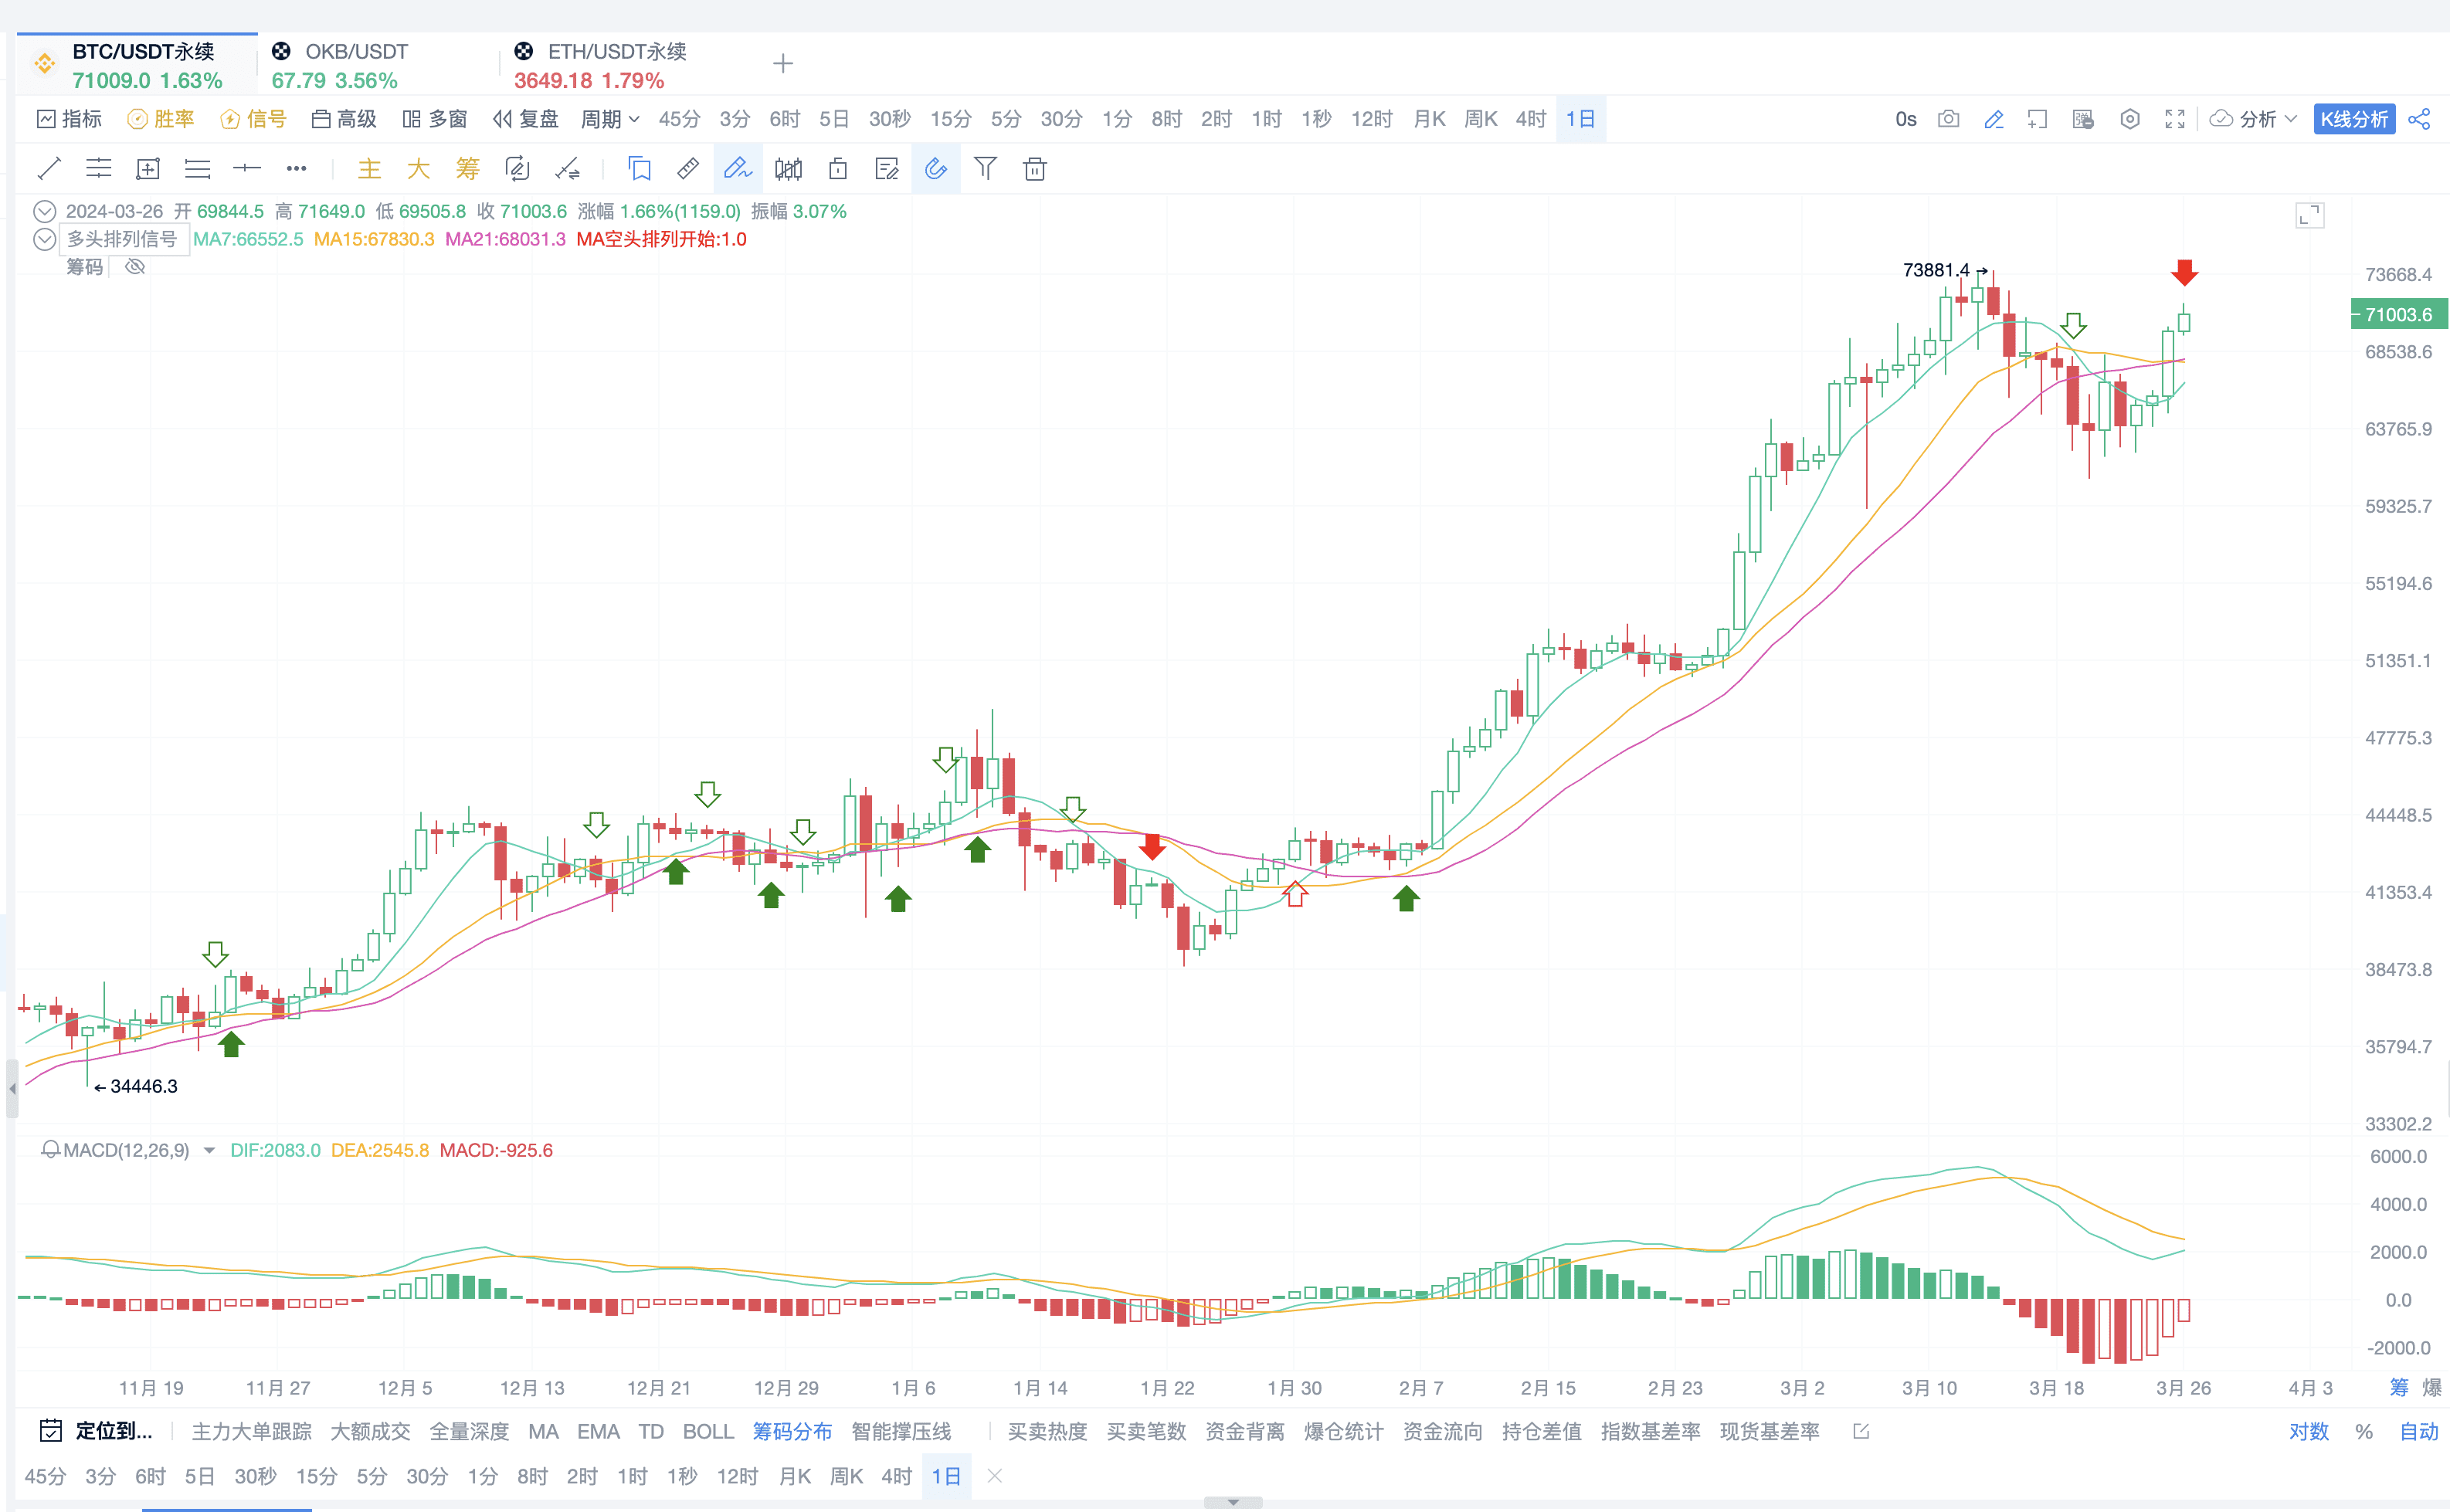
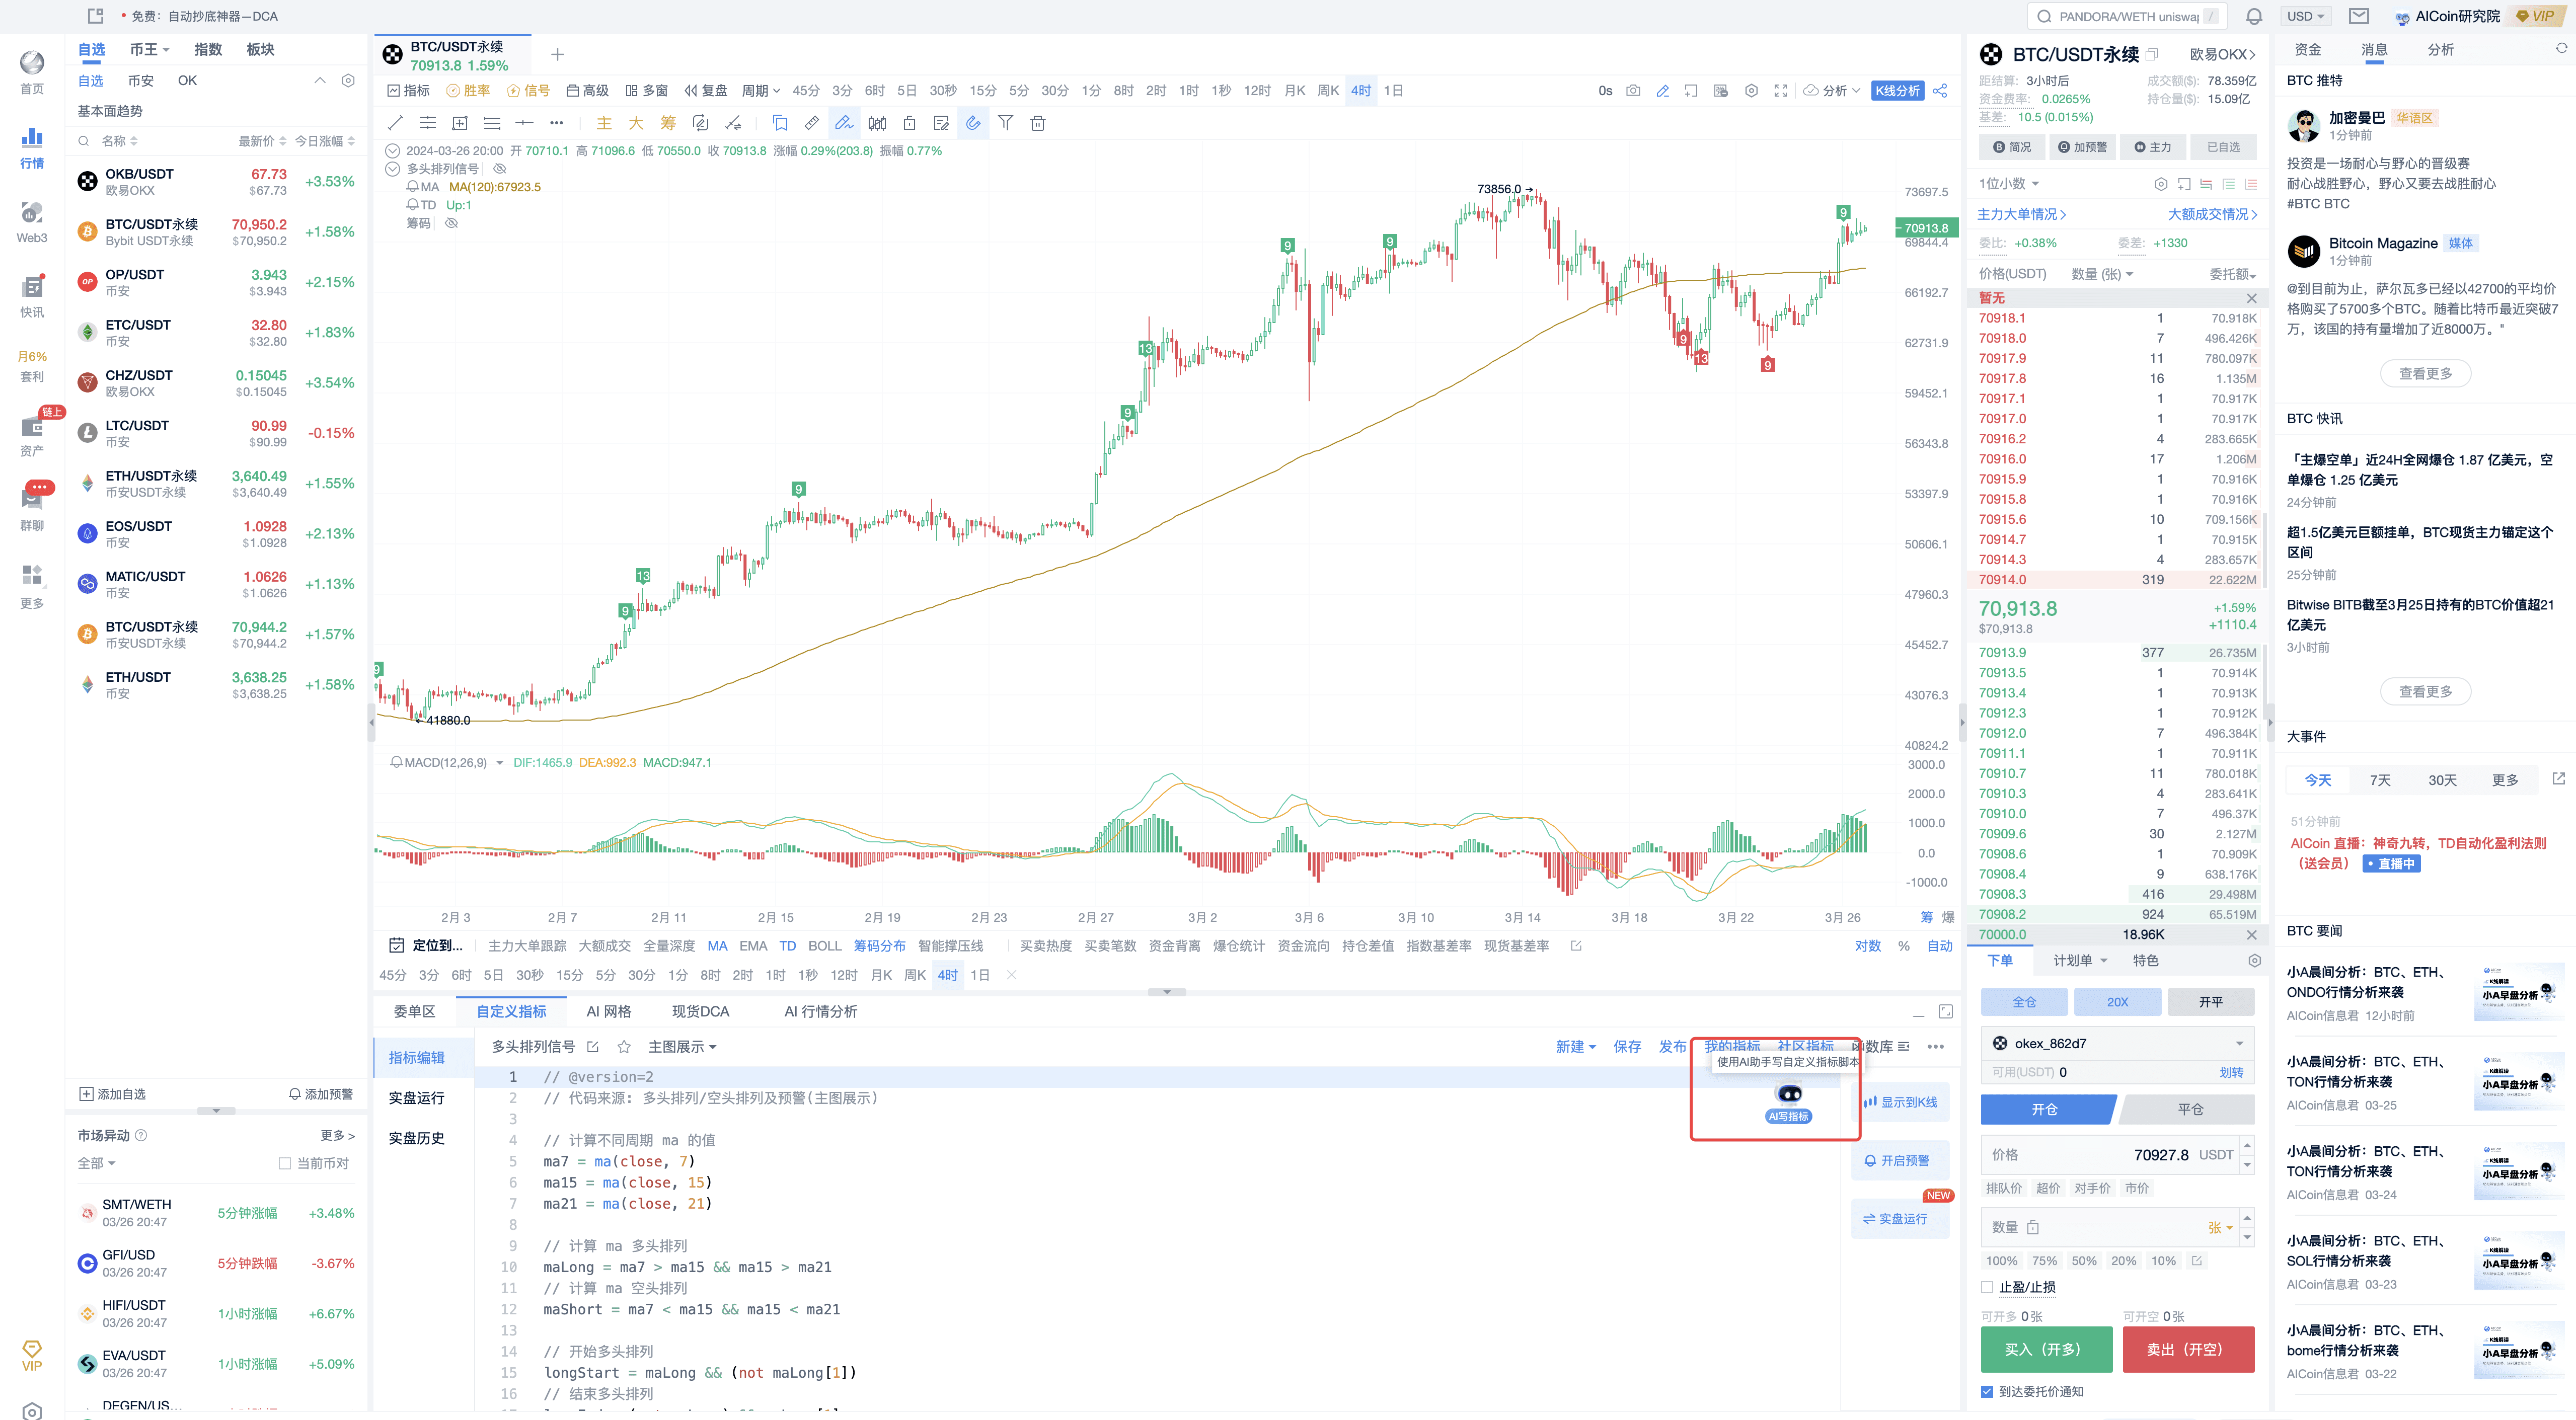
Custom indicator - Bullish arrangement
As shown in the daily chart, a bullish arrangement is about to form; the bottom MACD is once again pulling back to the zero axis crossover.
Continue to track and wait for the bullish arrangement signal, pay attention to the MACD pullback.
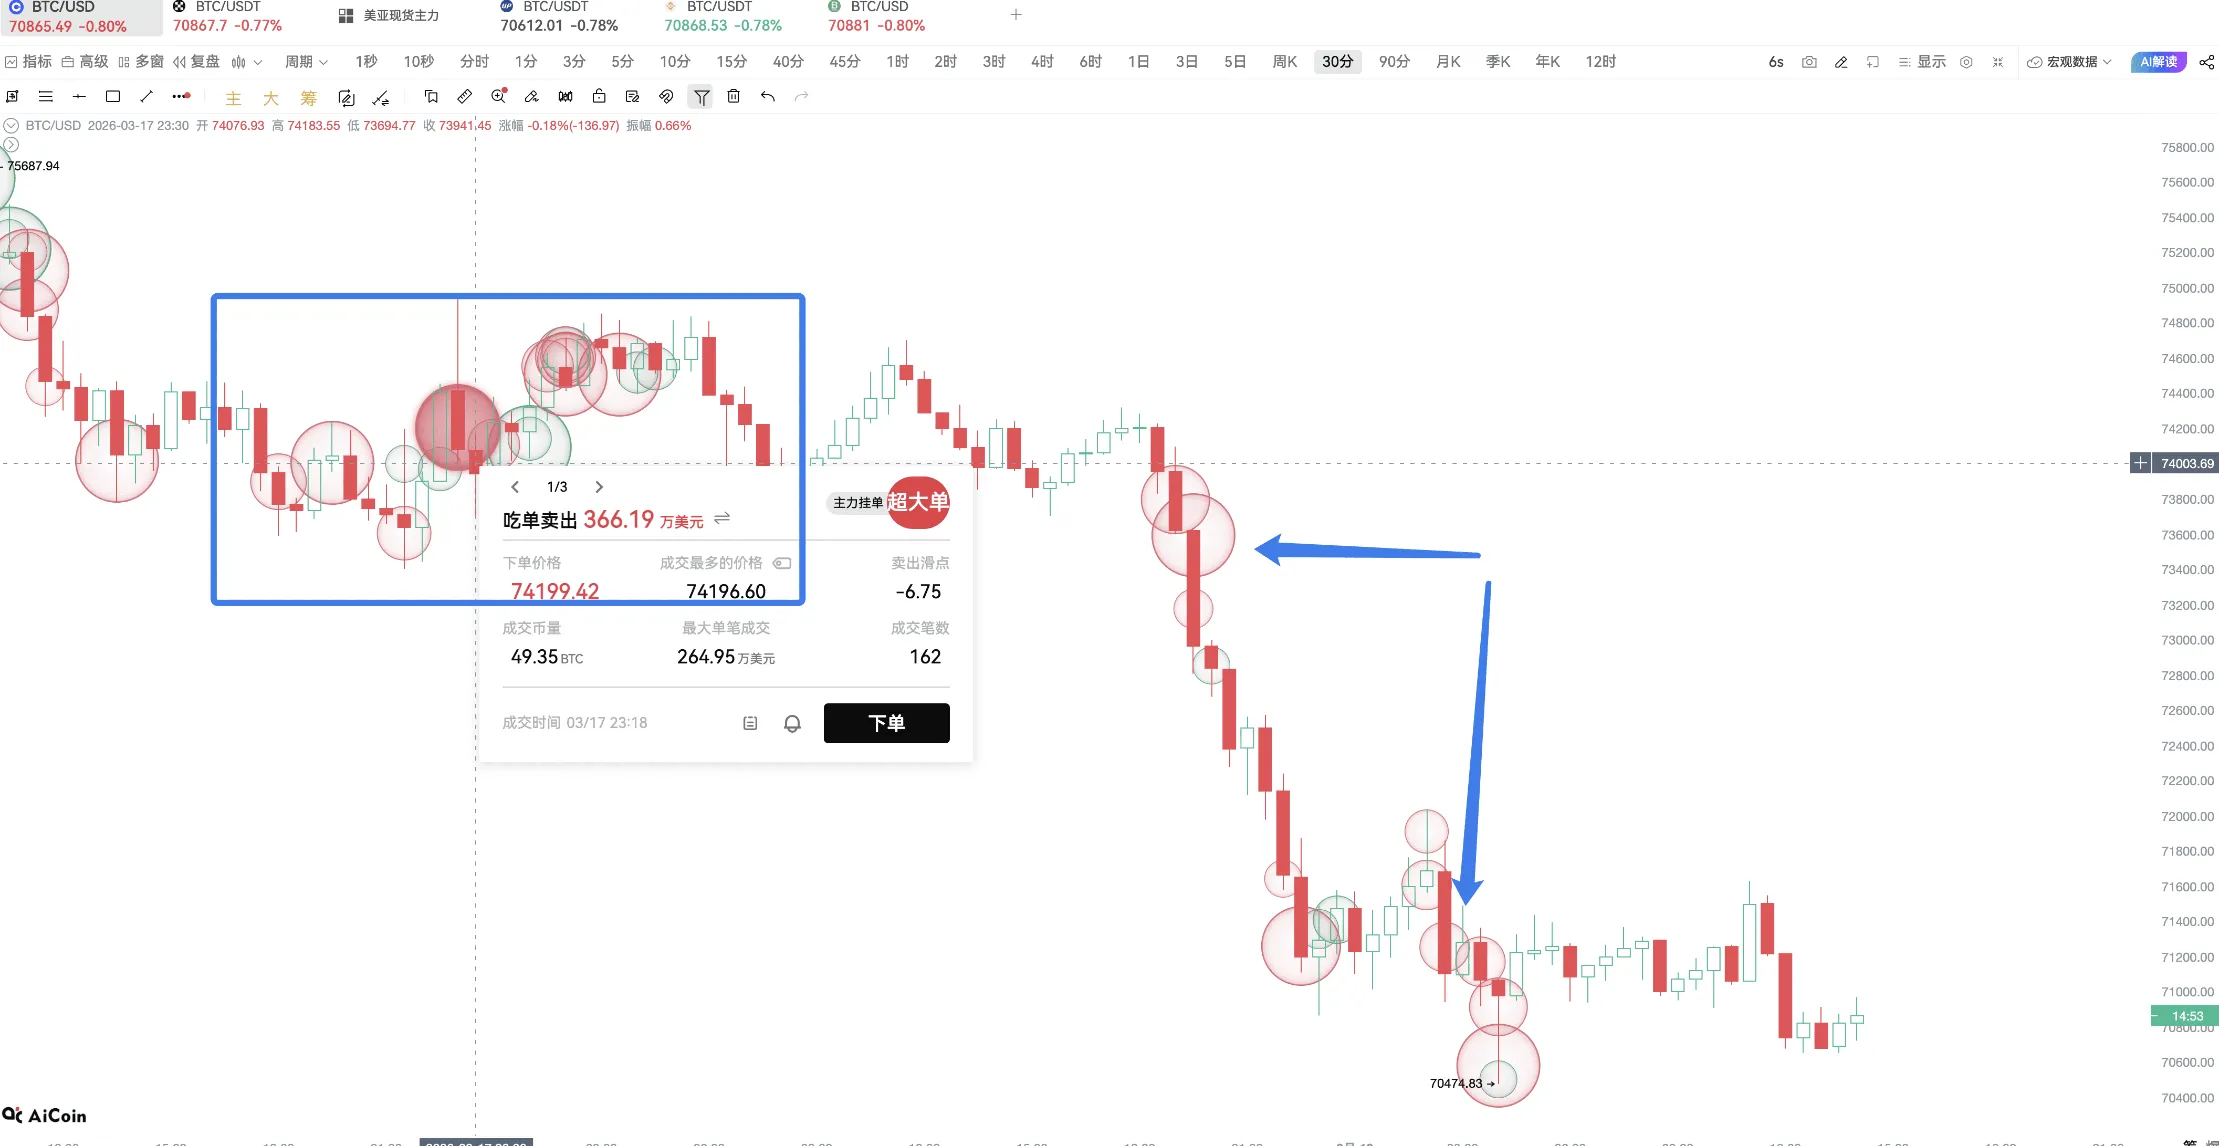
Main force large orders
Method 1: Large orders can be combined with the 5-minute MA120.
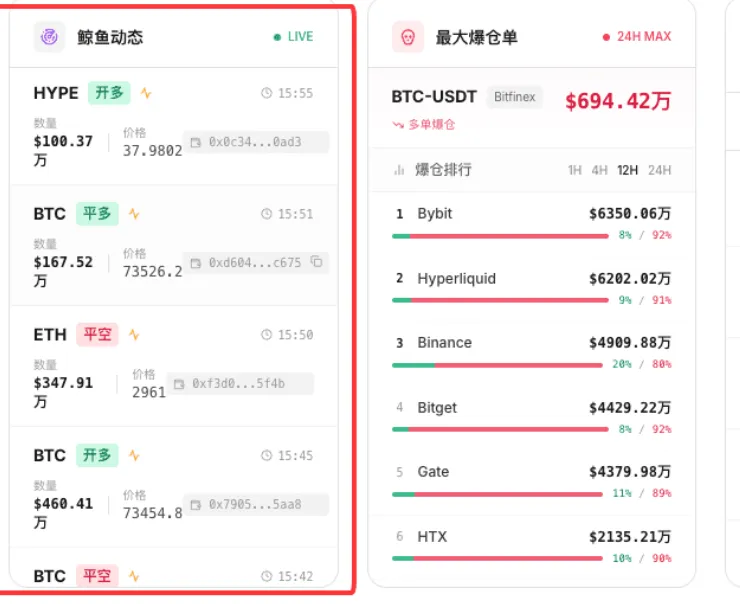
Method 2: Look at super large orders; the attraction of large orders, similar to, if a multi-million level large sell order is above the current price, it indicates that the main force is optimistic about this position; then the price may surge to the main force's position, and after the transaction, it may come down again.
II. Introduction to TD Usage
Usage reference:
Trend market, upward trend: pay attention to the red TD9 for entry opportunities; downward trend: look for green TD9 for short opportunities.
Oscillating market, buy on red TD9, sell on green TD9.
In the current market, do not go short; use red TD9 for entry, and green TD9 for partial profit-taking and observation.
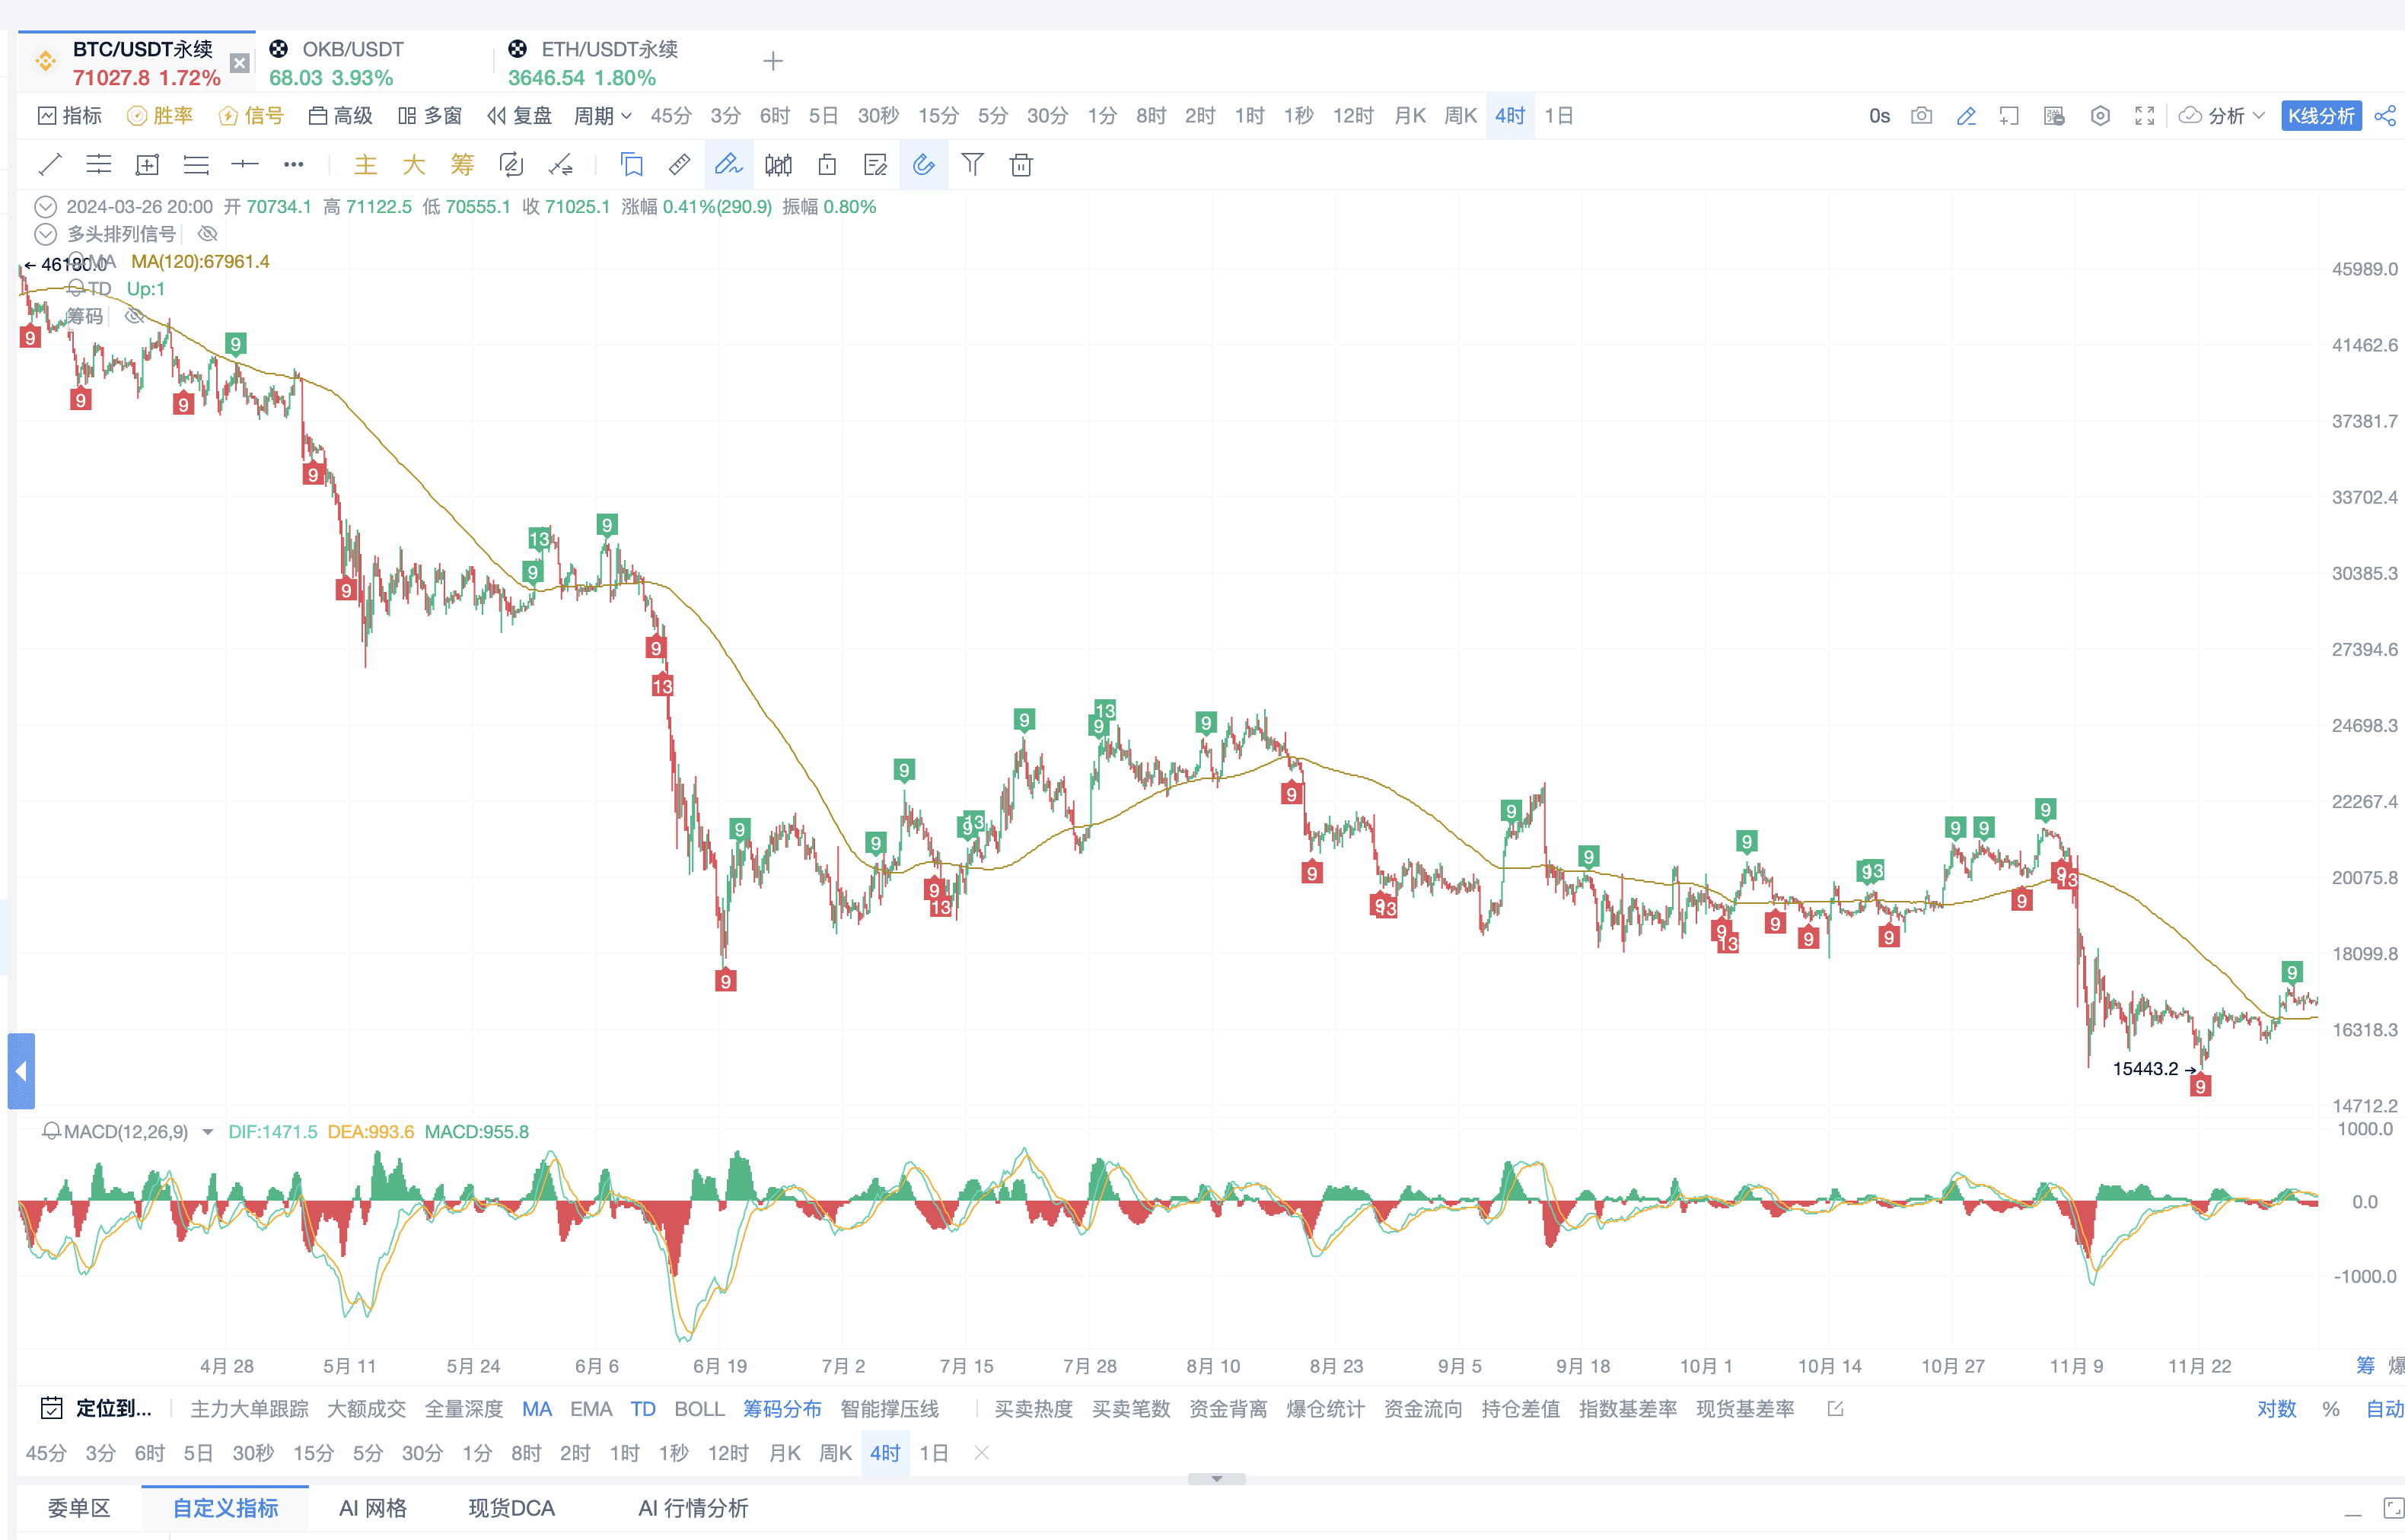
Open the TD indicator
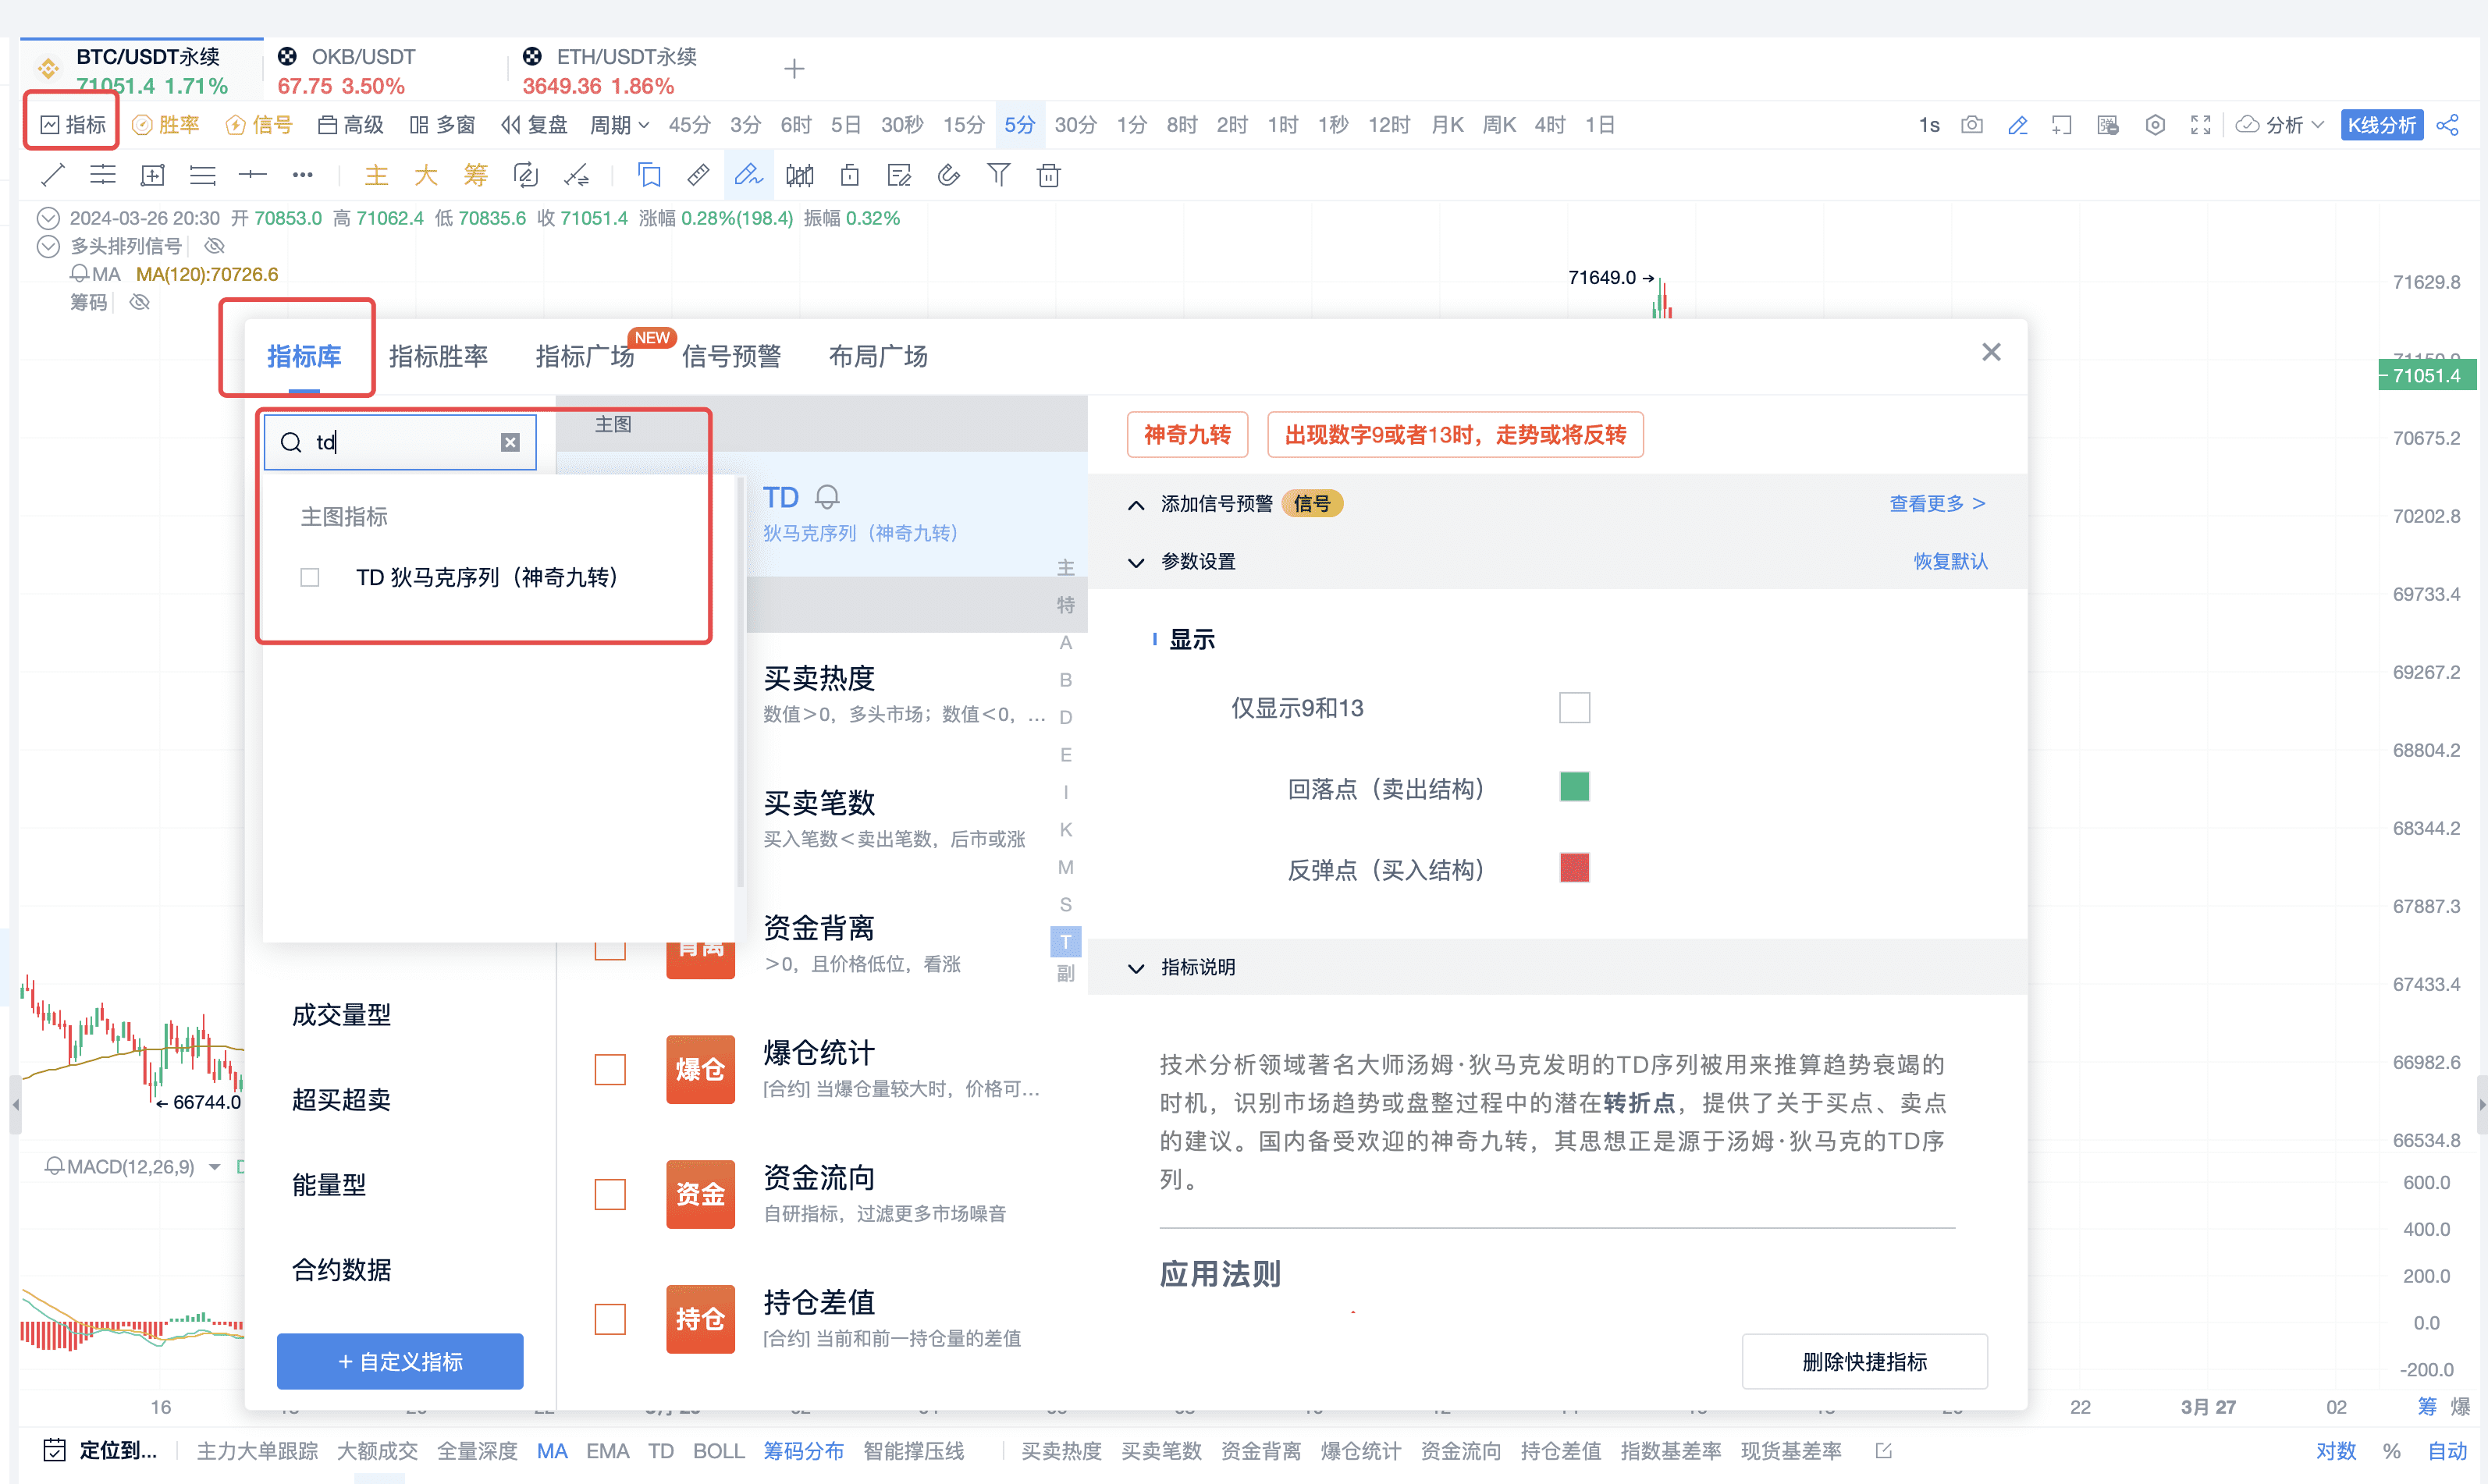
Red indicates buy signals, and when encountering 9, it changes
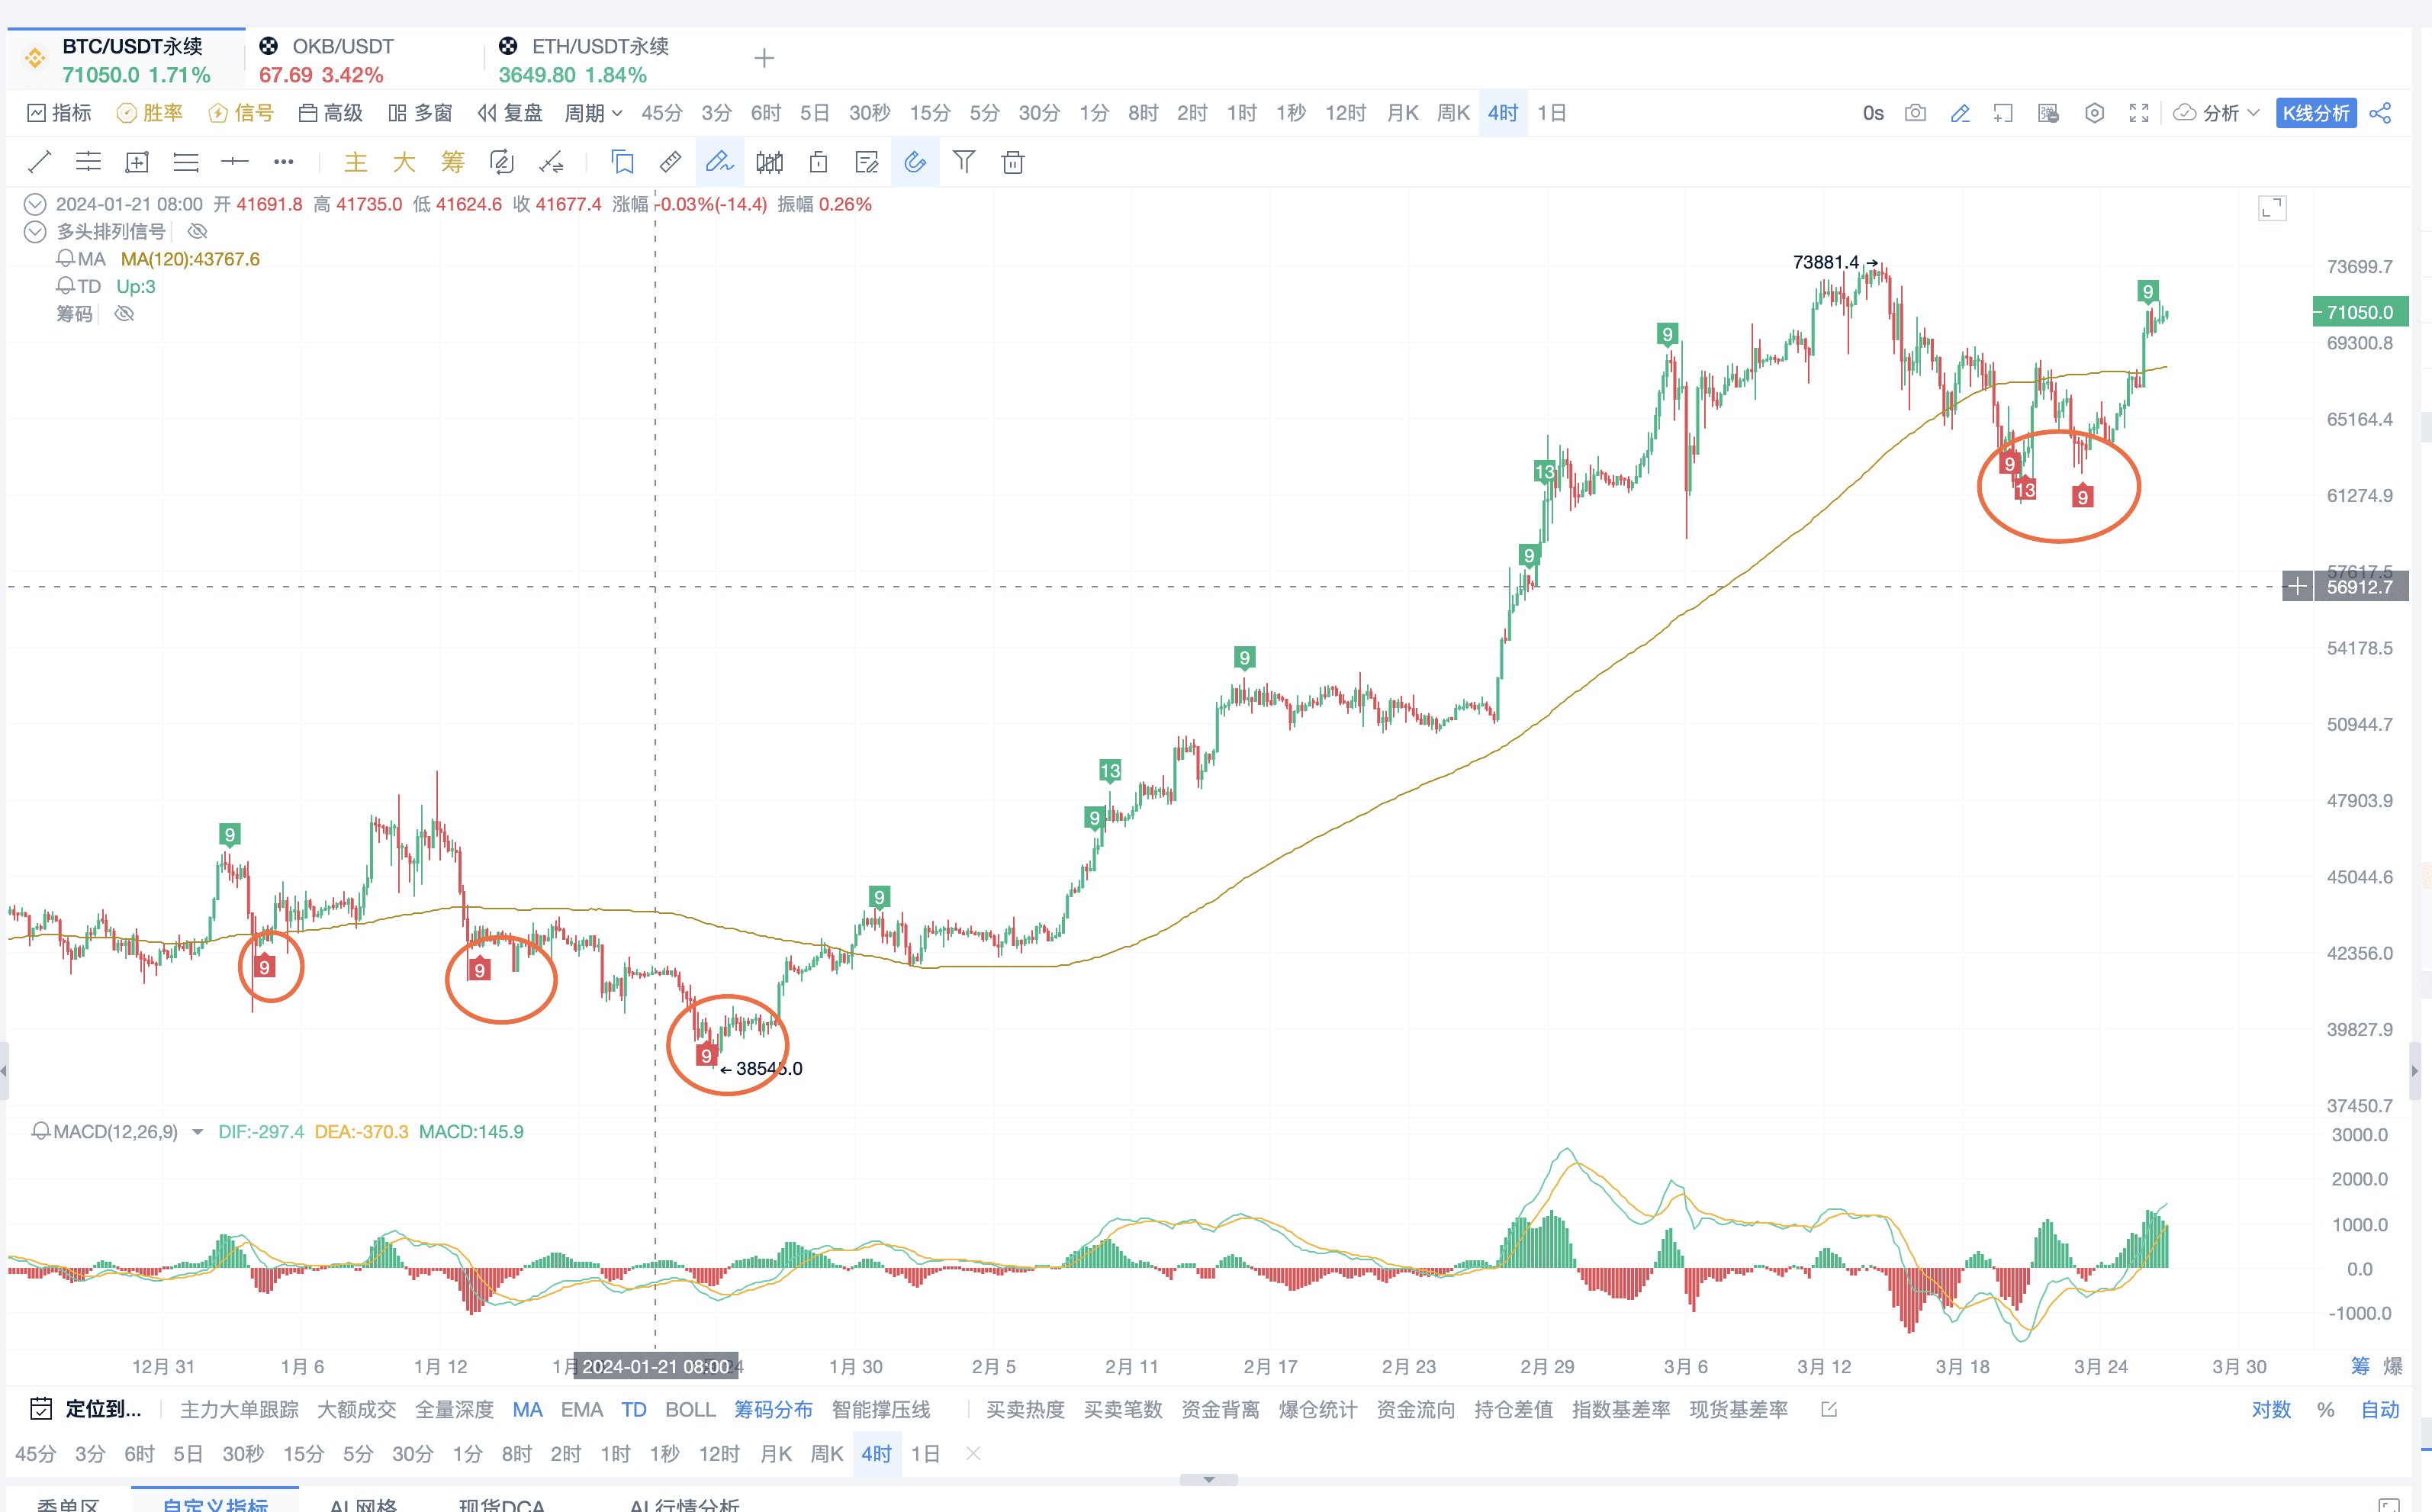
In an uptrend, the situation that occurs is that when encountering a green 9, it does not change or changes back very little, and the change is not particularly significant.
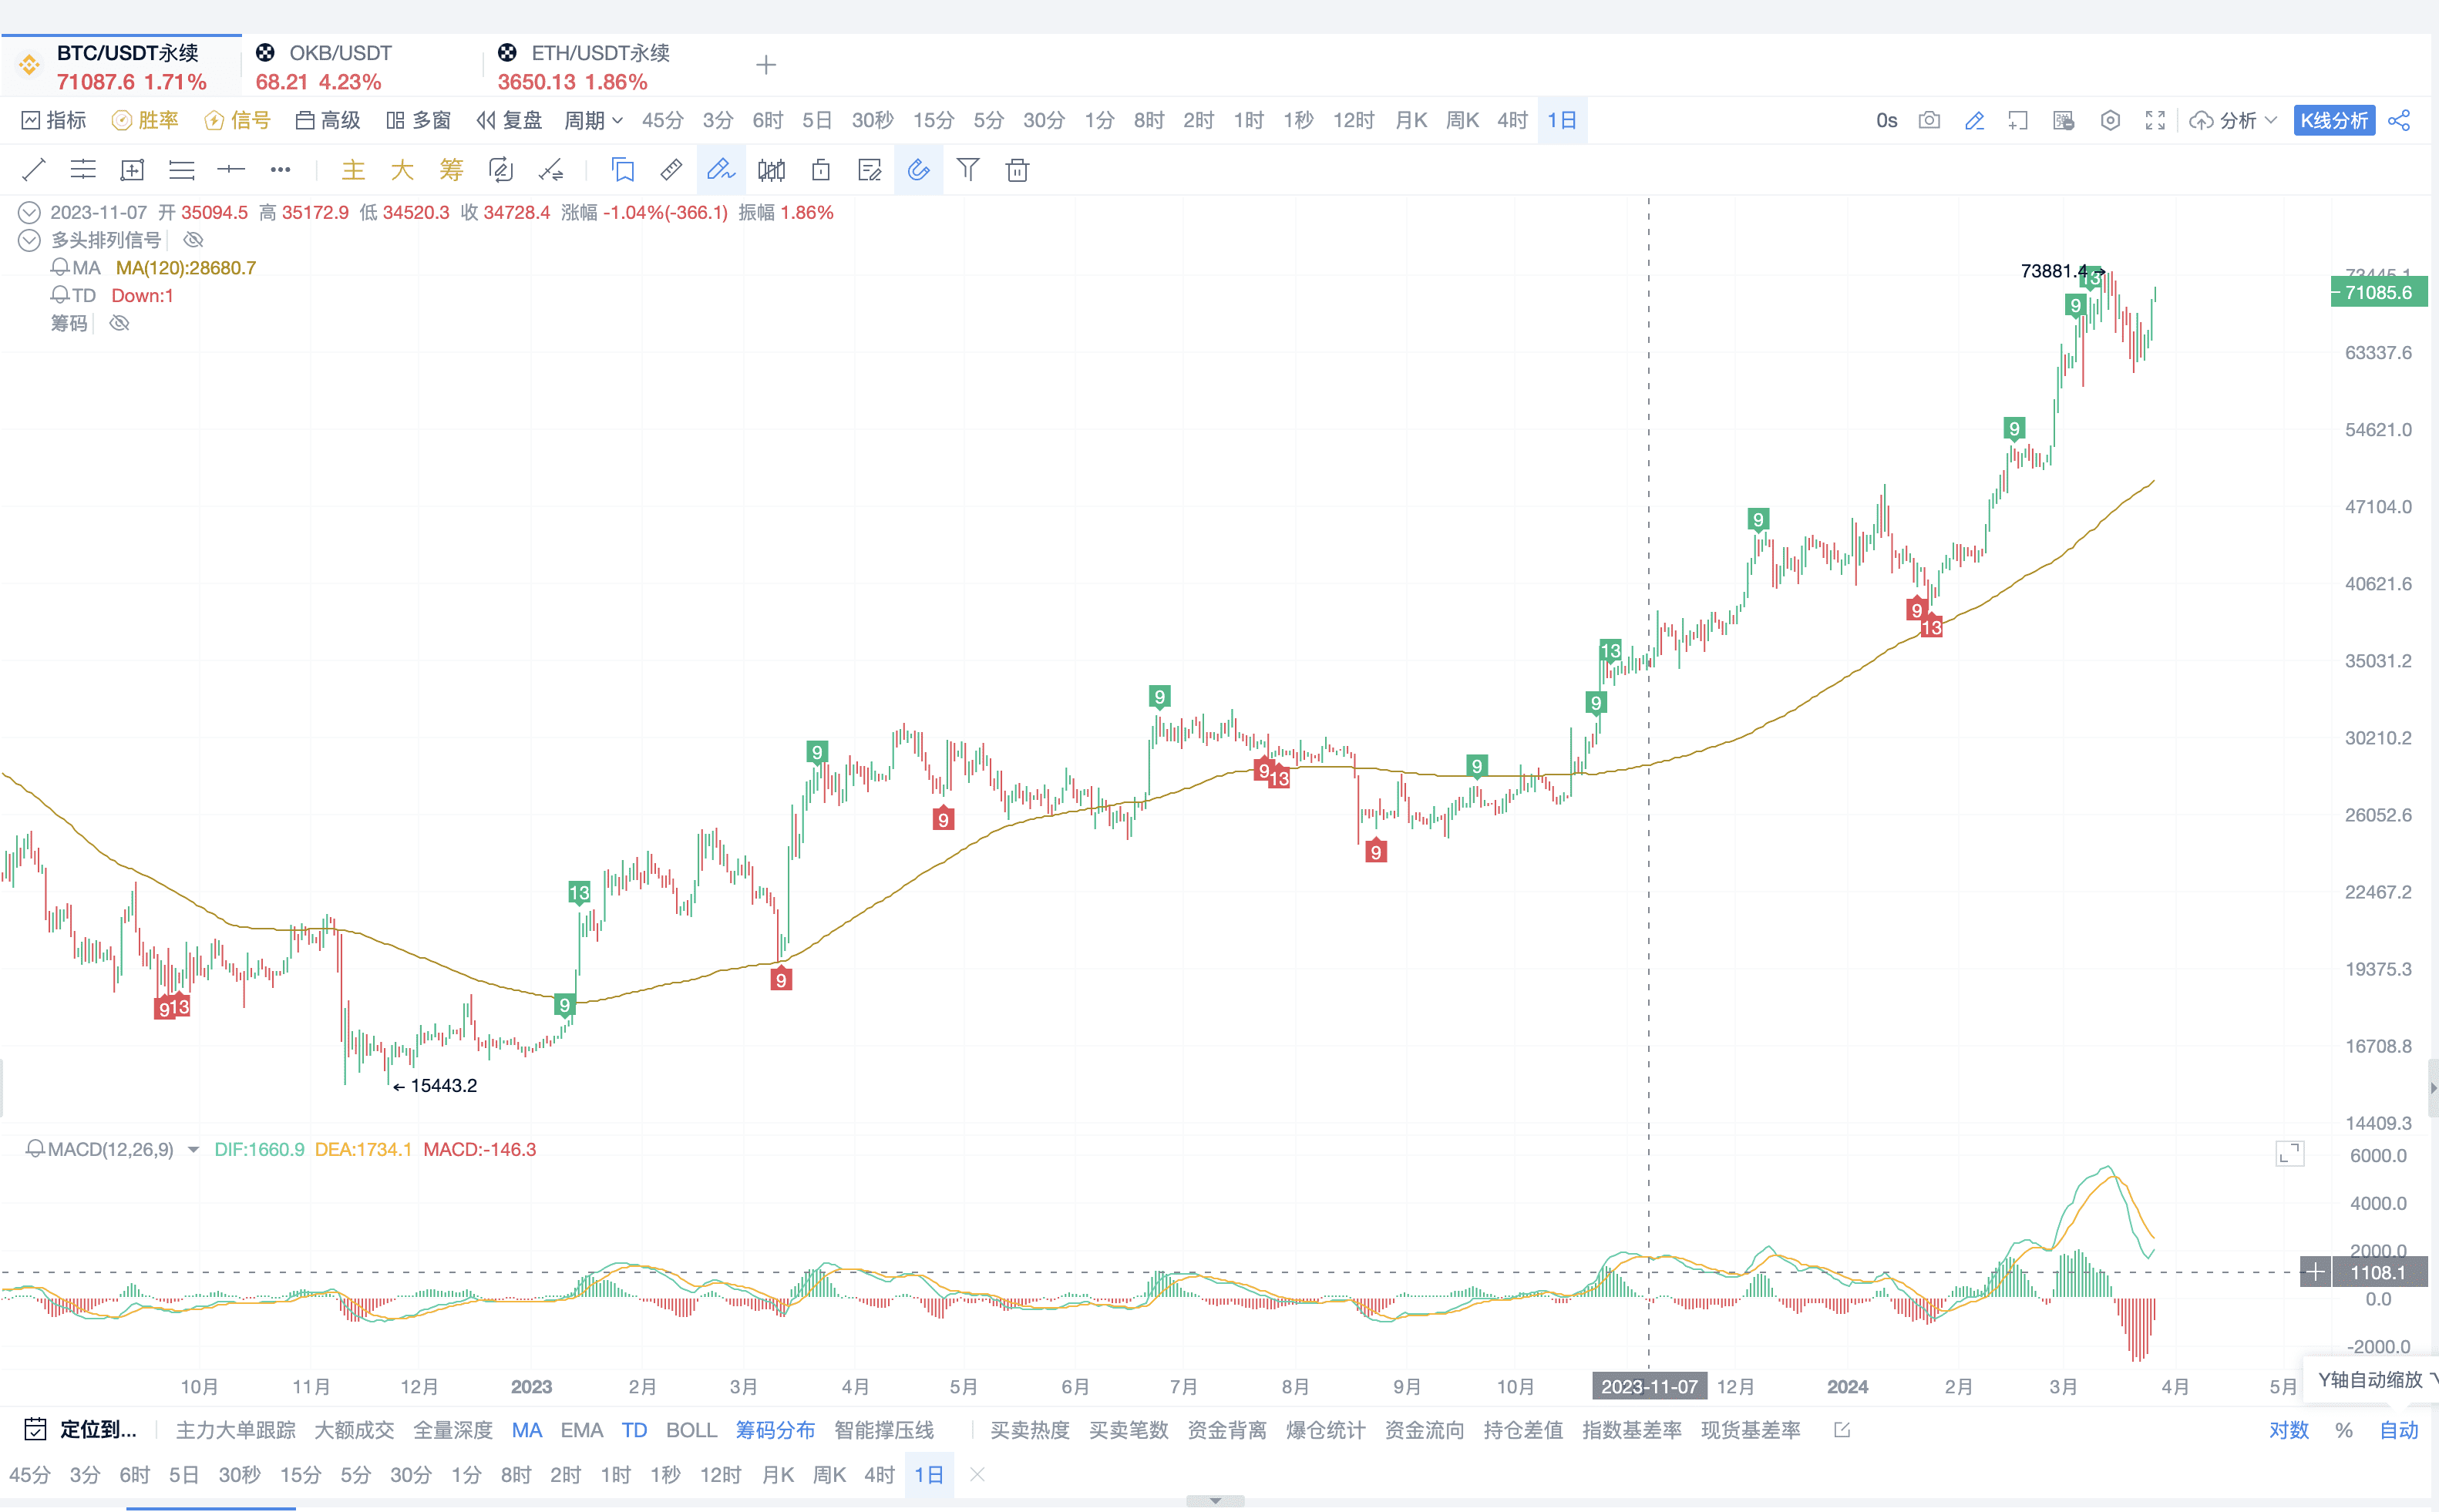
Pull the market to the daily chart to see that TD 9 can basically be picked up at low points
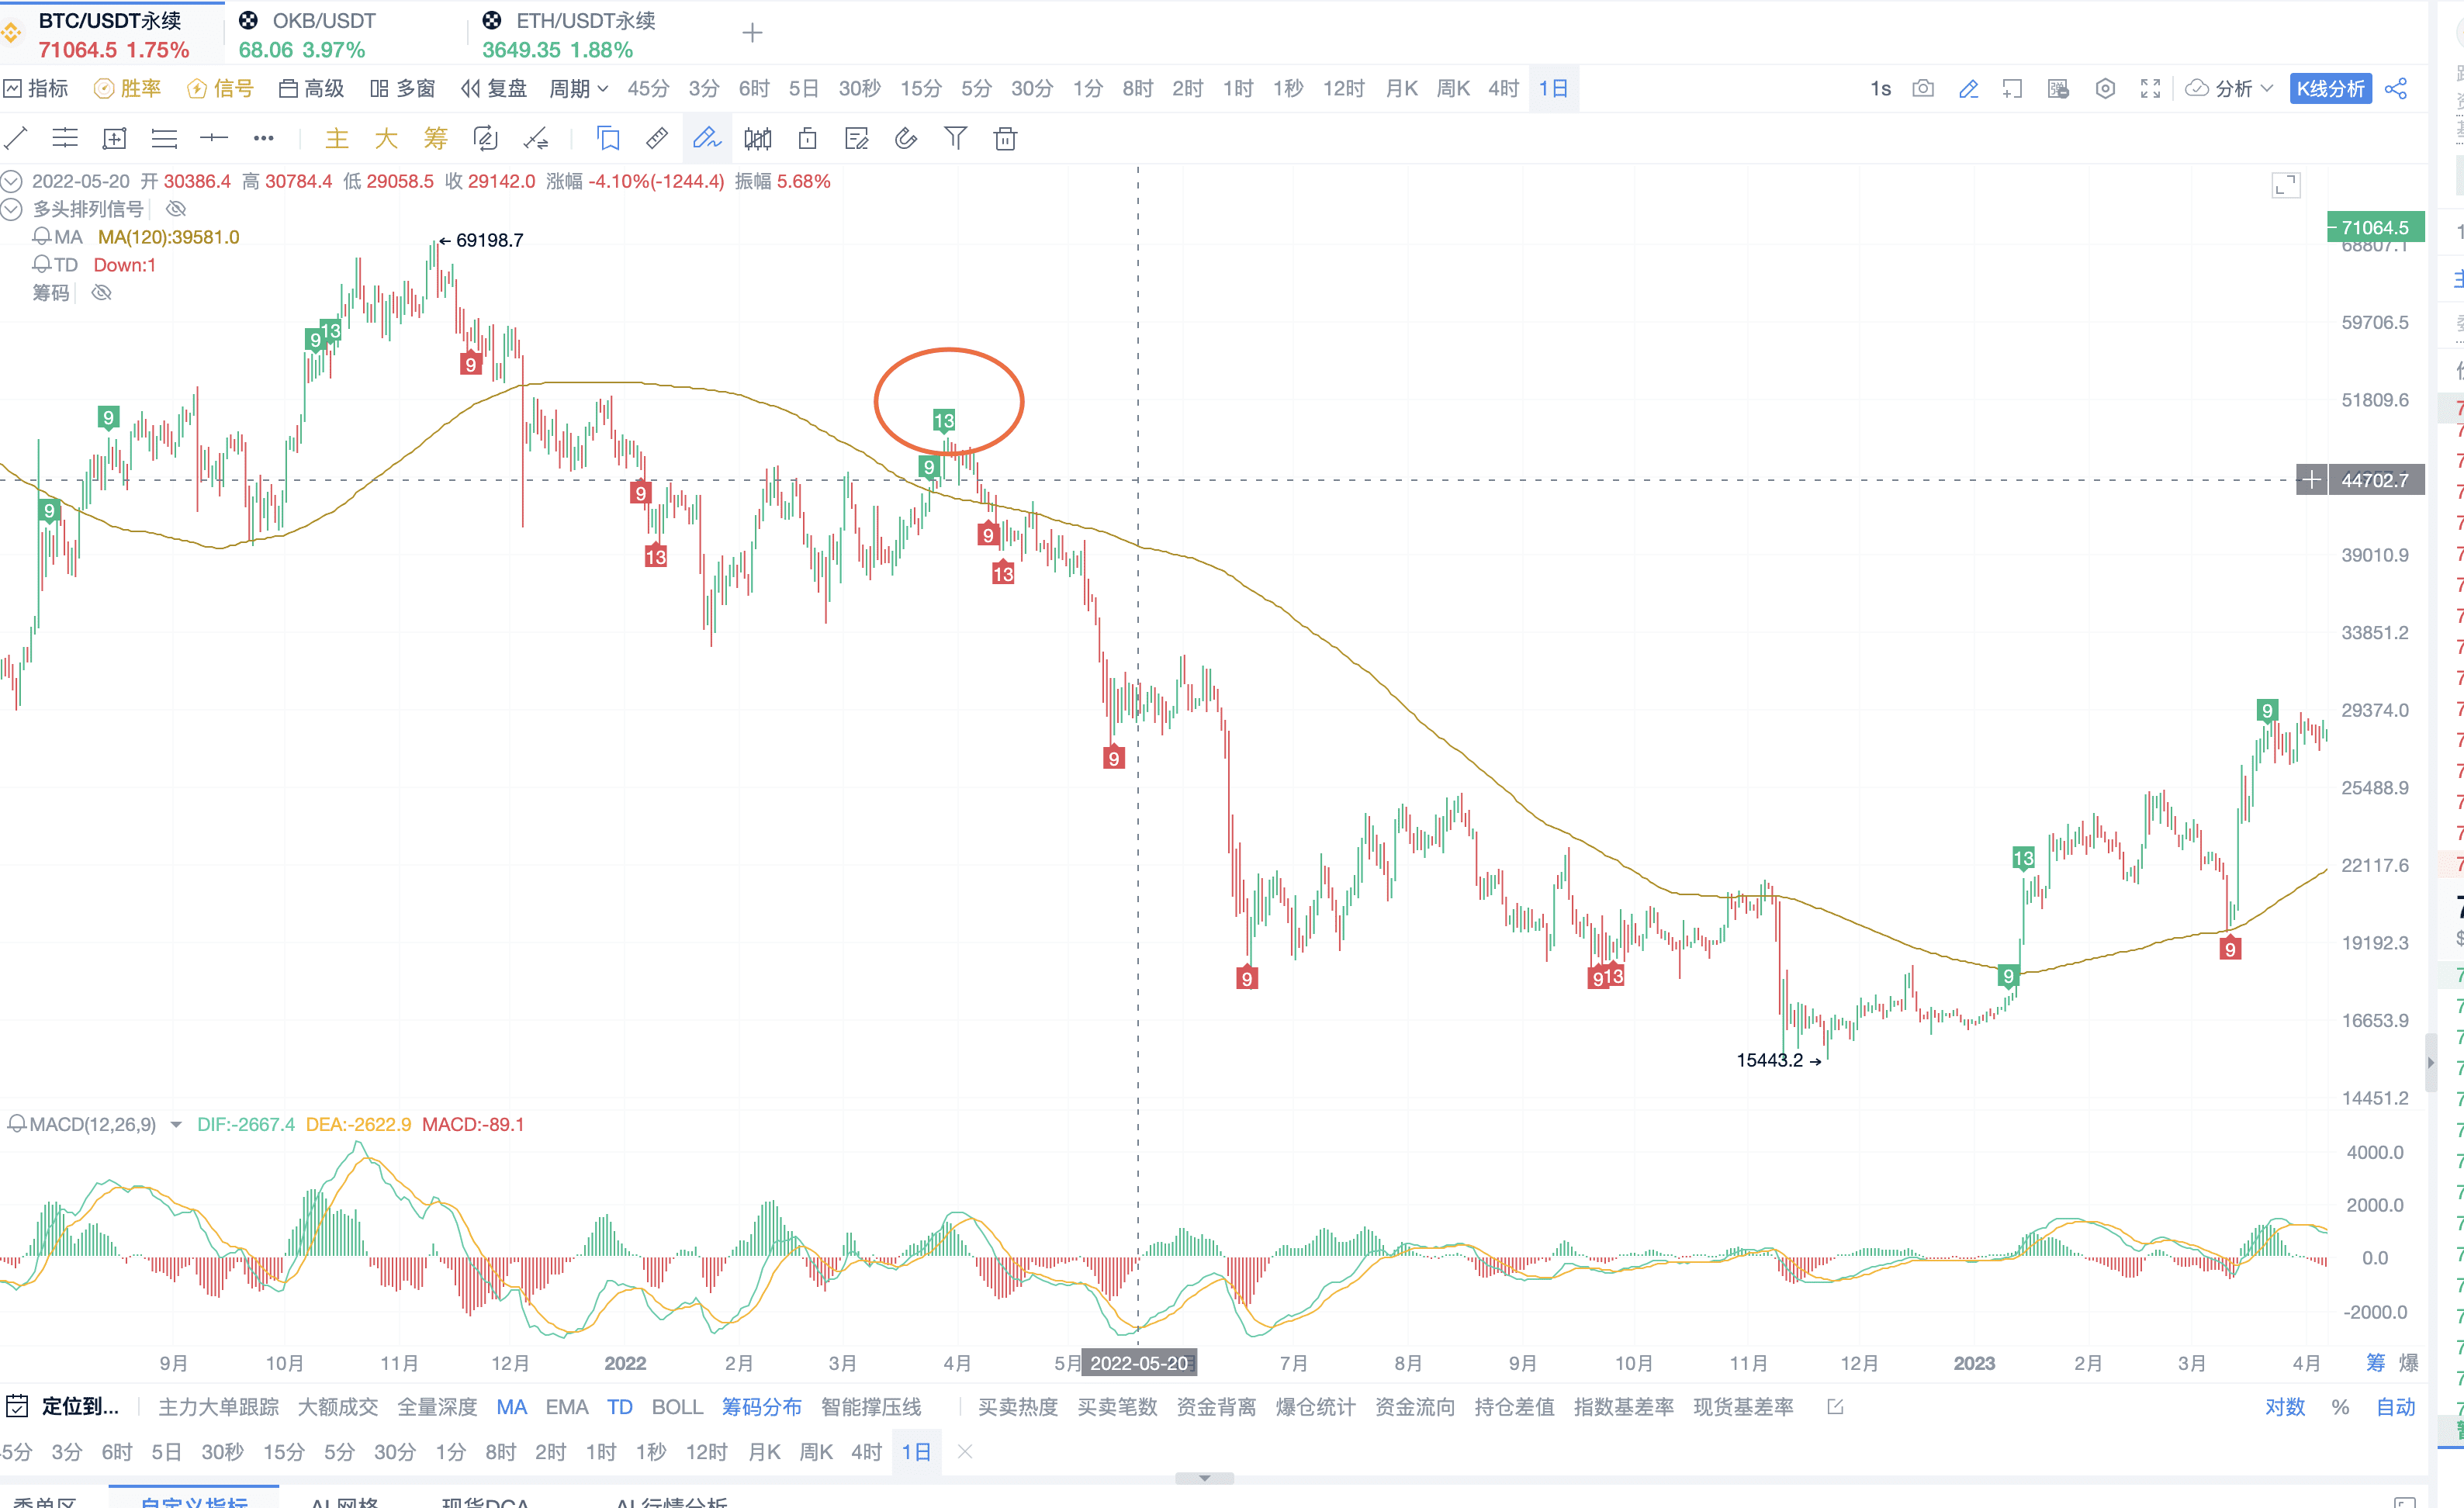
It is also suitable for the bear market phase, rebound and open short strategy
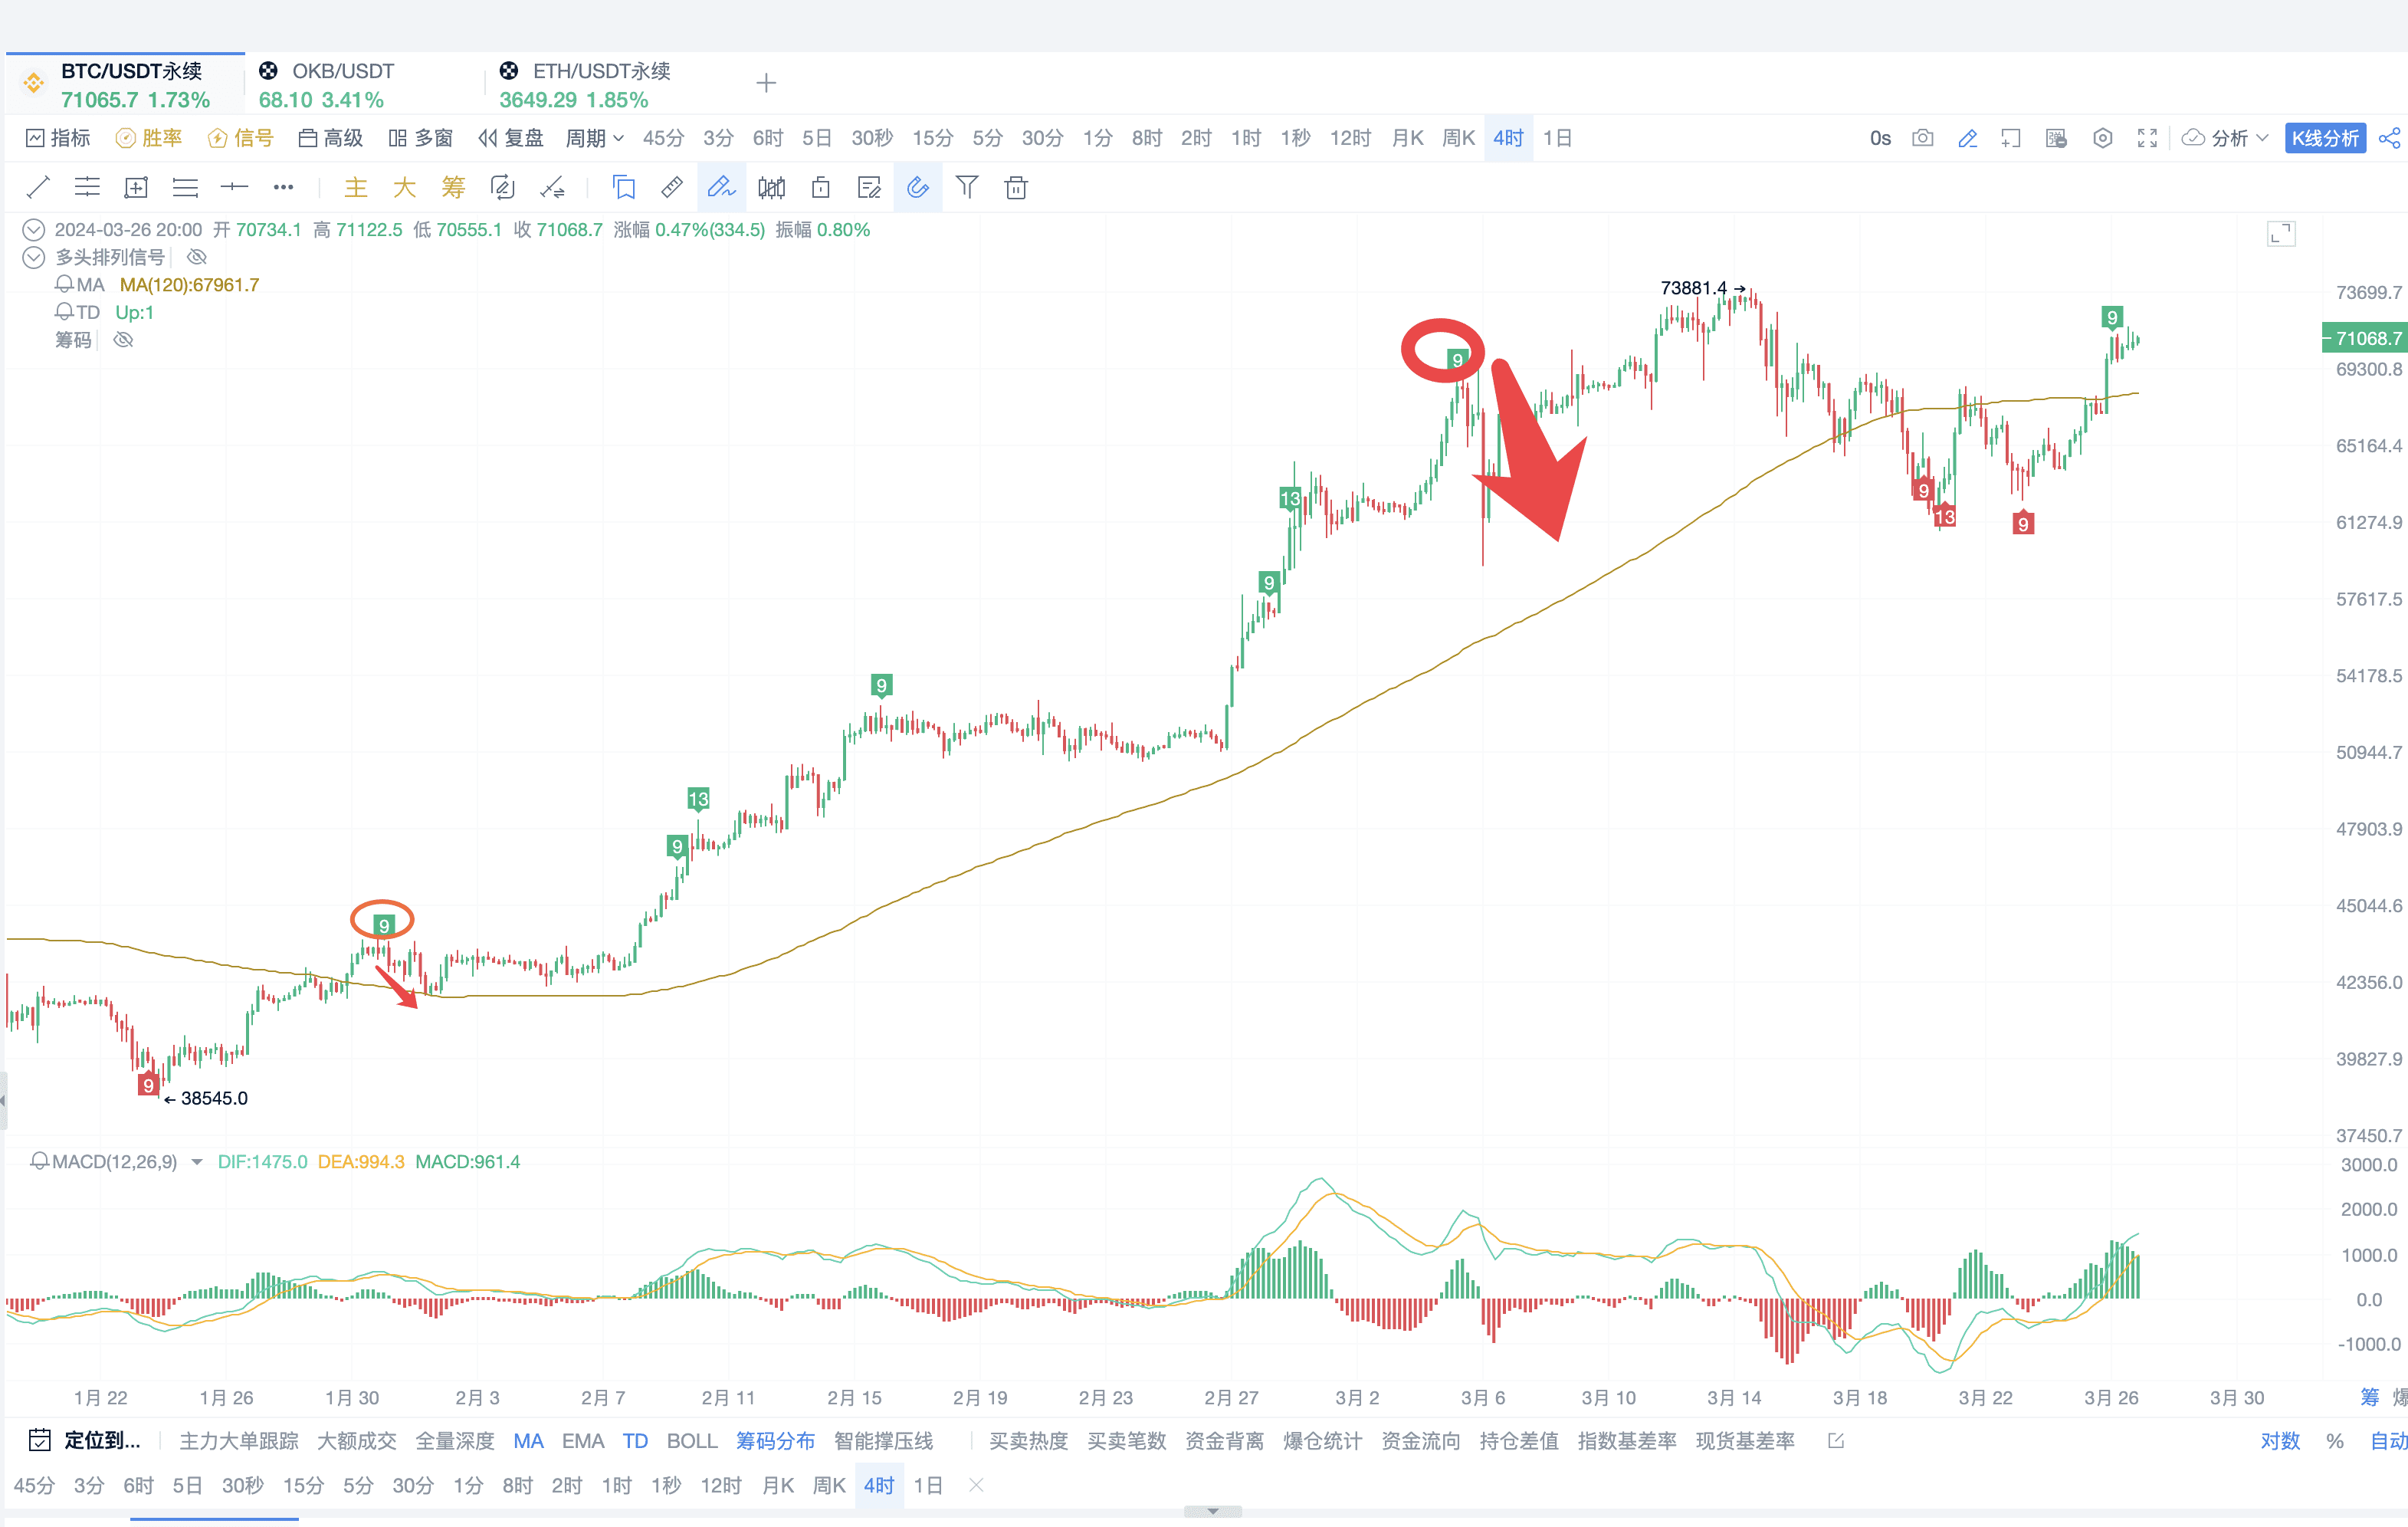
More opportunities on the 4-hour period
III. TD Automated Profit
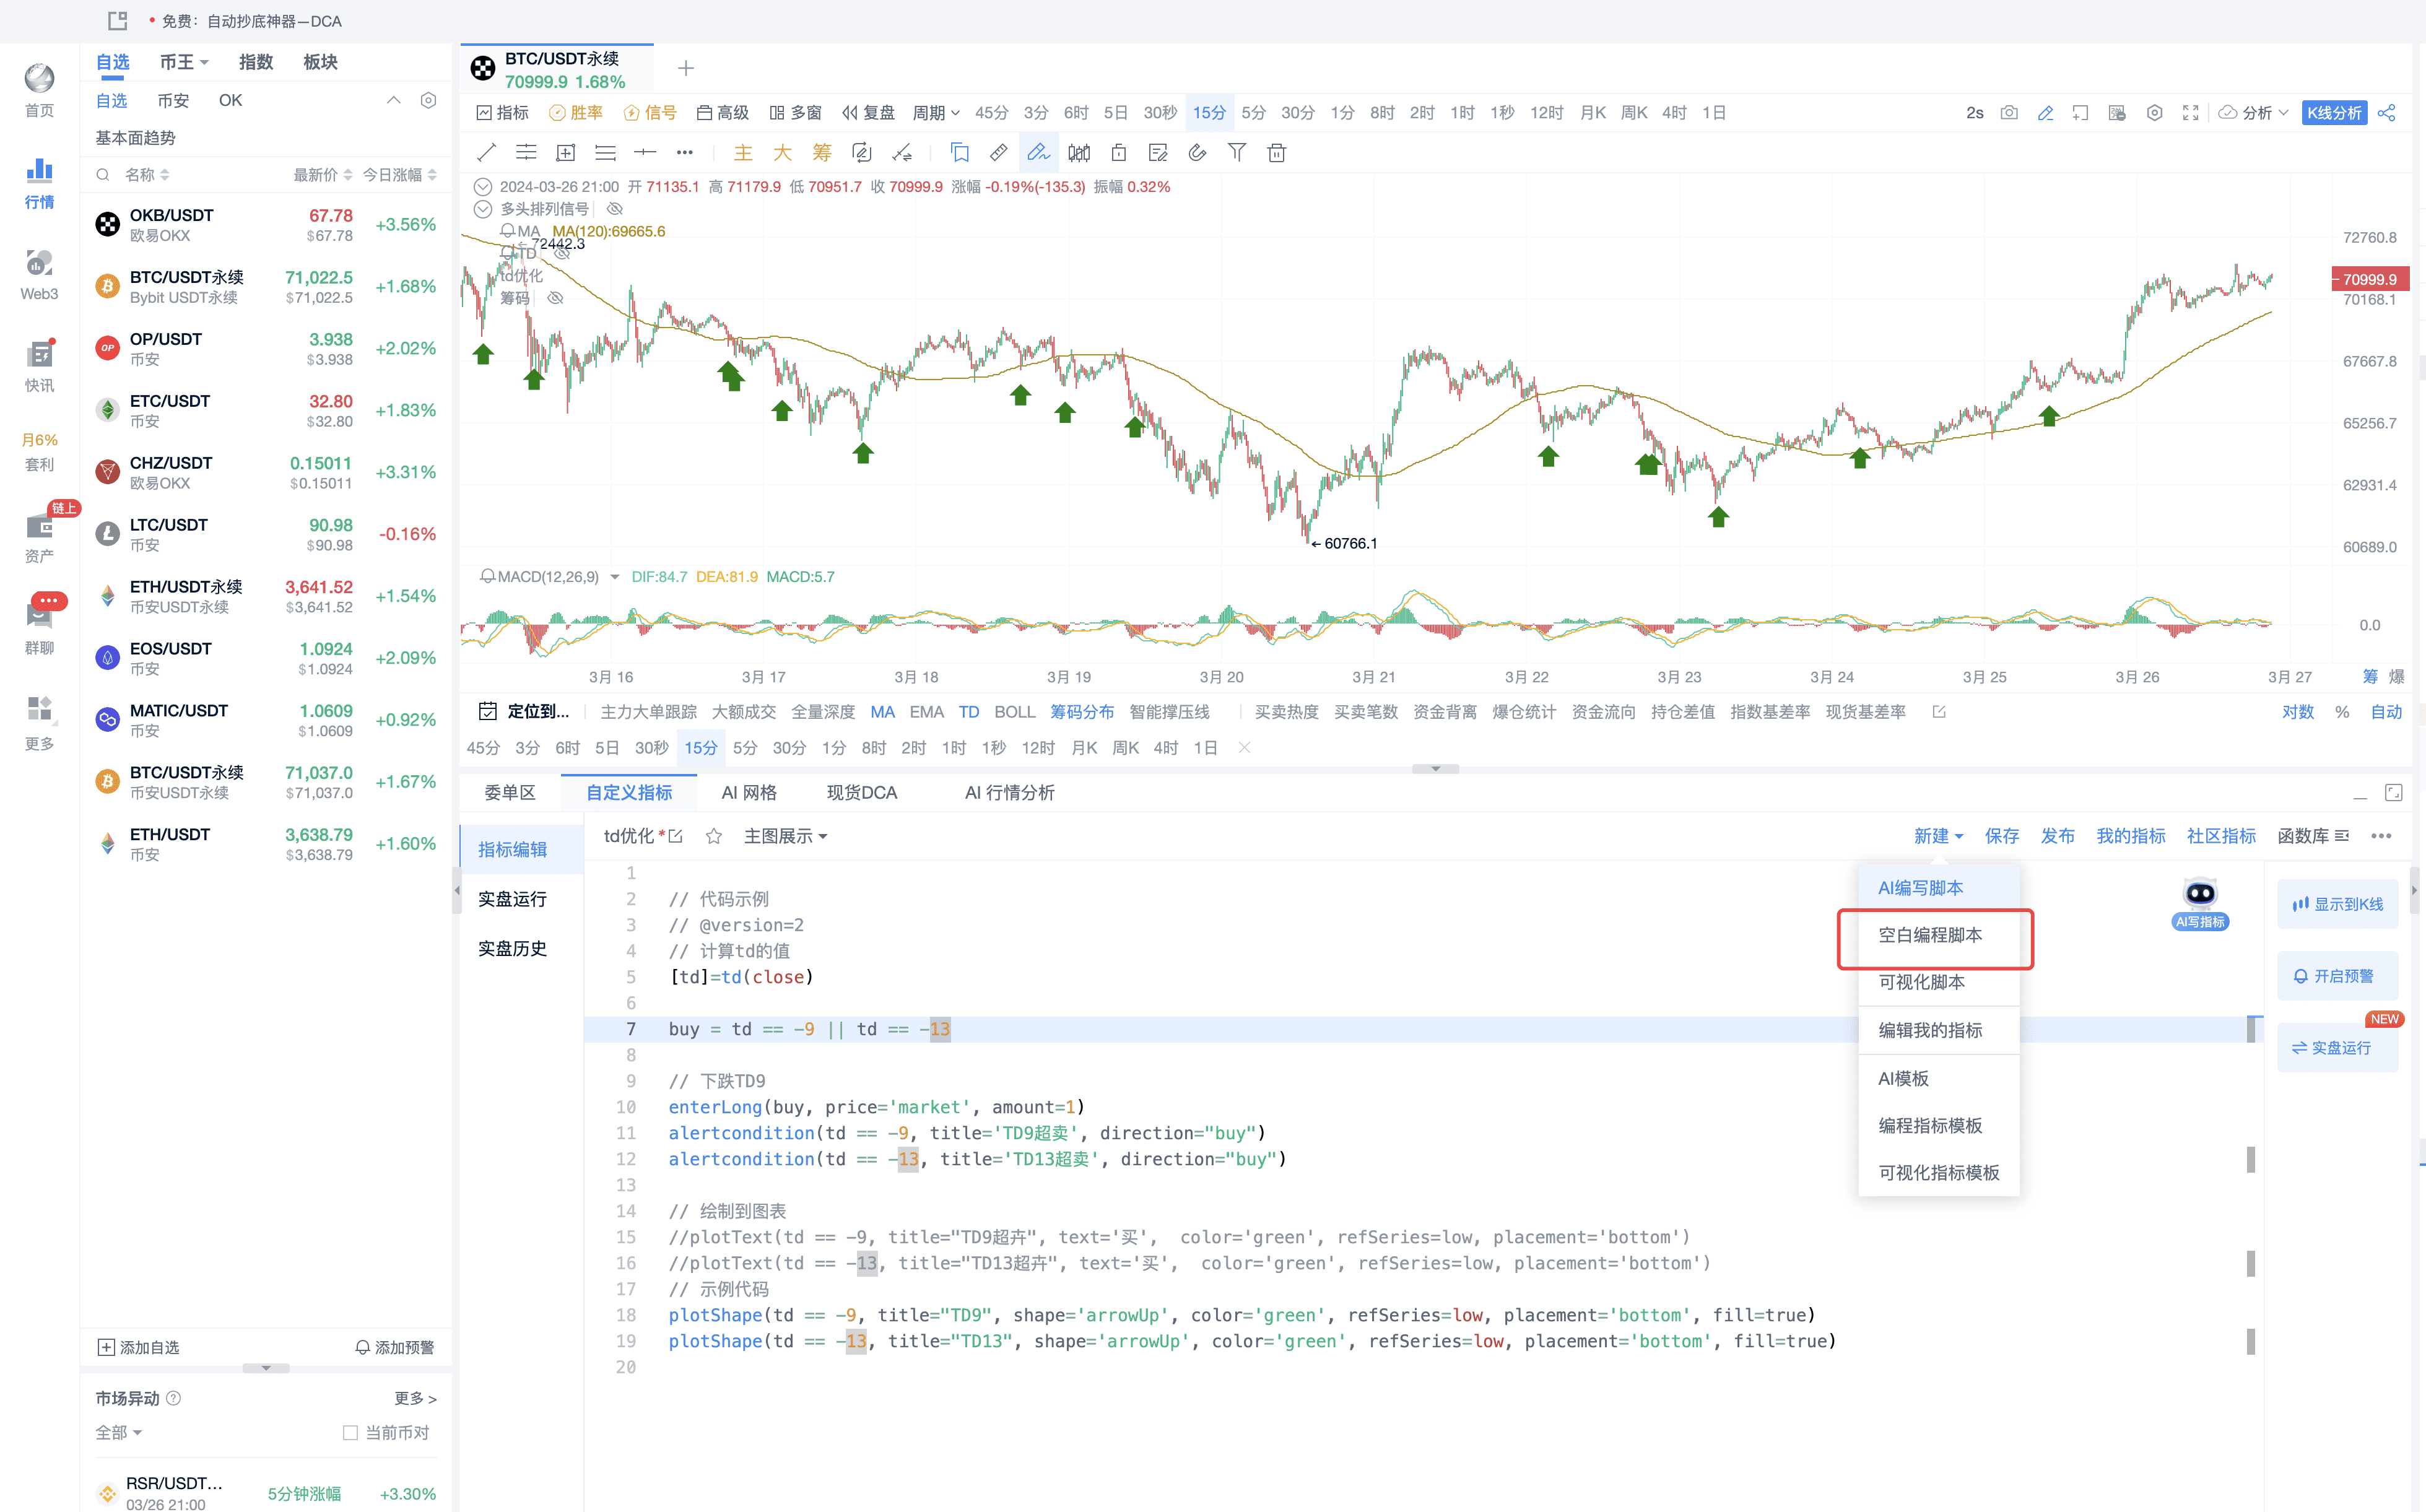
Click on the custom indicator at the bottom
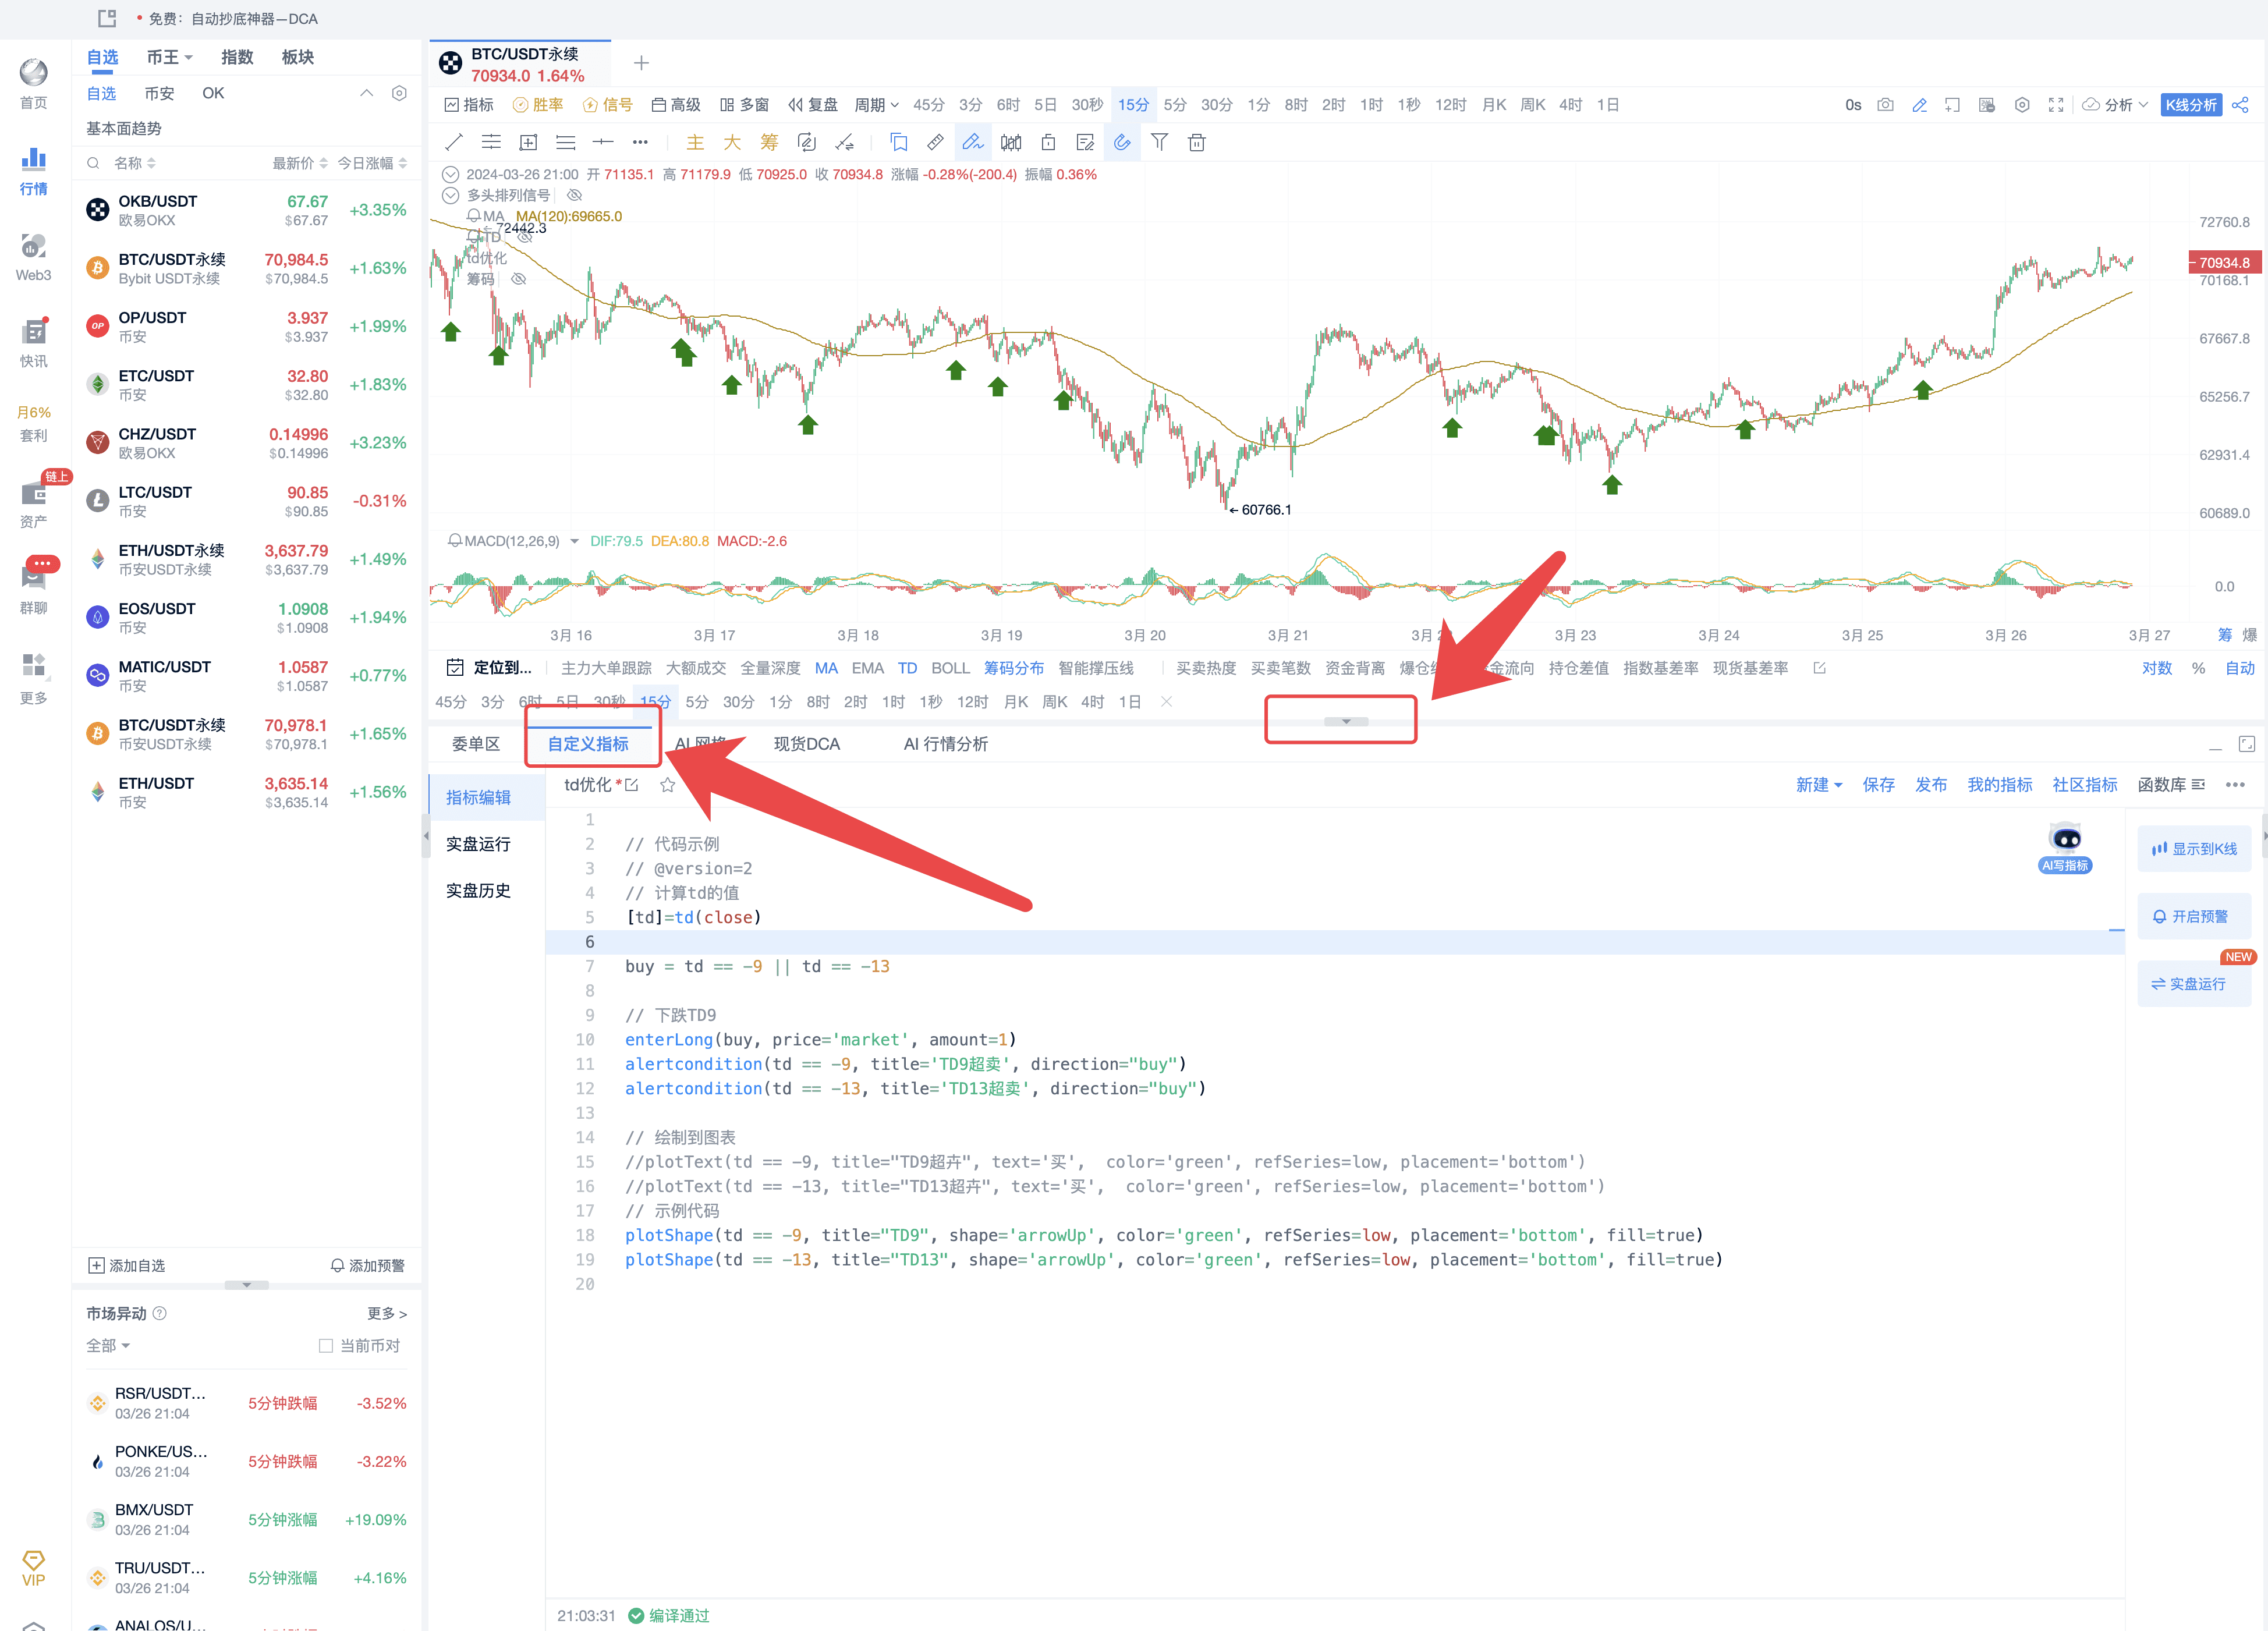
Click on this AI to write the indicator together
See what AI results in
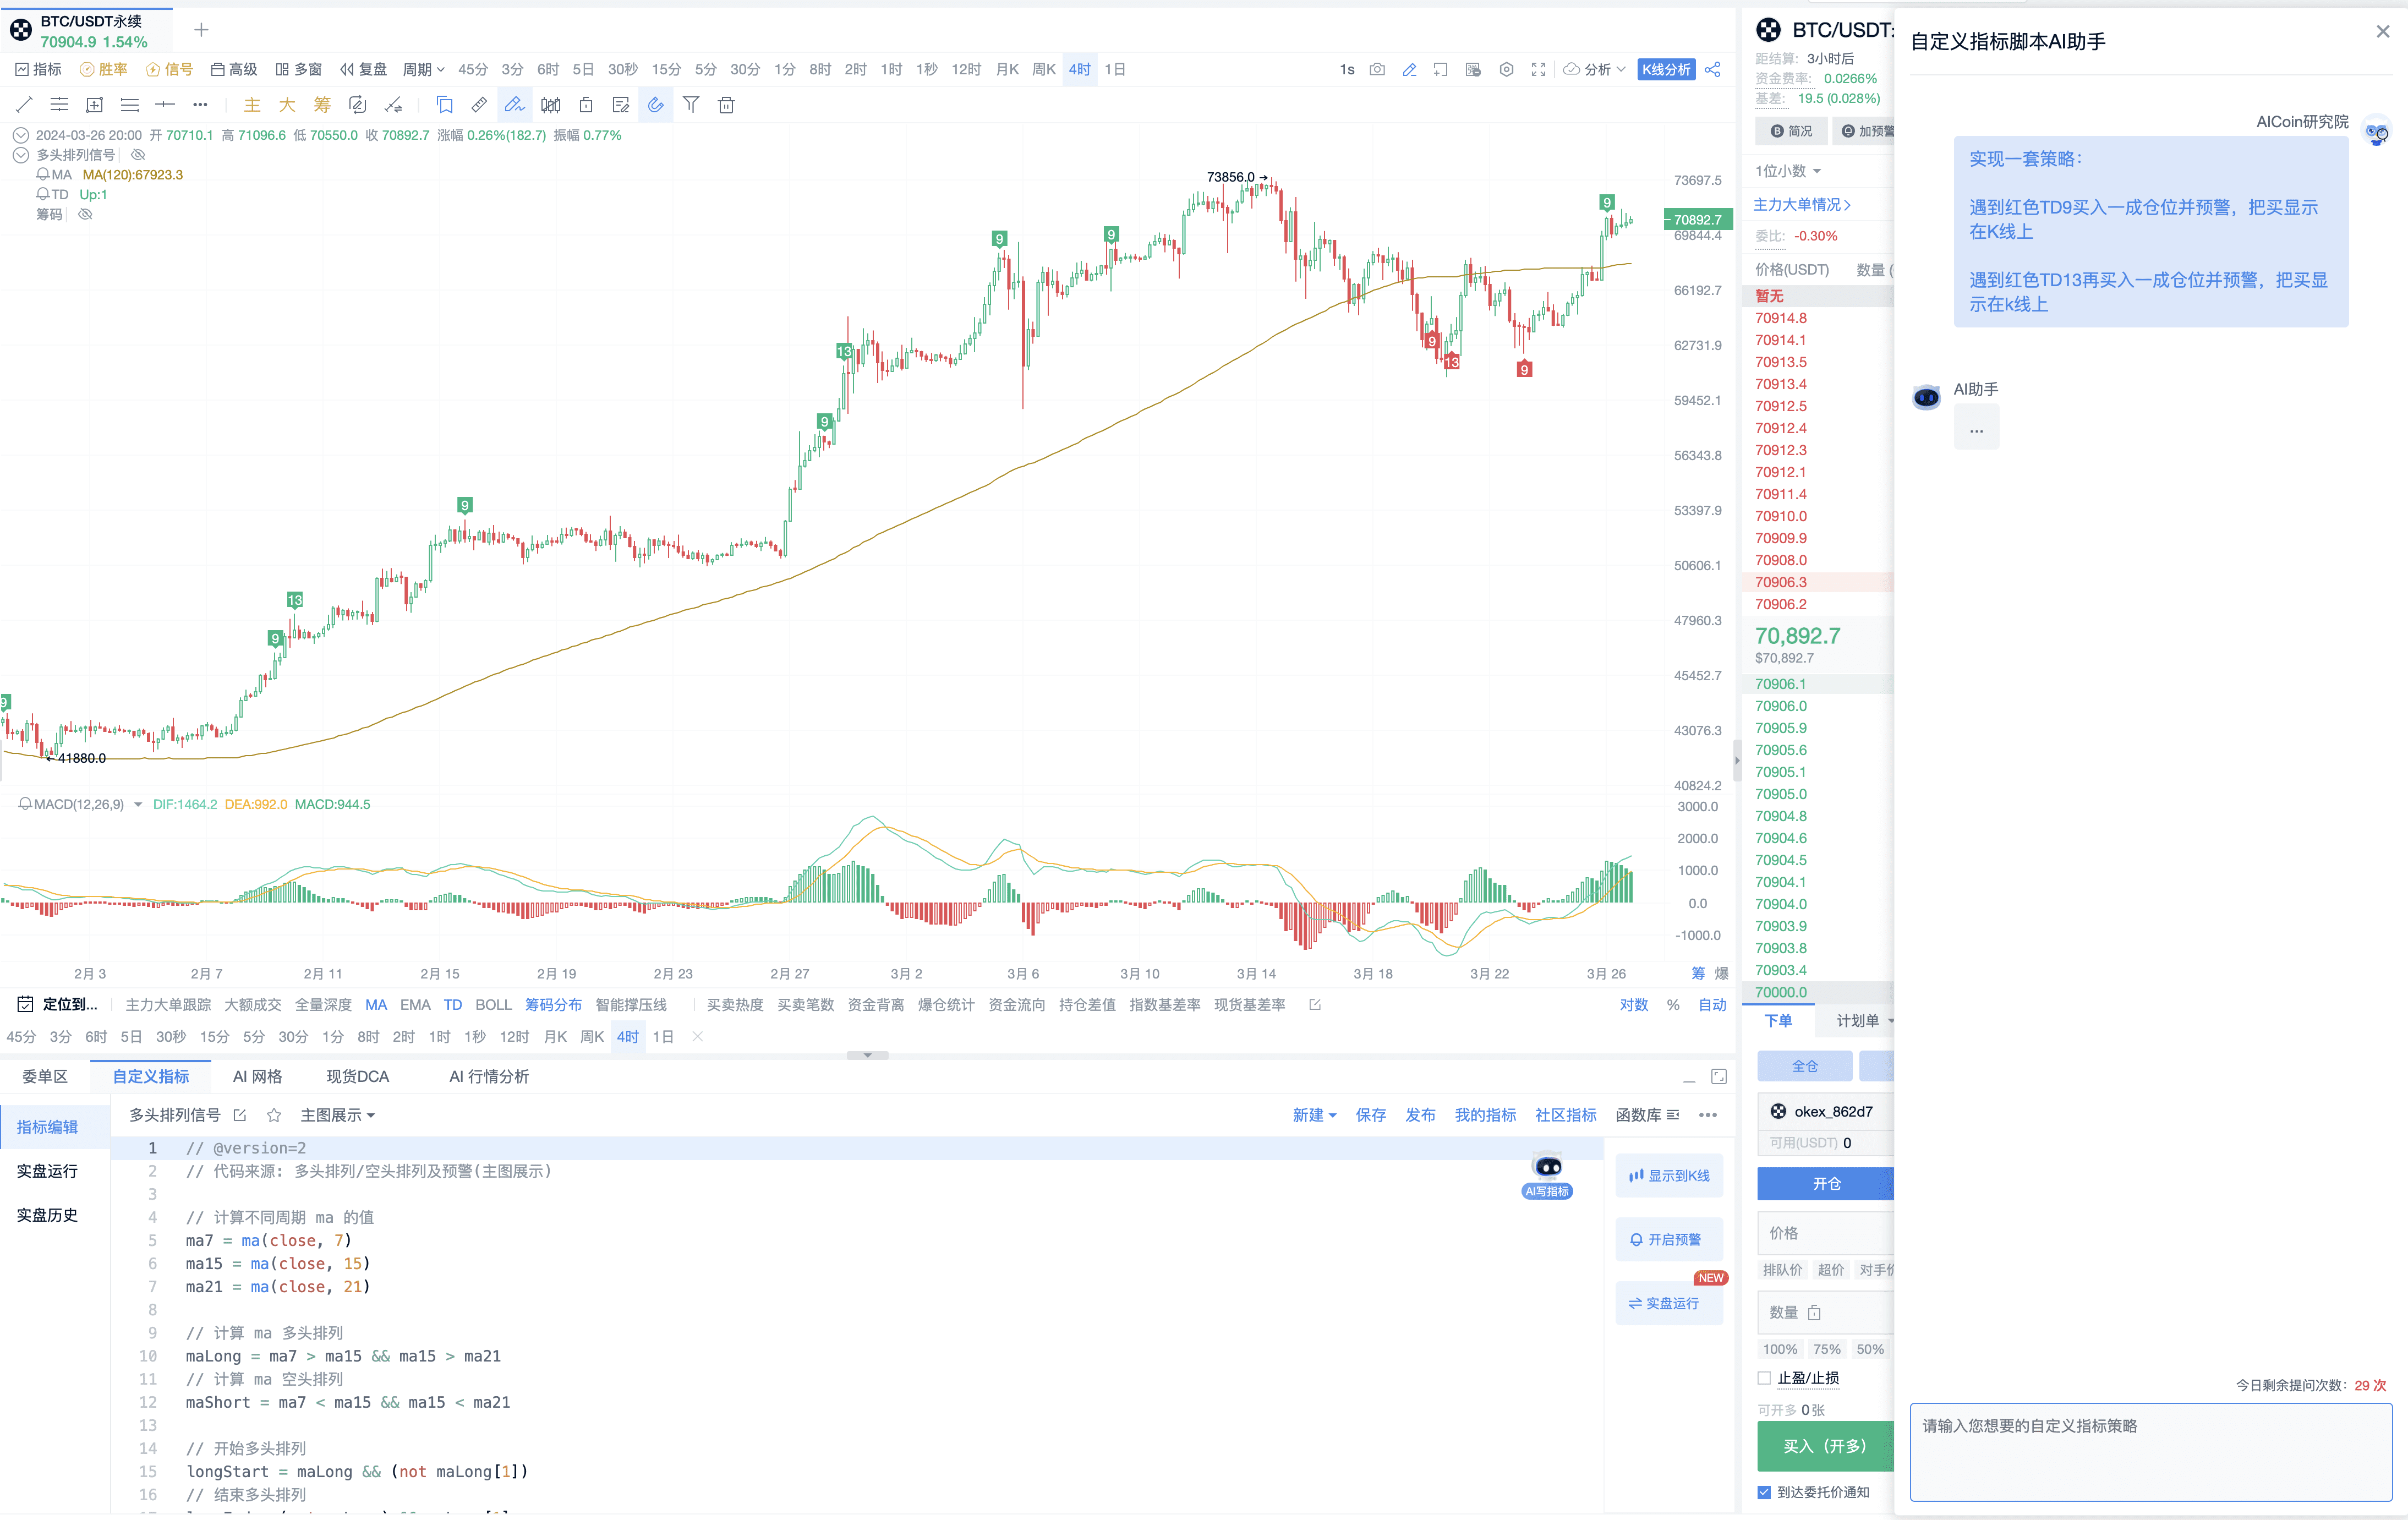
The first version appeared, and it needs to be modified;
Let AI help modify it again
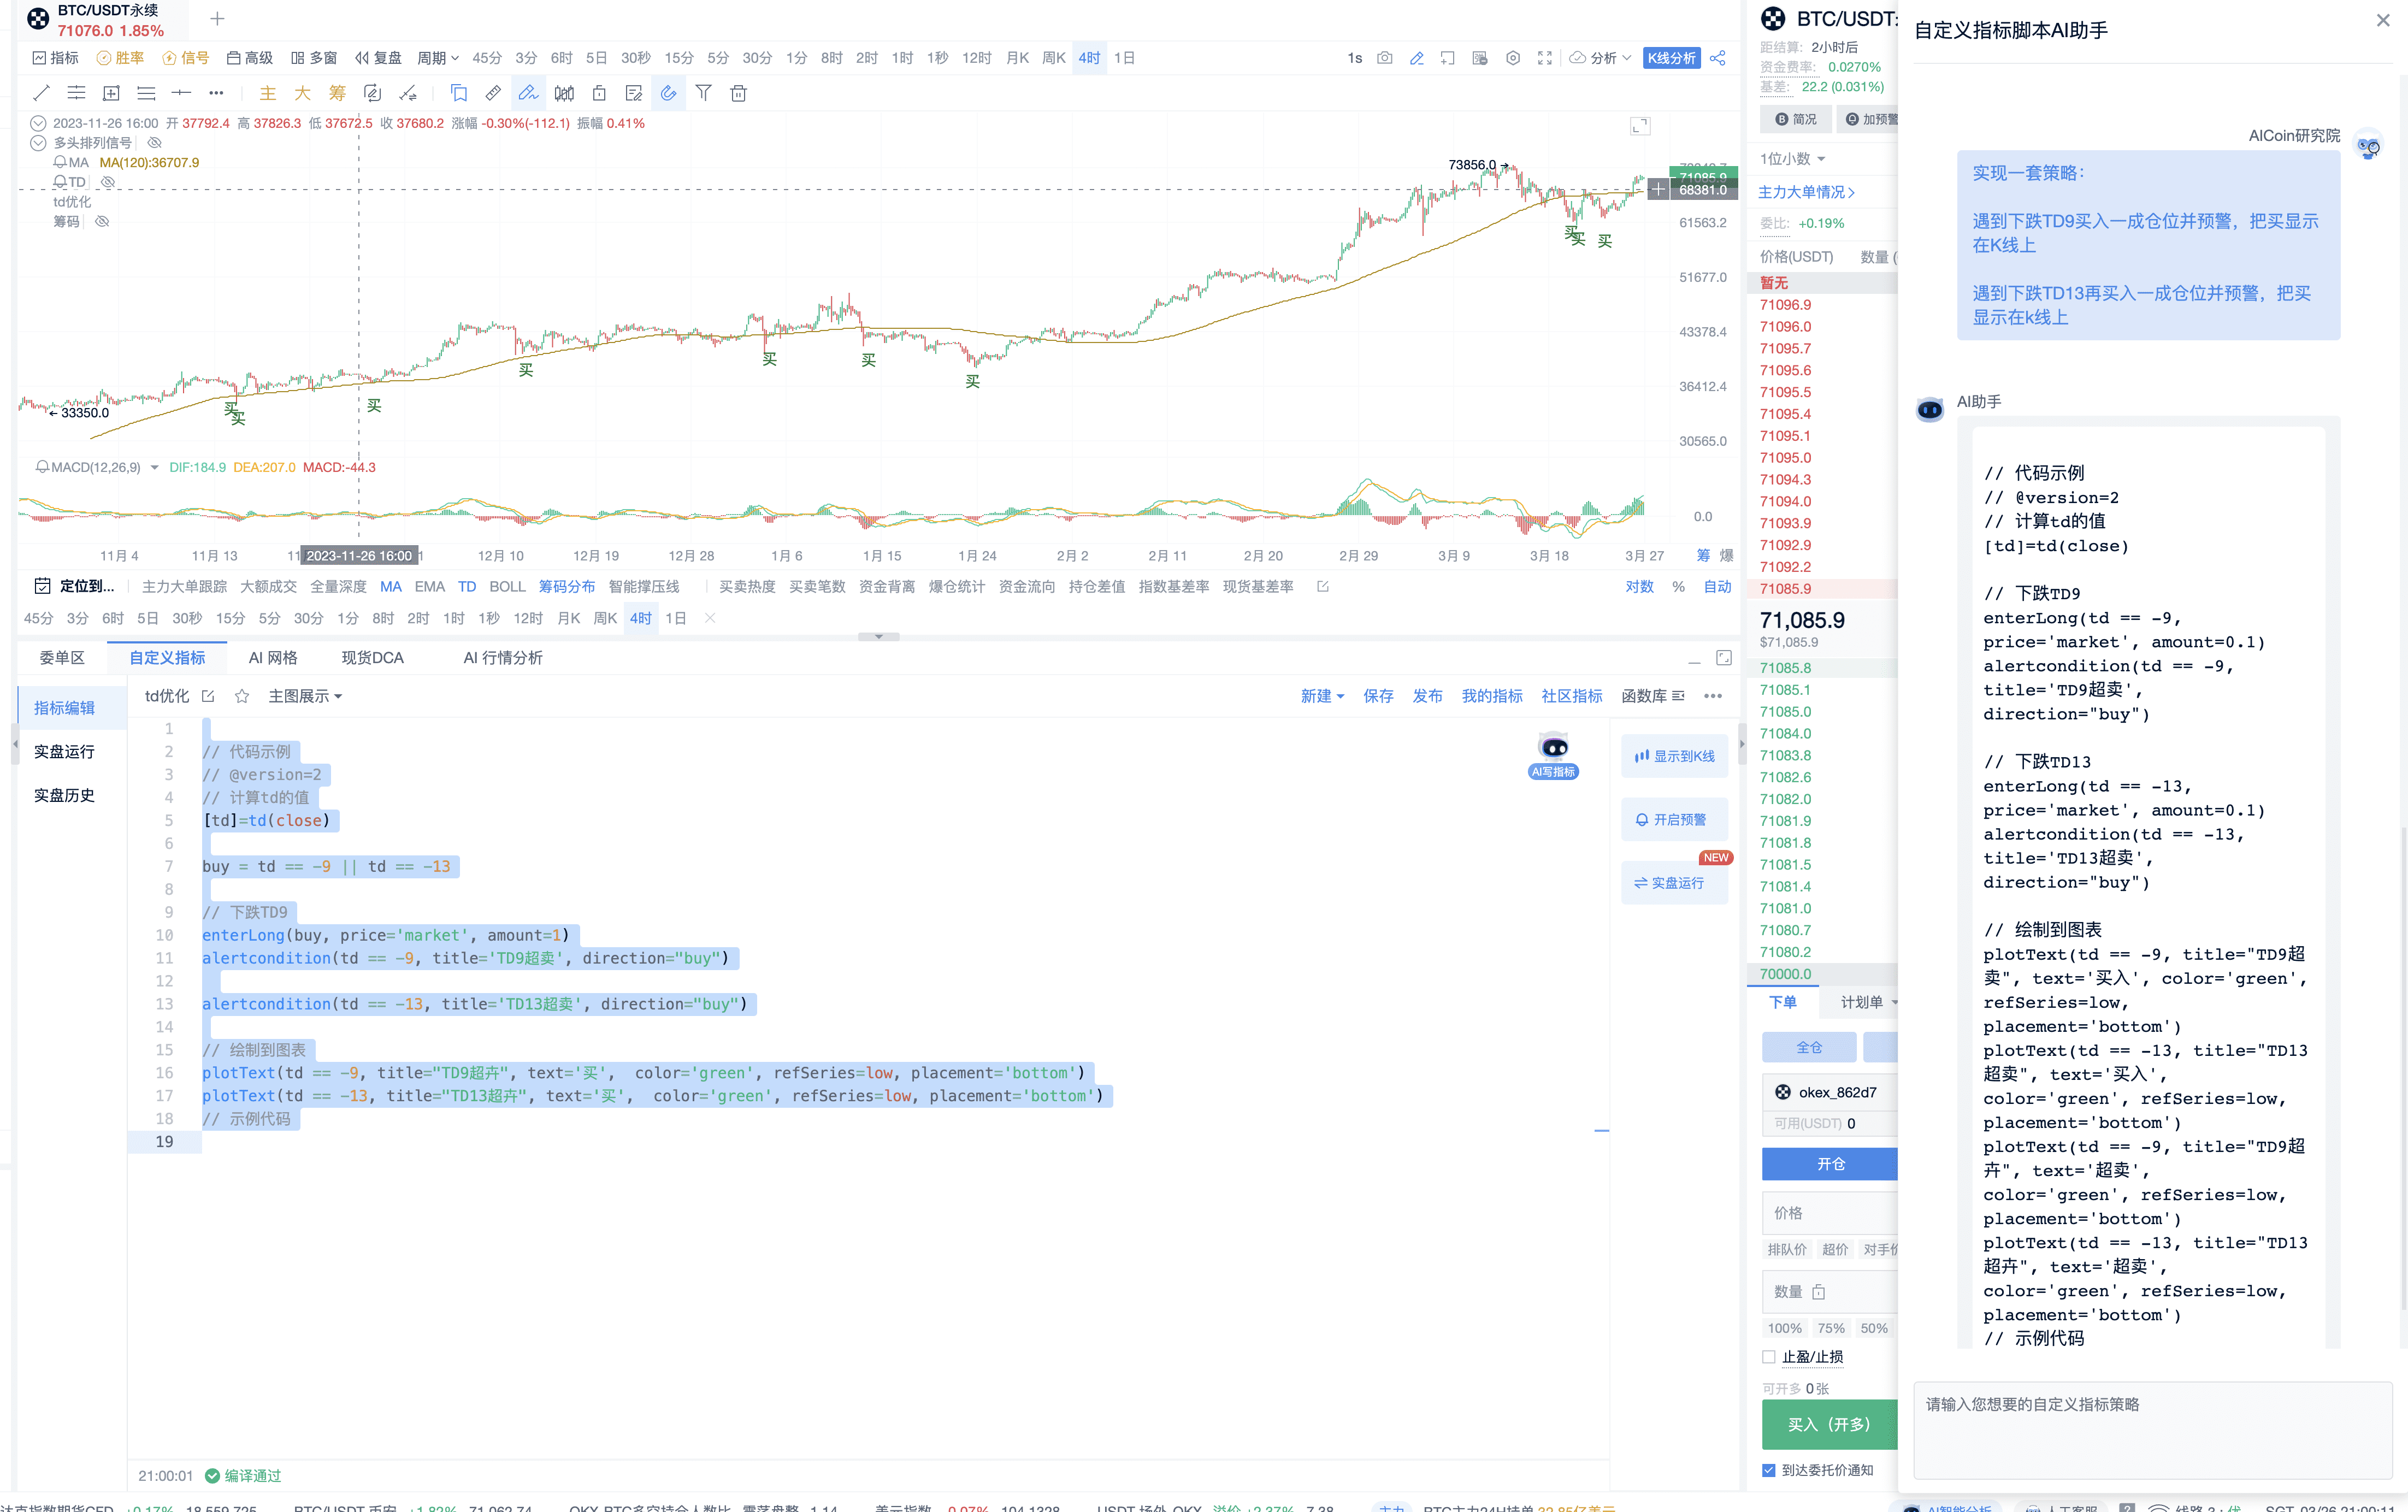
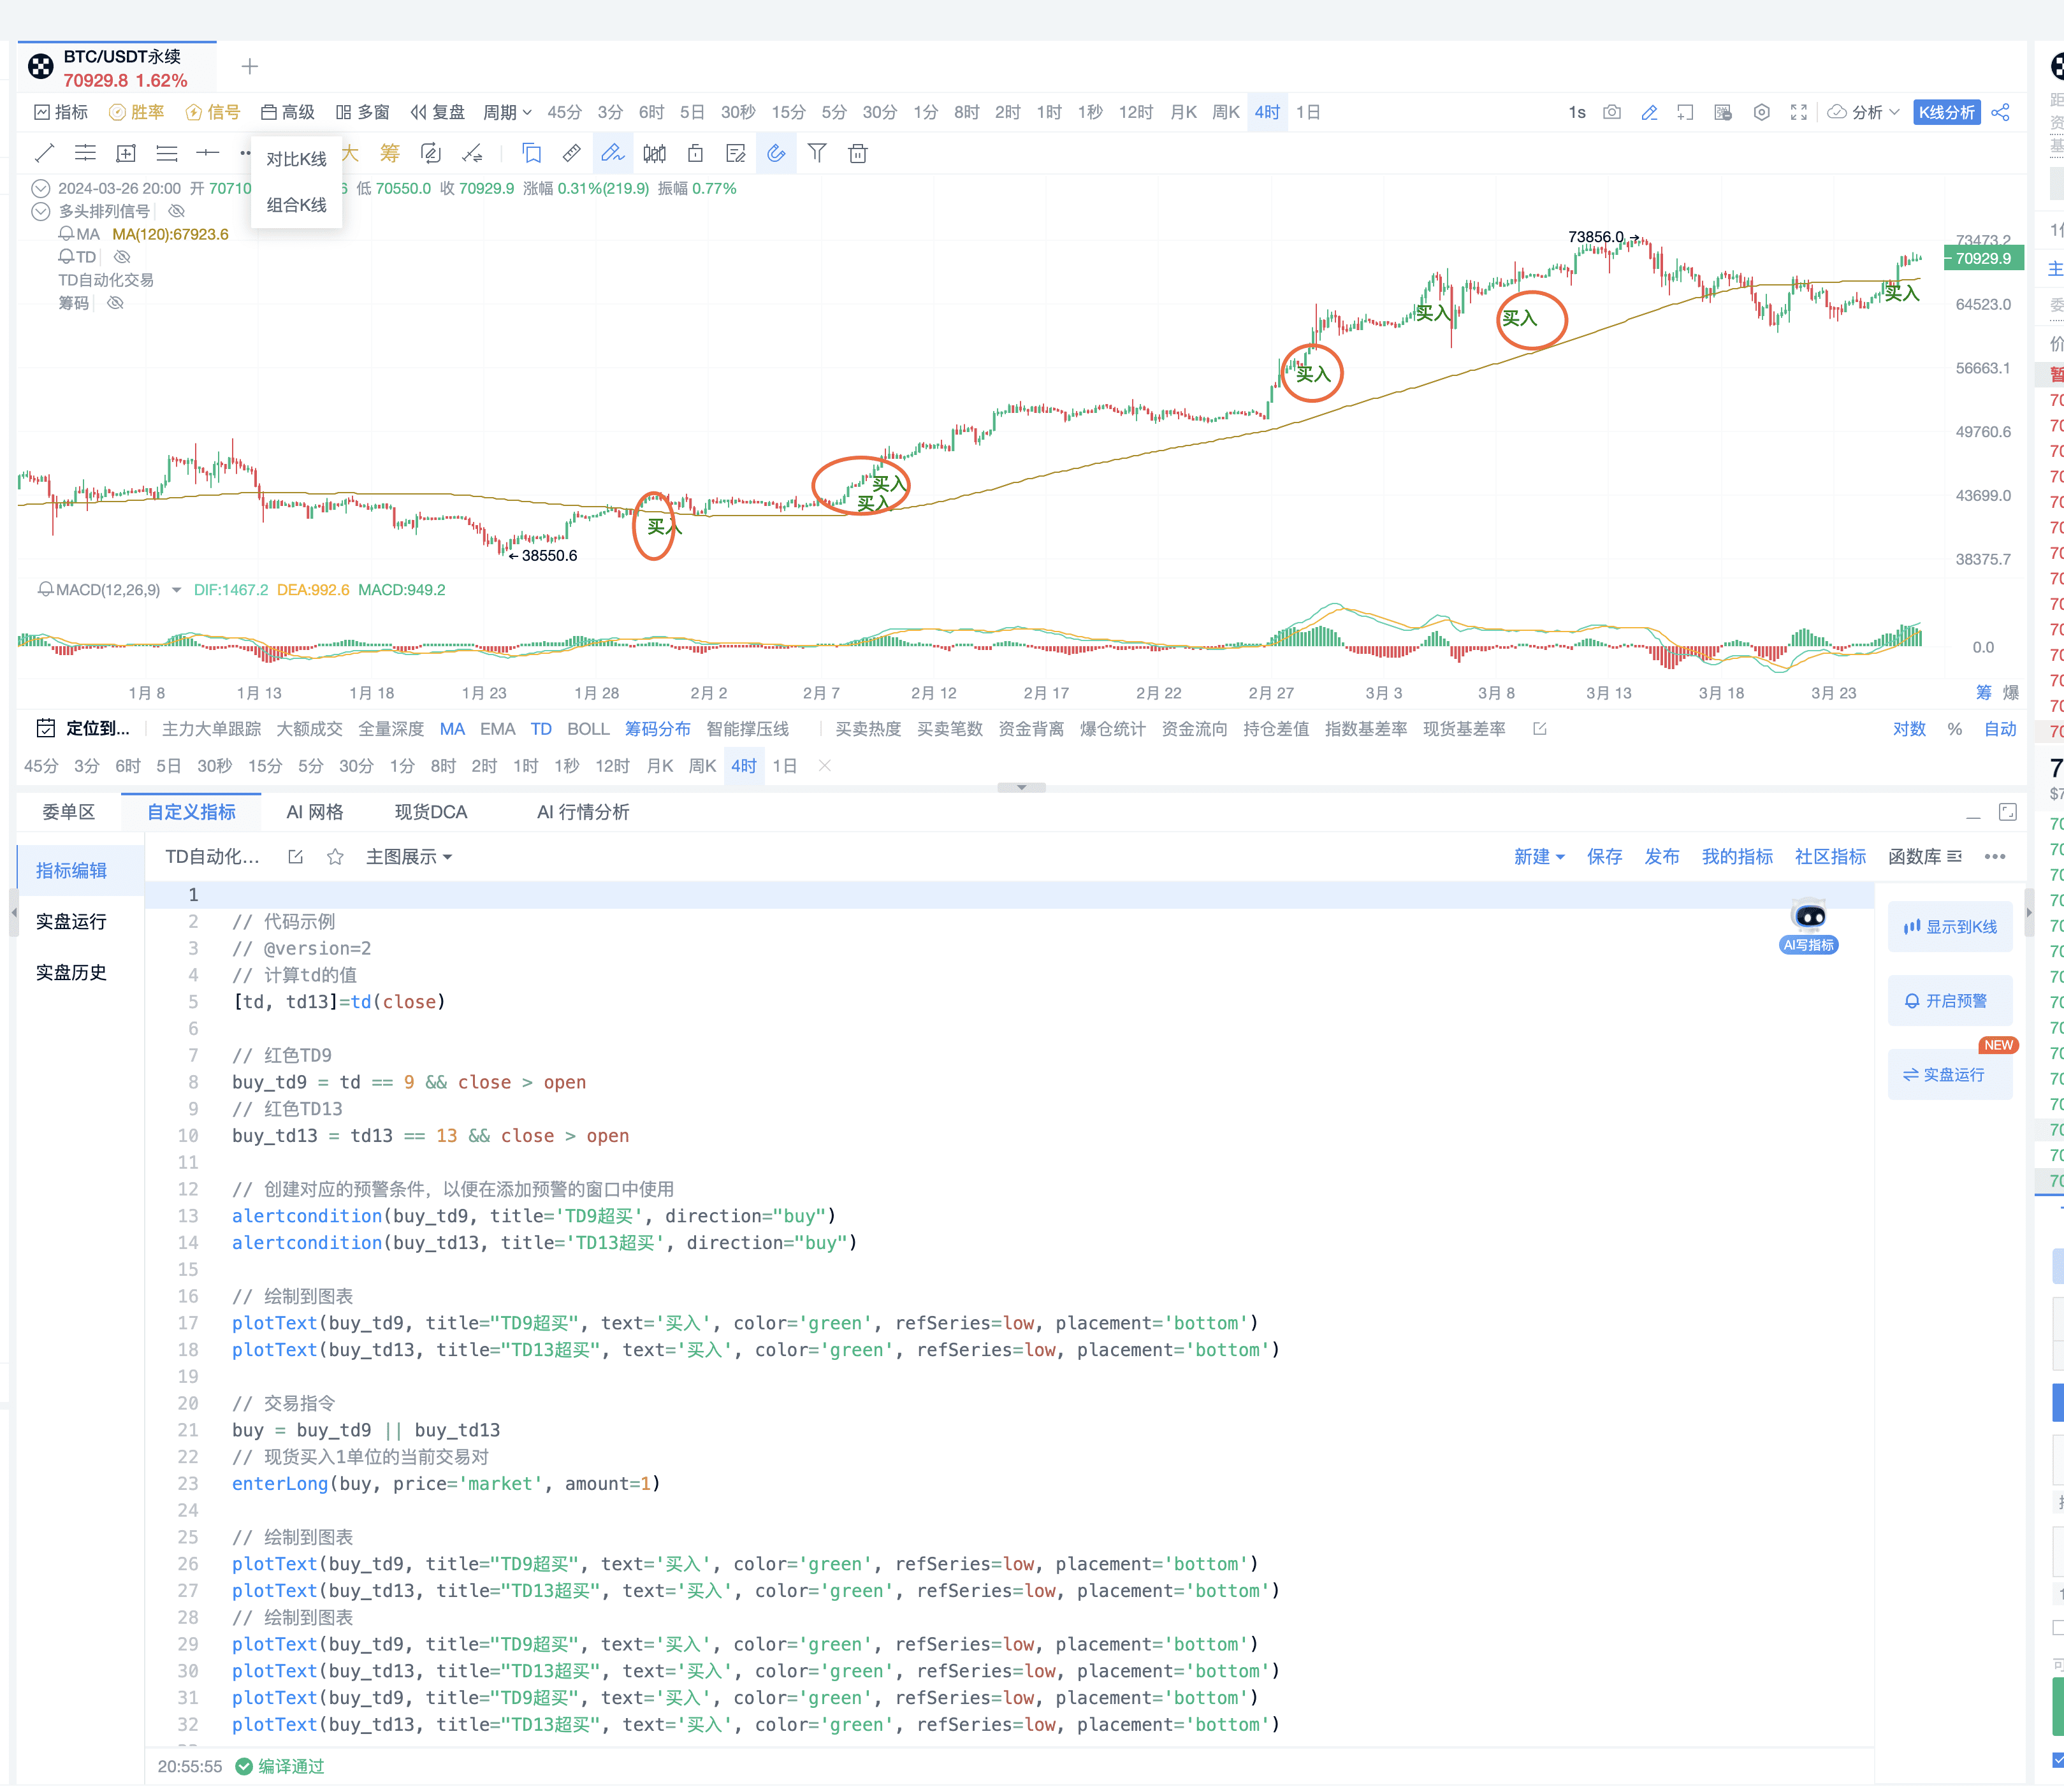
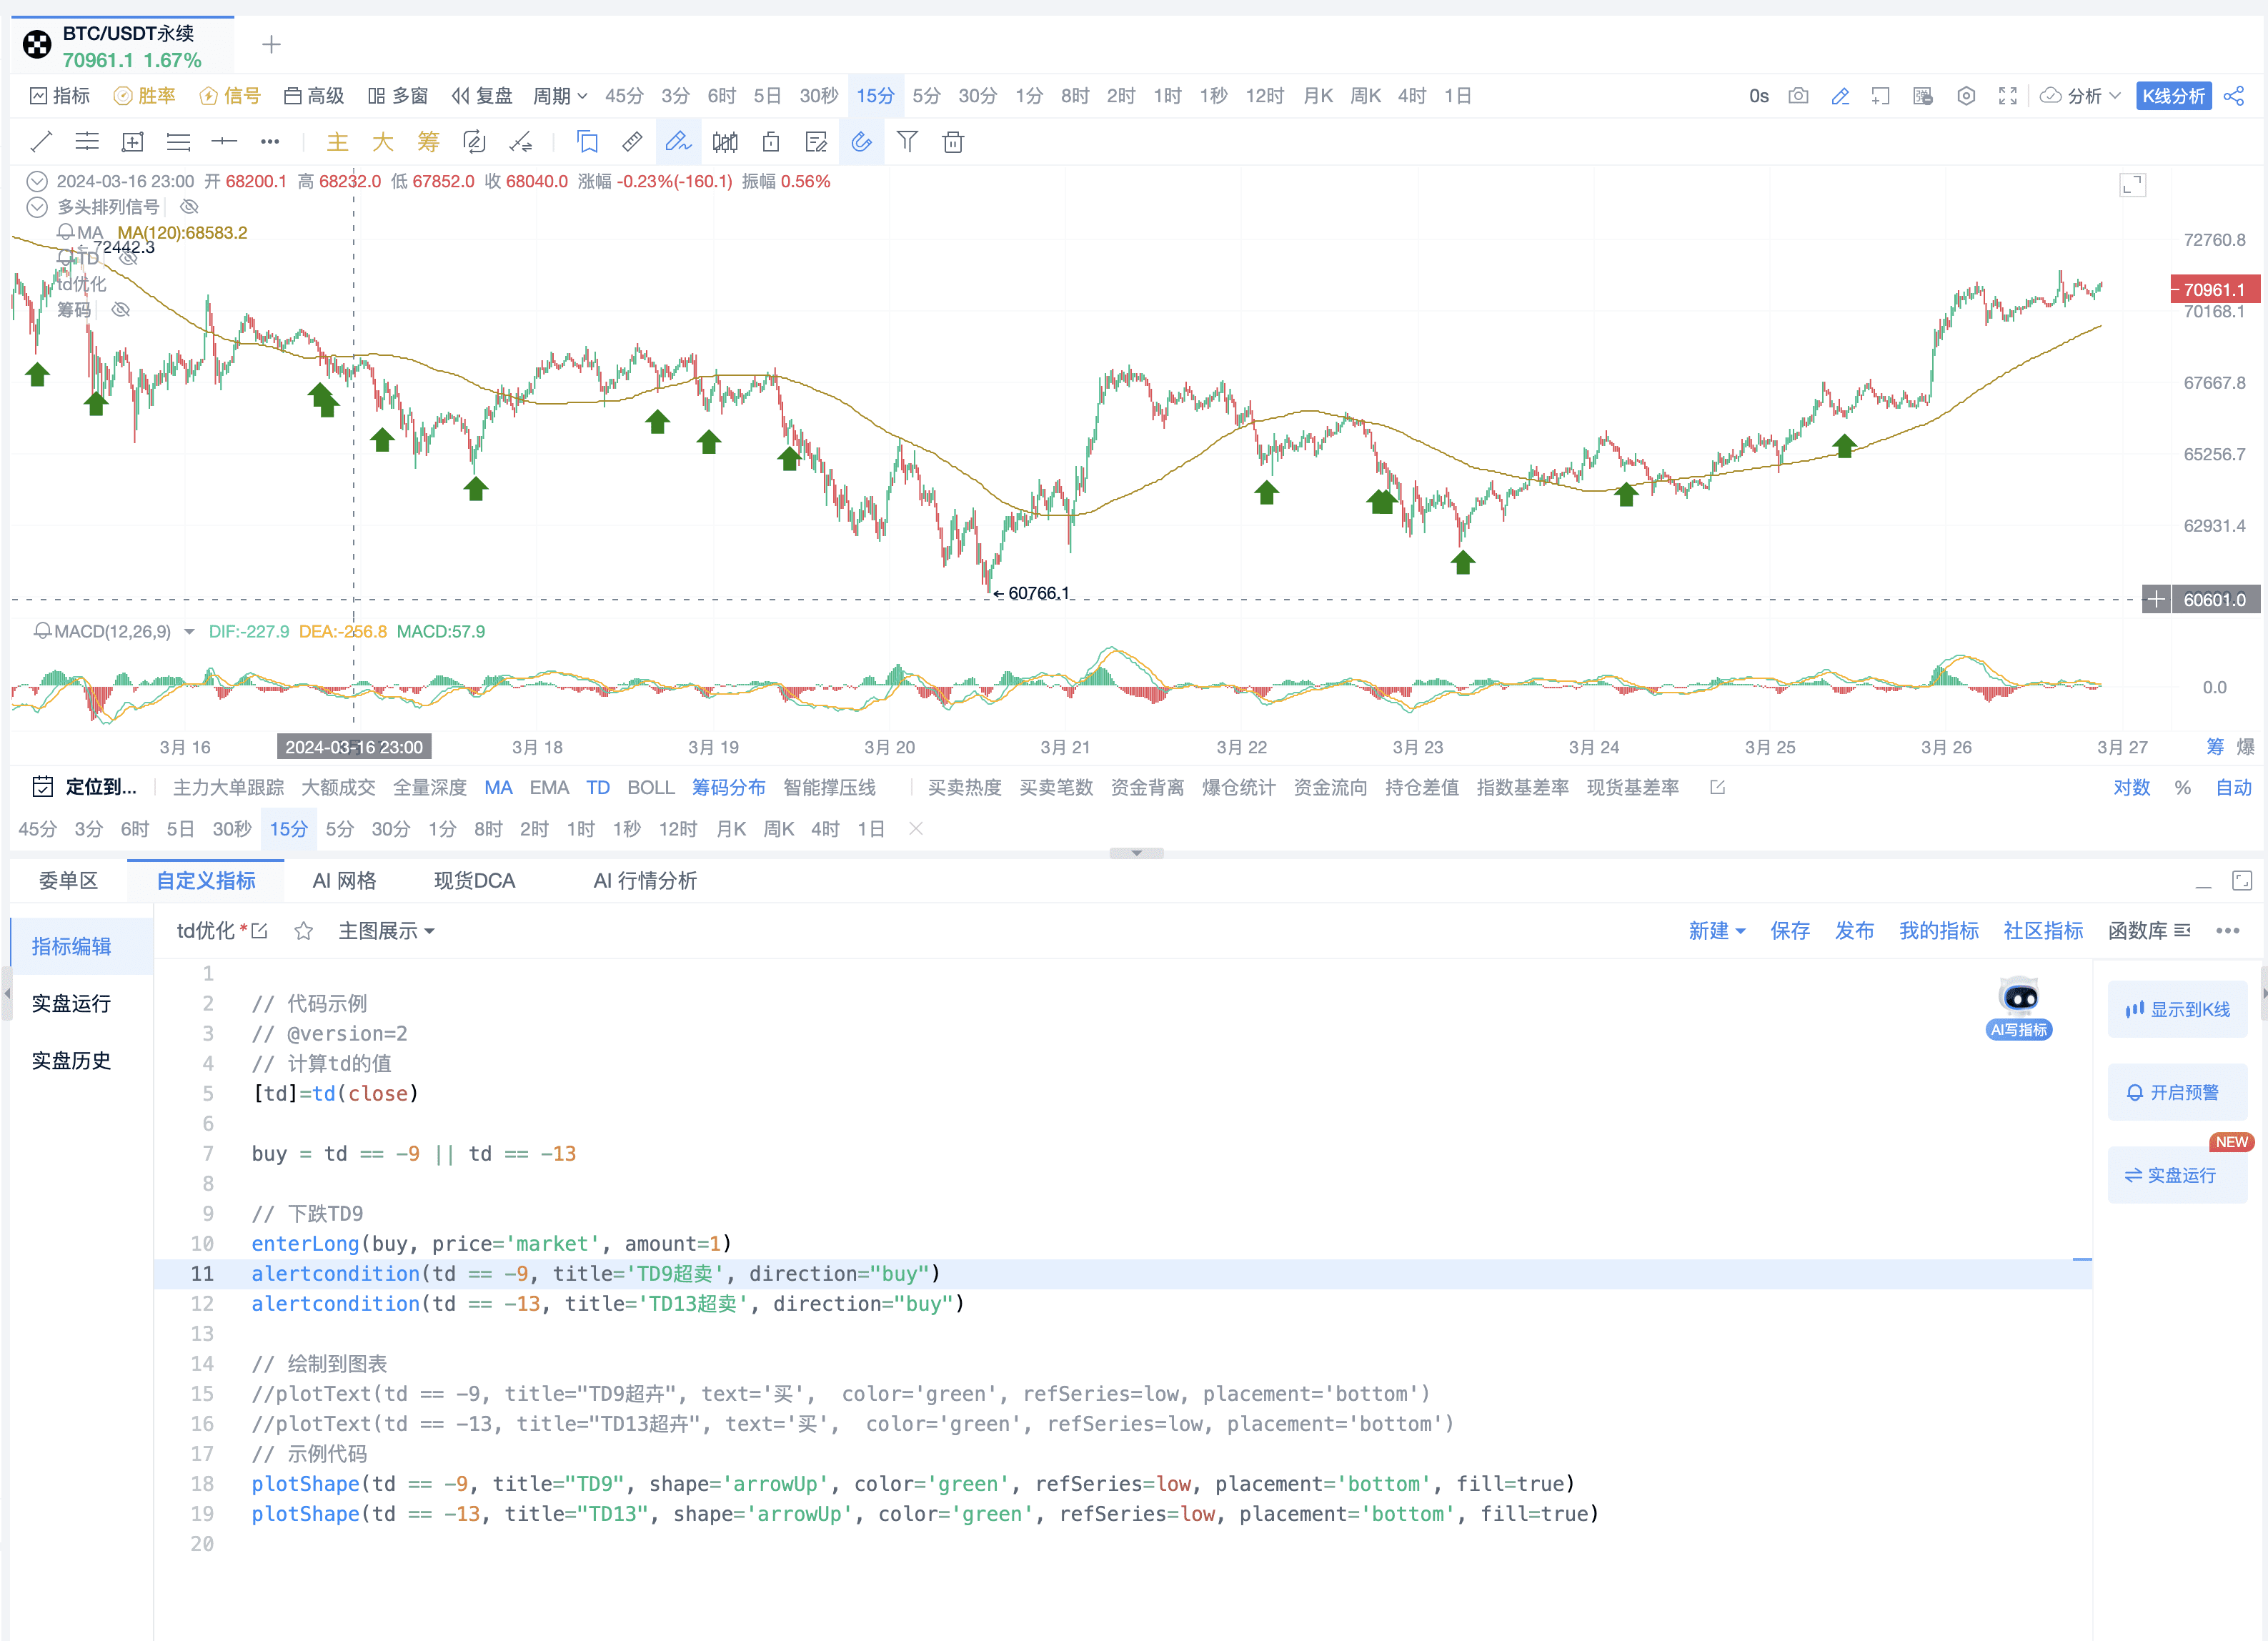
Final code display
// Code example
// @version=2
// Calculate the value of TD
[TD]=TD(close)
buy = TD == -9 || TD == -13
// Downward TD9
enterLong(buy, price='market', amount=1)
alertcondition(TD == -9, title='TD9 Oversold', direction="buy")
alertcondition(TD == -13, title='TD13 Oversold', direction="buy")
// Draw to the chart
plotText(TD == -9, title="TD9 Oversold", text='Buy', color='green', refSeries=low, placement='bottom')
plotText(TD == -13, title="TD13 Oversold", text='Buy', color='green', refSeries=low, placement='bottom')
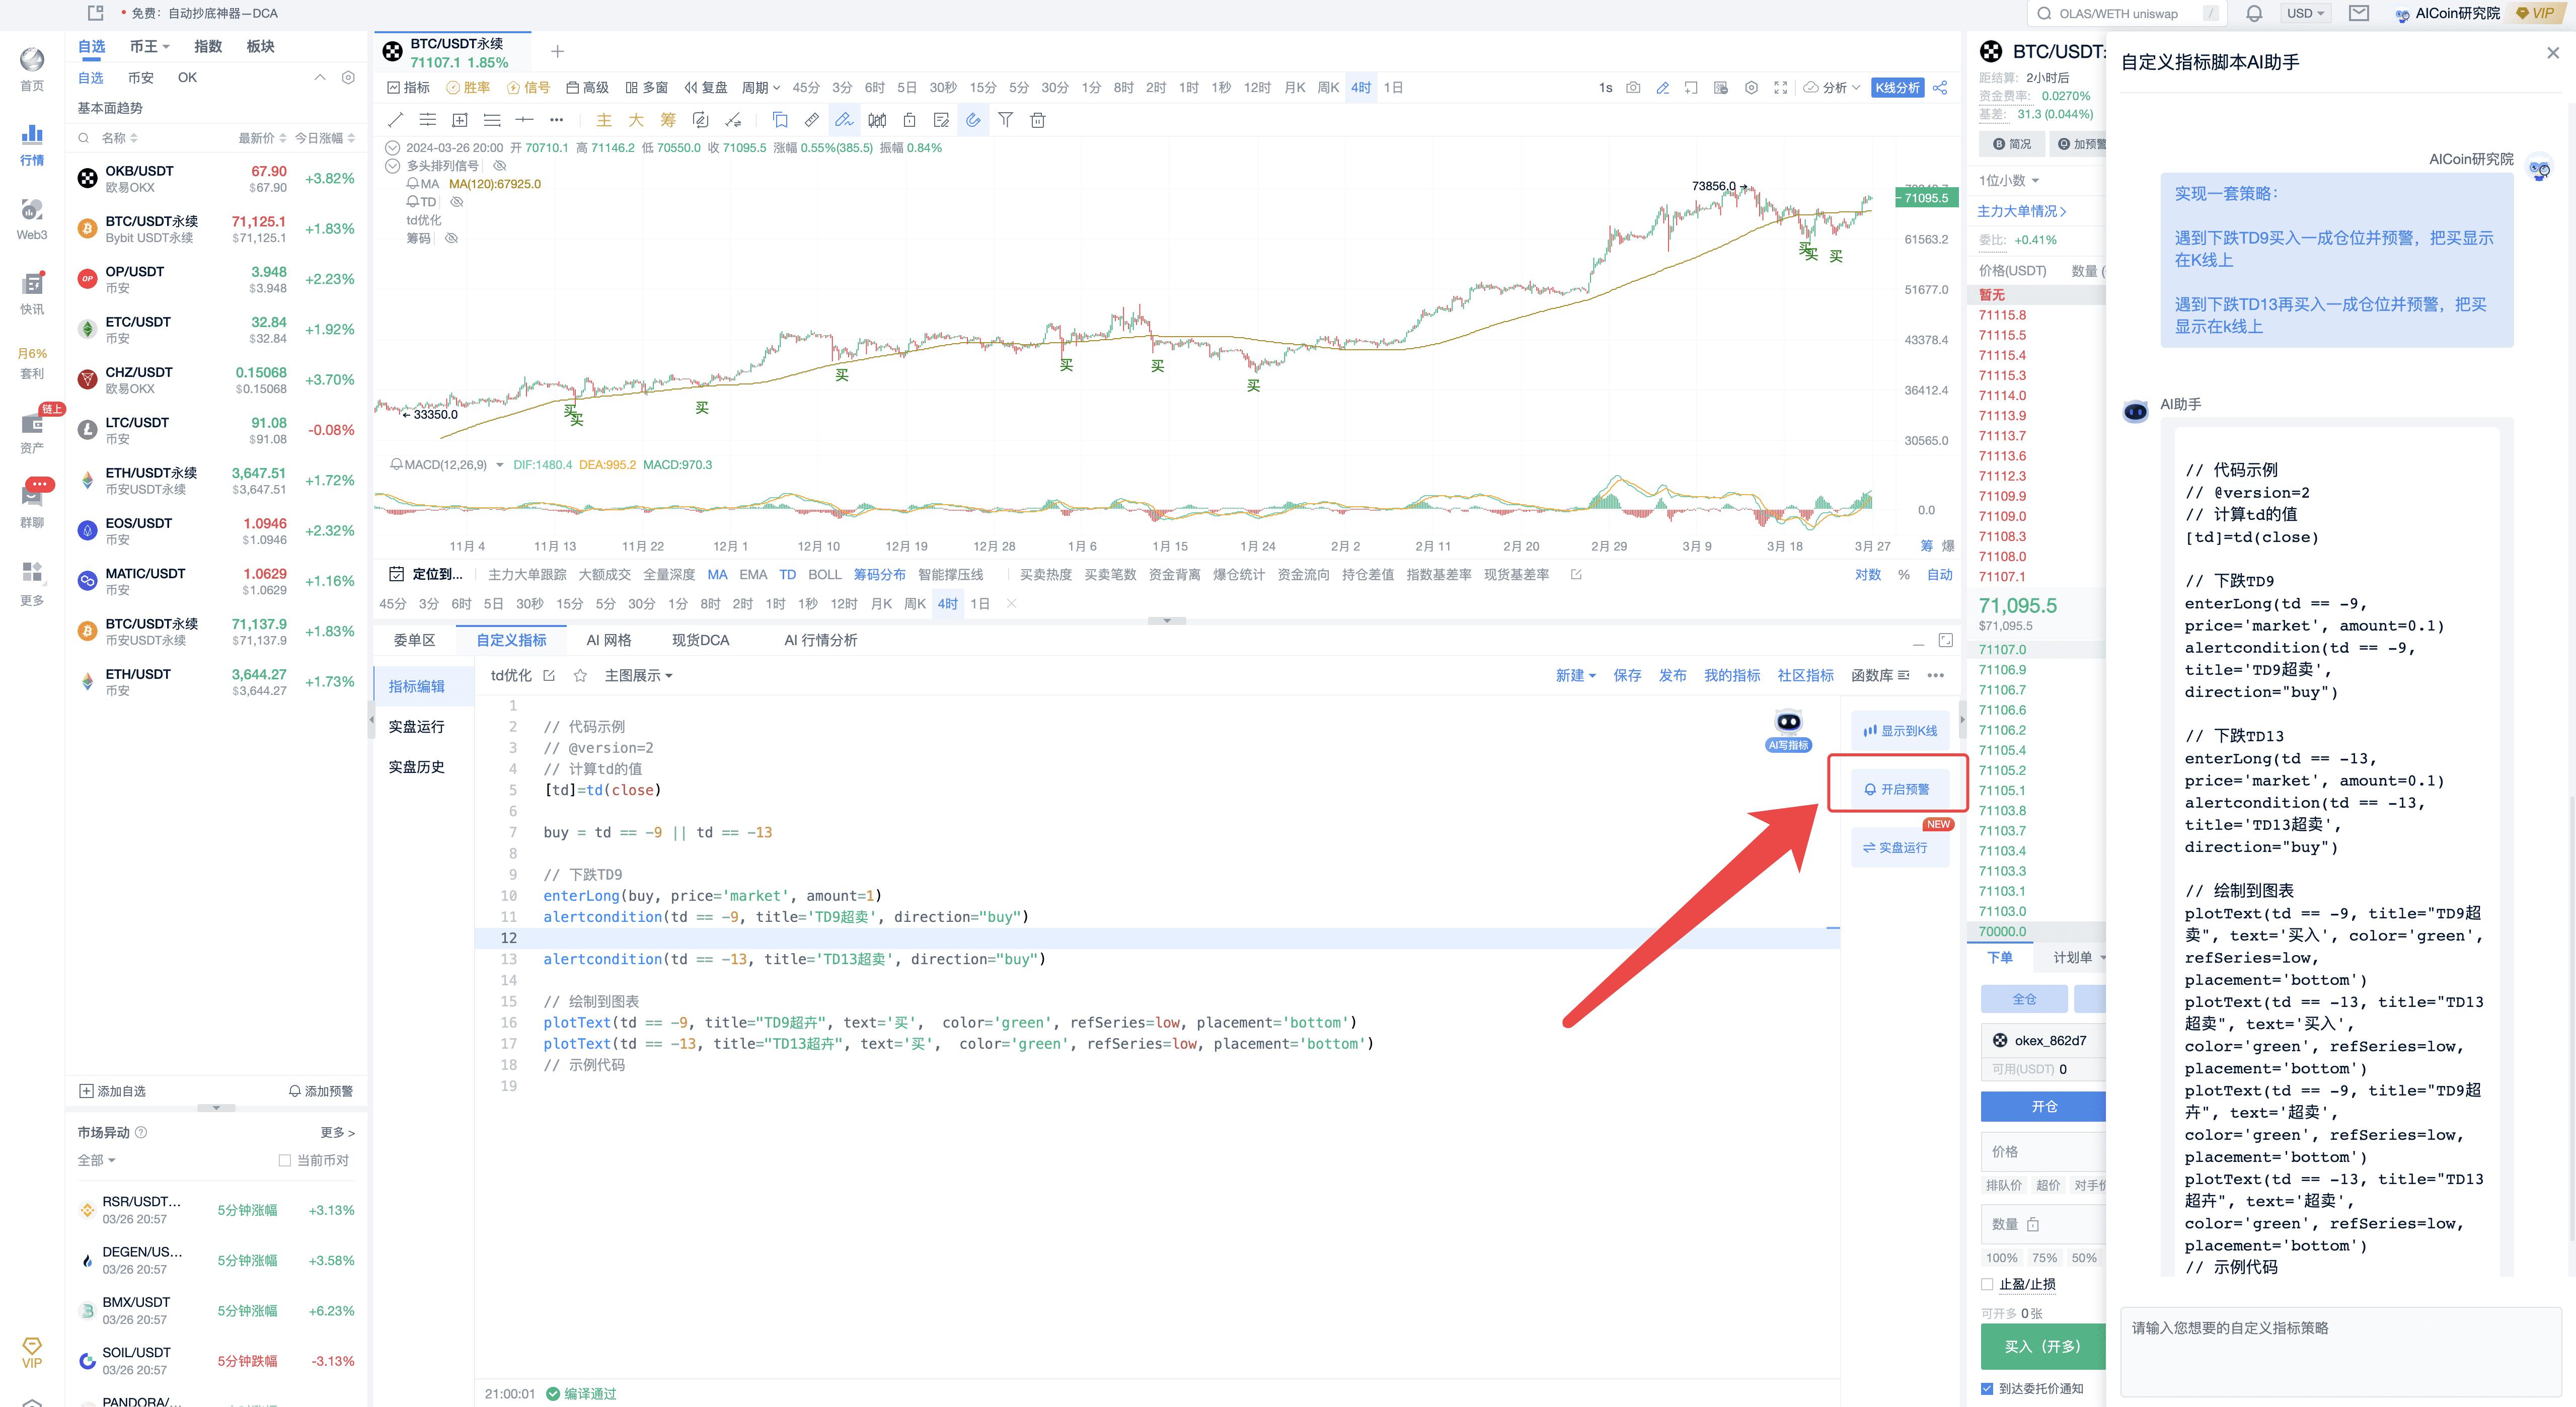
- If only alerts are needed, you can simply enable the alerts
- Look at the 15-minute signal, pay attention to the bottoming signal
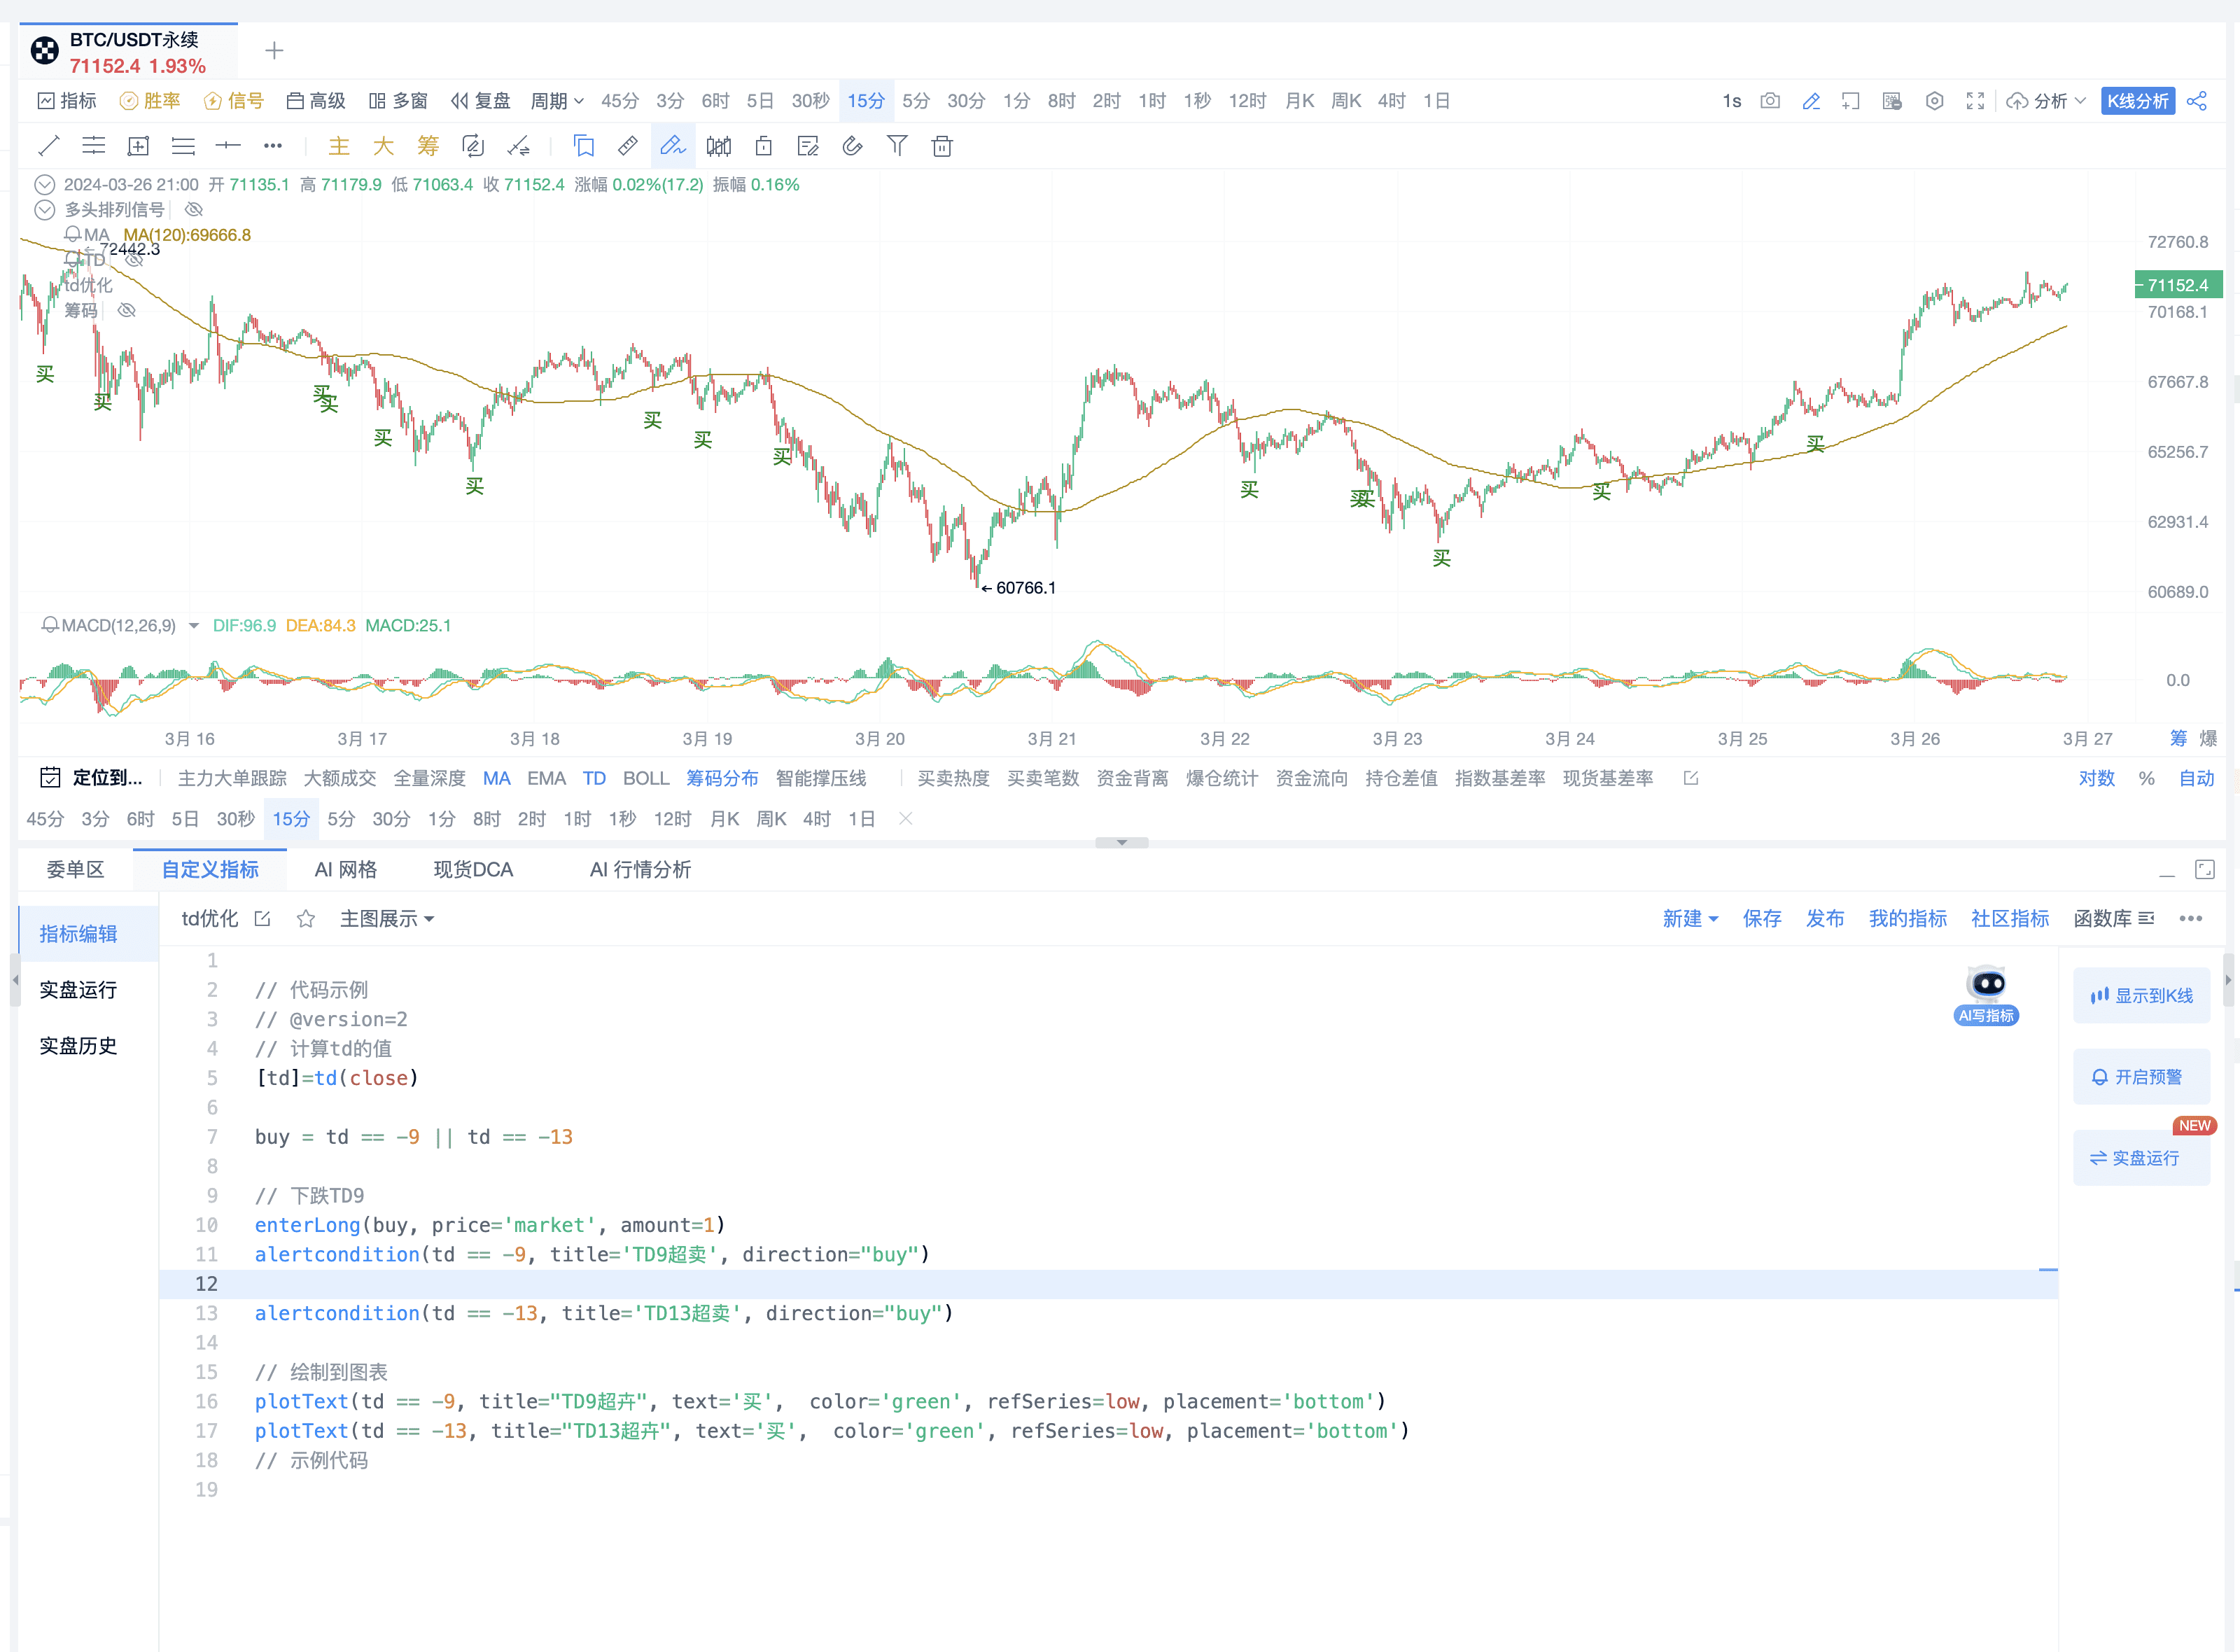
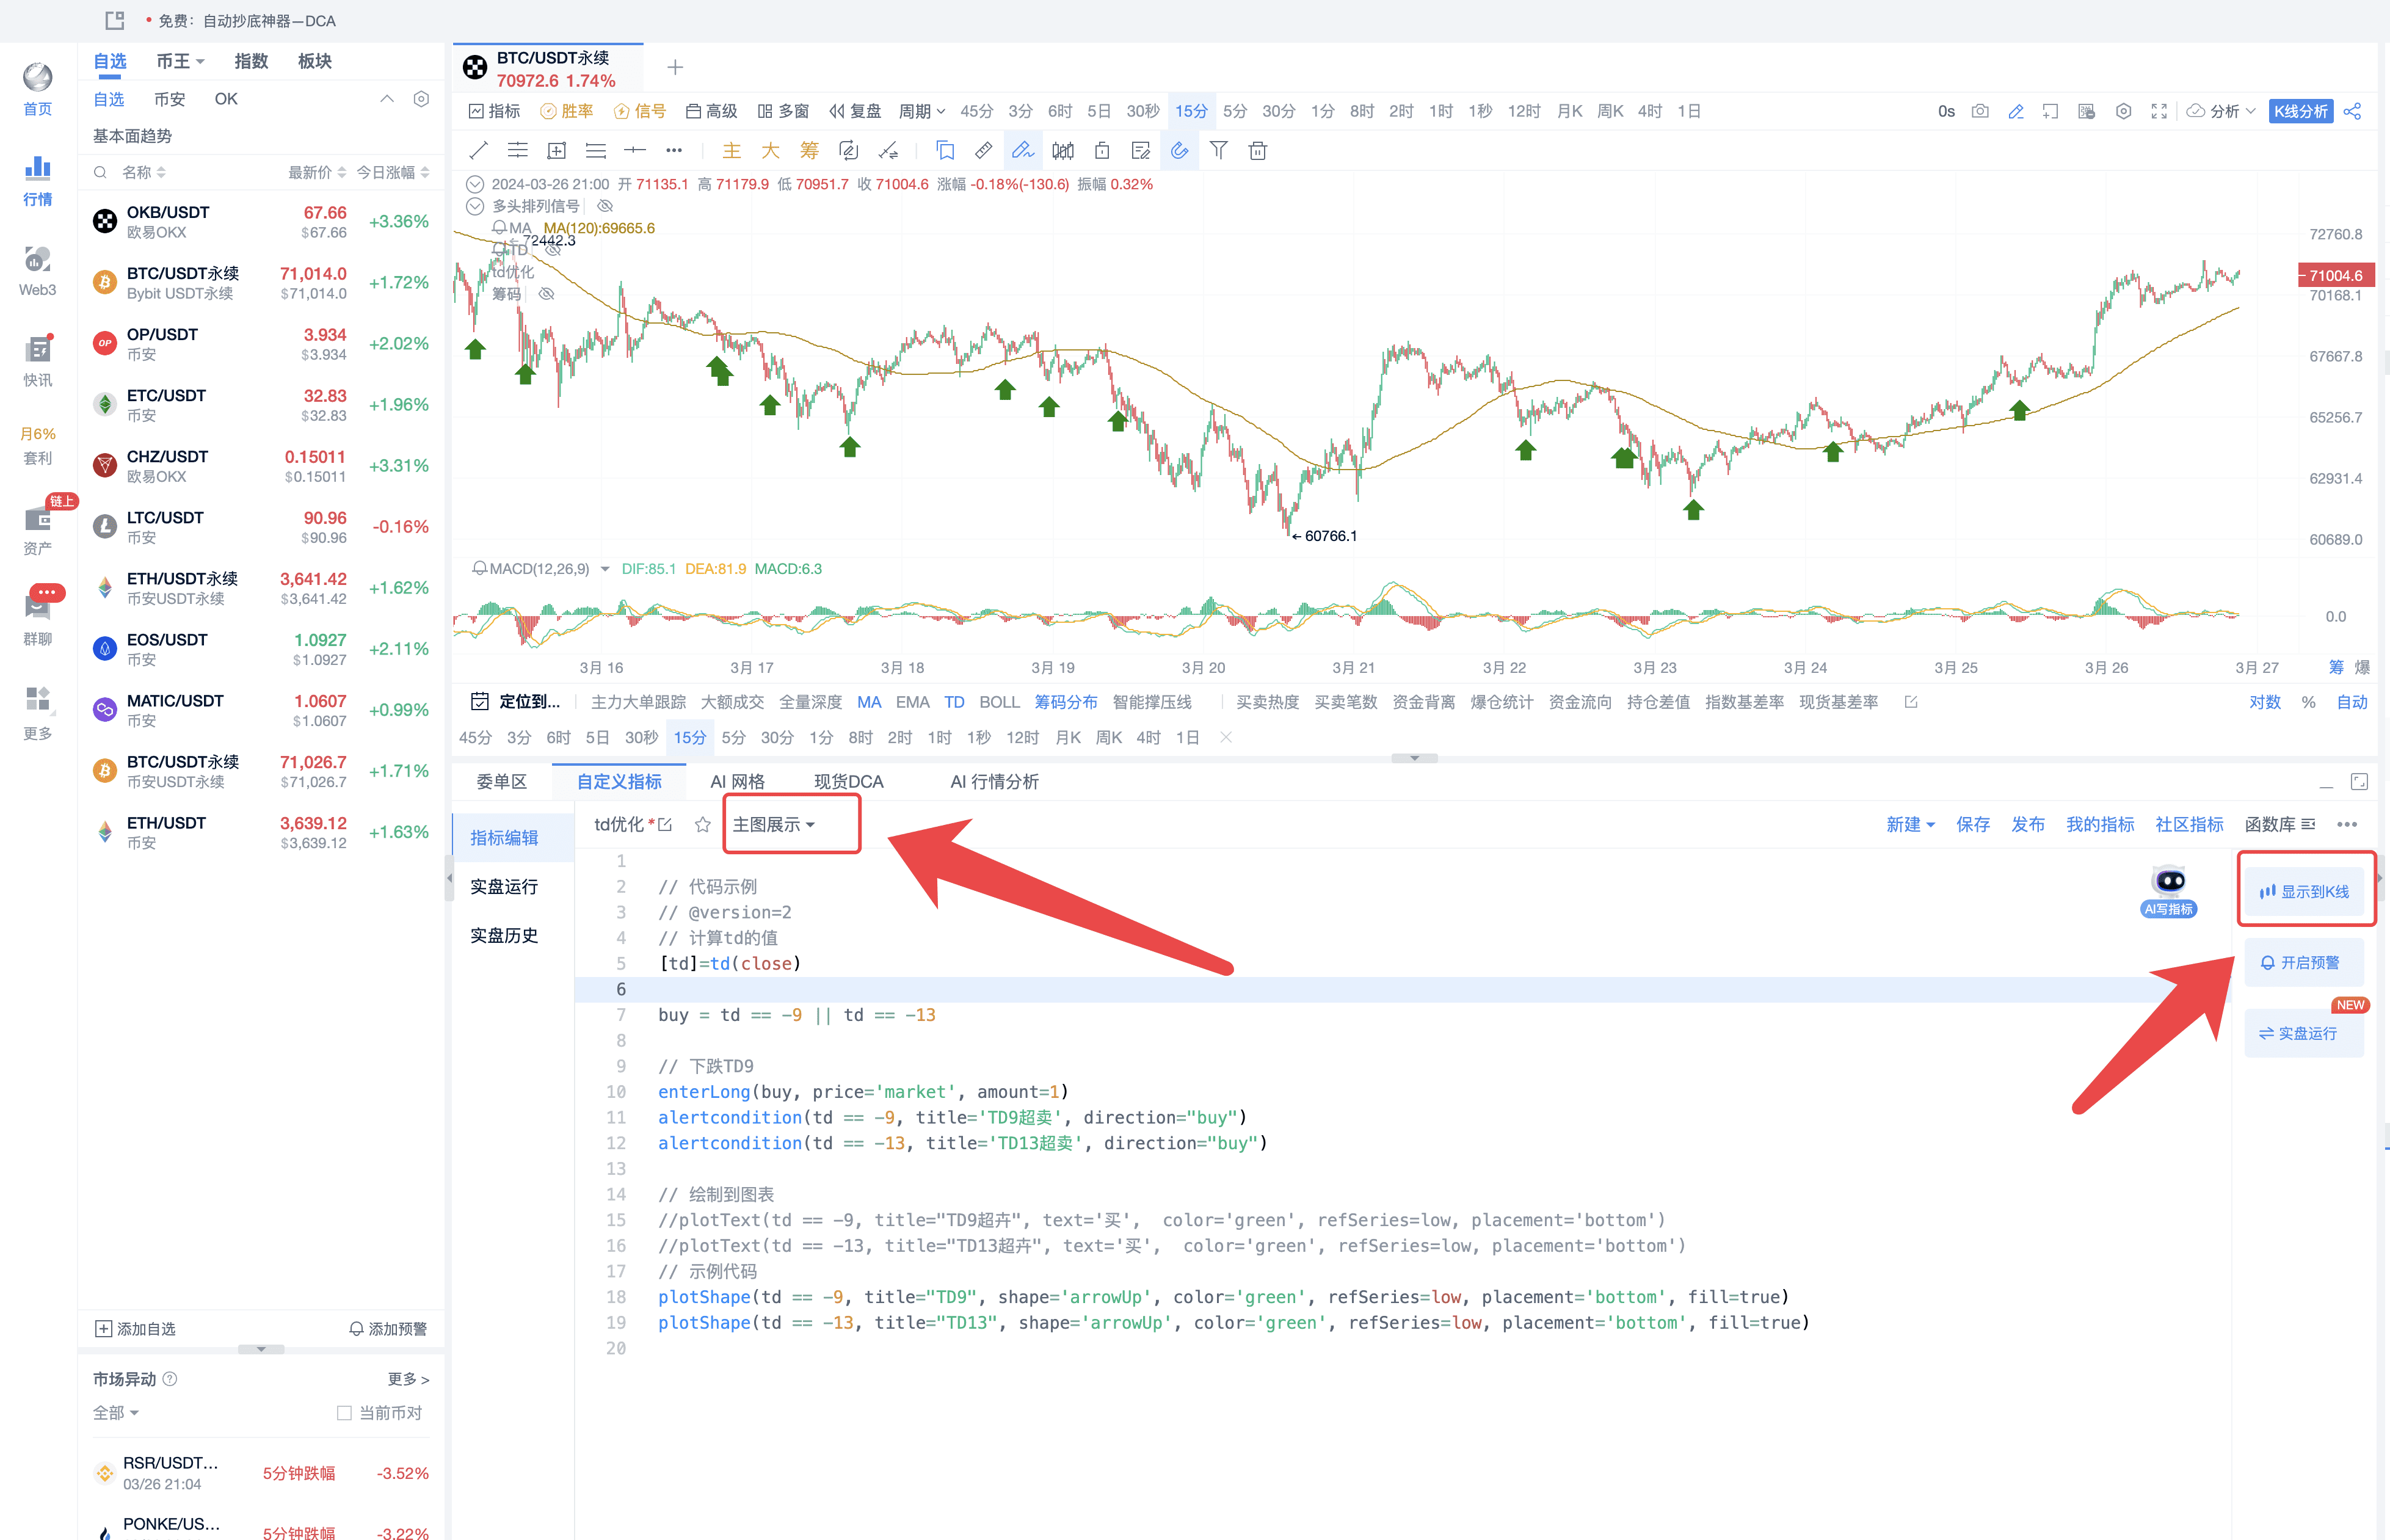
- Change the text to arrows as shown in the figure
Code display from the above image:
// Code example
// @version=2
// Calculate the value of TD
[TD]=TD(close)
buy = TD == -9 || TD == -13
// Downward TD9
enterLong(buy, price='market', amount=1)
alertcondition(TD == -9, title='TD9 Oversold', direction="buy")
alertcondition(TD == -13, title='TD13 Oversold', direction="buy")
// Draw to the chart
//plotText(TD == -9, title="TD9 Oversold", text='Buy', color='green', refSeries=low, placement='bottom')
//plotText(TD == -13, title="TD13 Oversold", text='Buy', color='green', refSeries=low, placement='bottom')
// Example code
plotShape(TD == -9, title="TD9", shape='arrowUp', color='green', refSeries=low, placement='bottom', fill=true)
plotShape(TD == -13, title="TD13", shape='arrowUp', color='green', refSeries=low, placement='bottom', fill=true)
- As shown in the figure, paste the above code
Click to display on the candlestick chart
The PRO version supports chip distribution, main force large order display, AI indicator writing, Xiao A analysis, and other functions. For more information and to open an account, click the link: https://aicoin.app/zh-CN/vip/chartpro
For more live content, please follow AICoin's "News/Information-Live Review" section, and feel free to download AICoin PC-end
免责声明:本文章仅代表作者个人观点,不代表本平台的立场和观点。本文章仅供信息分享,不构成对任何人的任何投资建议。用户与作者之间的任何争议,与本平台无关。如网页中刊载的文章或图片涉及侵权,请提供相关的权利证明和身份证明发送邮件到support@aicoin.com,本平台相关工作人员将会进行核查。