This article is only a personal market view and does not constitute investment advice. If you operate according to this, you are responsible for your own gains and losses.
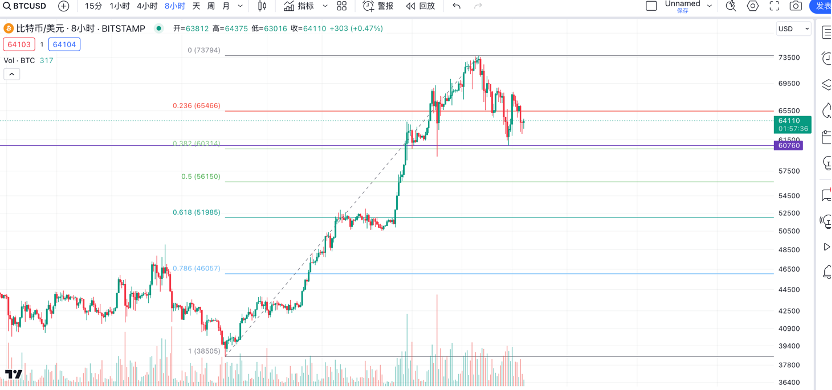
BTC has been in a retracement for nearly 10 days, forming a head and shoulders pattern. If the head and shoulders pattern is formed and broken, the target position will be around 50,000, which is the previous range and Fibonacci retracement level of around 61.8% in late February.

However, there is no need to worry too much before the actual break of the head and shoulders pattern. In a generally rising environment, the formation of head and shoulders is very common, but it is only when the neckline is truly broken that the pattern is established.
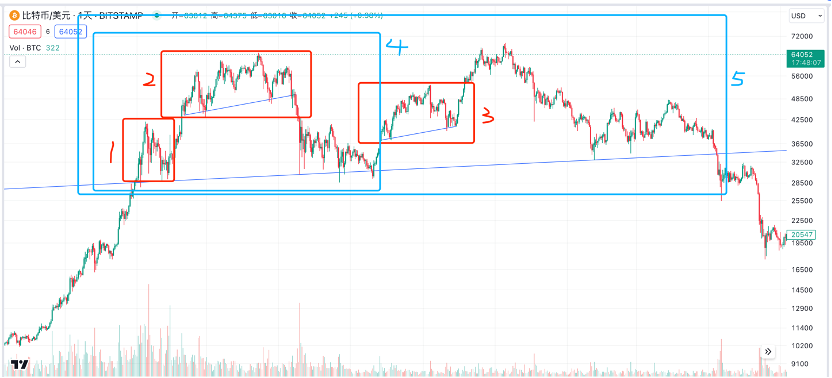
Taking the previous bull market of BTC in 2020-2021 as an example: in the chart below, a total of 5 head and shoulders patterns can be identified. 3 small-scale head and shoulders patterns in red boxes have a relatively short construction time. Two large-scale head and shoulders patterns in blue boxes have a longer construction time. The red head and shoulders pattern at the top and the largest blue head and shoulders pattern both broke. The subsequent retracement and the estimated decline of the head and shoulders pattern also match.

In addition, the 3 head and shoulders patterns that did not break the neckline all saw repeated oscillations near the neckline at the end of the right shoulder before rising again. Therefore, for the recent market situation, it is only necessary to focus on whether the area around 60,000 will be effectively broken.
I personally believe that the high probability low point is around 60,000, and there may be a dip to around 59,000 before rebounding. Without any special stimulating events, it is difficult to truly break through.
Head and shoulders patterns generally represent a reversal pattern. If it is not the true market top, it almost always finds support at the neckline and then rises. I do not believe that the bull market will end in the near future, so this is just a mid-term rest, not the true top. Therefore, the head and shoulders pattern here should not be a reversal pattern, but a continuation pattern in the upward process, meaning the likelihood of breaking the neckline is small.
For BTC, pay more attention to the situation around 60,000. This is a very good buying opportunity with high cost-effectiveness, small stop-loss space, and large profit space. It is very likely that the low point on March 20th is the low point of this retracement.
Follow me and earn maximum trend profits with minimal operations.

免责声明:本文章仅代表作者个人观点,不代表本平台的立场和观点。本文章仅供信息分享,不构成对任何人的任何投资建议。用户与作者之间的任何争议,与本平台无关。如网页中刊载的文章或图片涉及侵权,请提供相关的权利证明和身份证明发送邮件到support@aicoin.com,本平台相关工作人员将会进行核查。


