Click to watch the video: Master Chen's 3.21 Video: Simple Indicator Historical Top Prediction, Pay Attention to the 69000 Level of the Market
So Bitcoin has been experiencing large fluctuations these past few days. I didn't expect that a large long candlestick yesterday would completely offset the previous decline. My view remains the same: Bitcoin has always been in a bull market, and the plan remains unchanged. Hold on to the profits from the long position. Today, let's also predict the future top.

First, let's take a look at the Bitcoin daily chart. I mentioned in a previous video that the Pi Cycle indicator is very famous historically. From 2022 to 2023, Bitcoin was at the bottom below 20000, and the Pi Cycle indicator can predict the bottom of Bitcoin. Then, the Pi Cycle Top indicator in this daily chart can predict the future top of Bitcoin.
Why do I keep telling everyone that Bitcoin is still in a bull market? Because we can see that the orange line is approximately the 111 moving average, and the green line above it is the 350 moving average multiplied by 2. We can also see that historically, whenever these two lines have crossed, it could be the top of Bitcoin.
We can see that in April 2021, when Bitcoin rose to around 65000, it eventually fell to around 30000 at the high point of 60000. This position is also a very important top.
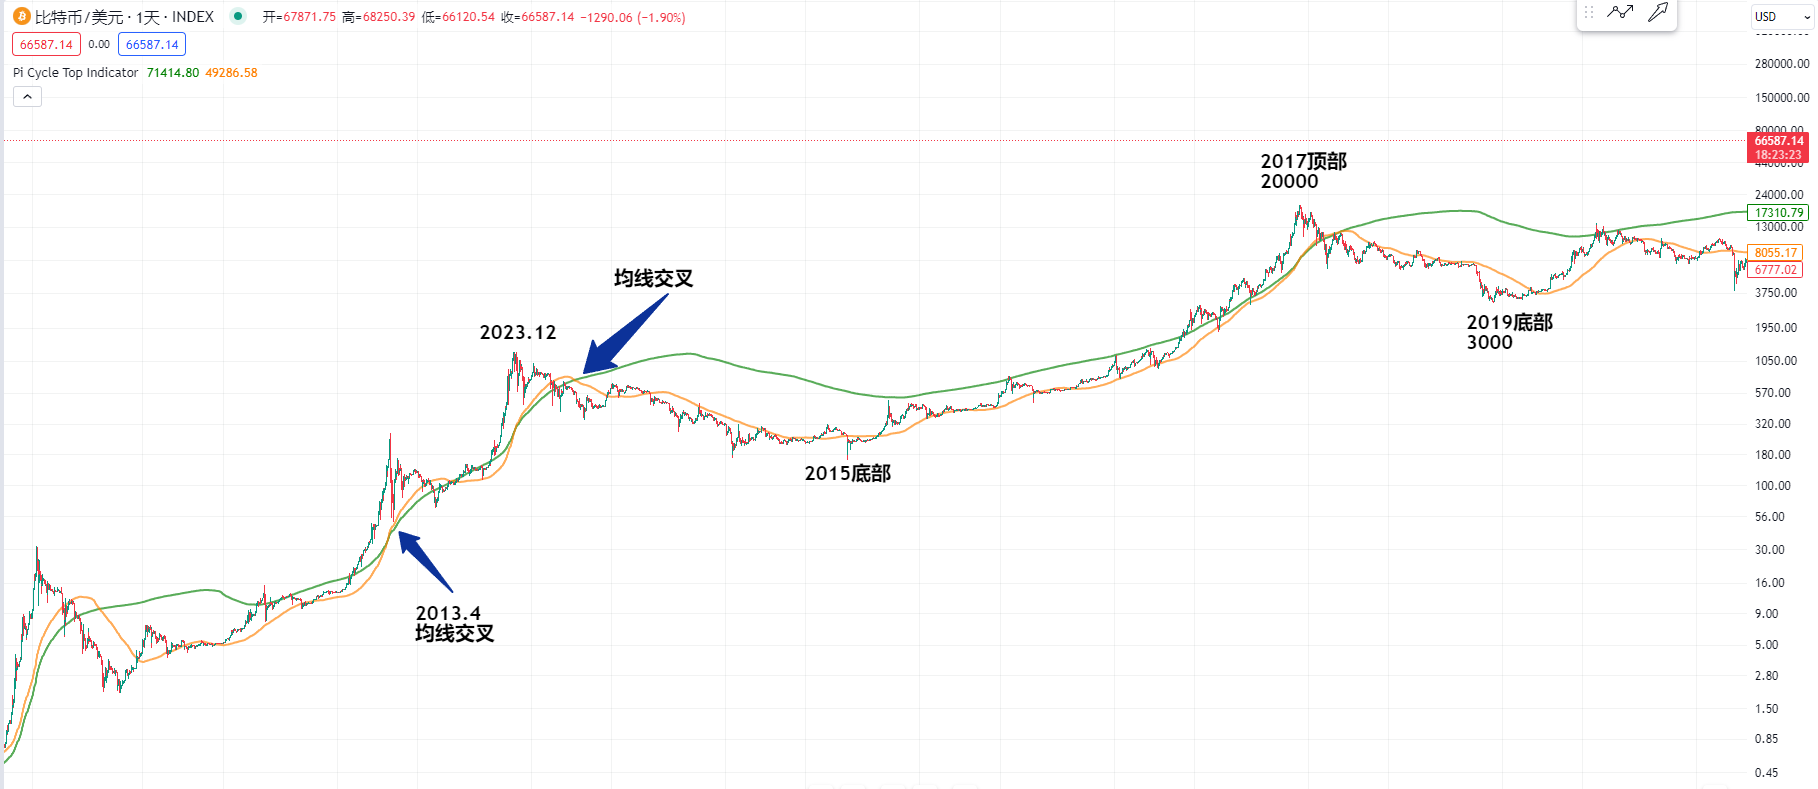
Or we can see that from the bottom of Bitcoin in 2015 to the top in 2017, we can see that the orange line crossed the green line at the position of 2000 dollars, which is roughly the very important top of 2017. It continued to decline to 3000 dollars and then hit bottom in 2019.
Or we can see that during the bull market of Bitcoin in 2012, the Pi Cycle Top indicator can be observed. At that time, Bitcoin rose to around 300 dollars in the month of 2013. It's the same: the orange moving average crossed the green moving average.
This crossing position could possibly be a temporary top, and Bitcoin fell from this position. Or Bitcoin reached the top in December 2013, and again, the two moving averages crossed.
So my point has always been that we don't need to worry about the decline of Bitcoin, because as I mentioned before, Bitcoin is relatively cheap below 50,000 dollars. The recent decline in these days, we should still hold on to the long position for the medium and long term, because in the future, when these two moving averages rise to a very high position and cross, it could be the top of Bitcoin. So the distance between these two lines is still very far.
 Then let's take a look at the wedge shape of the Bitcoin daily chart, including what I mentioned in today's article. Last night, there was also some news from the Federal Reserve, and Powell mentioned that there may be three interest rate cuts this year. Currently, the price has not reached 59000.
The two candlesticks yesterday can also be seen as a bullish engulfing. As I mentioned last time, 69000 and 68500 are still short-term pressures. We should try to observe whether the price can challenge the high point of 69000 in the short term. Is it possible for Bitcoin to continue a large upward trend at the current position? If it doesn't break through 69000 in the short term, it may consolidate at the current position.
More strategies can be added to the live account.
Candlesticks are king, trends are emperor. I am Master Chen, focusing on BTC, ETH spot contracts for many years. There is no 100% method, only 100% following the trend. Daily updates on macro analysis articles and technical analysis review videos across the web.  Friendly reminder: Only the official public account (shown in the picture) is written by Master Chen. The advertisements at the end of the article and in the comments are not related to the author. Please discern carefully between true and false. Thank you for reading.
免责声明:本文章仅代表作者个人观点,不代表本平台的立场和观点。本文章仅供信息分享,不构成对任何人的任何投资建议。用户与作者之间的任何争议,与本平台无关。如网页中刊载的文章或图片涉及侵权,请提供相关的权利证明和身份证明发送邮件到support@aicoin.com,本平台相关工作人员将会进行核查。


