This article is only a personal market view and does not constitute investment advice. If you operate according to this, you are responsible for your own gains and losses.
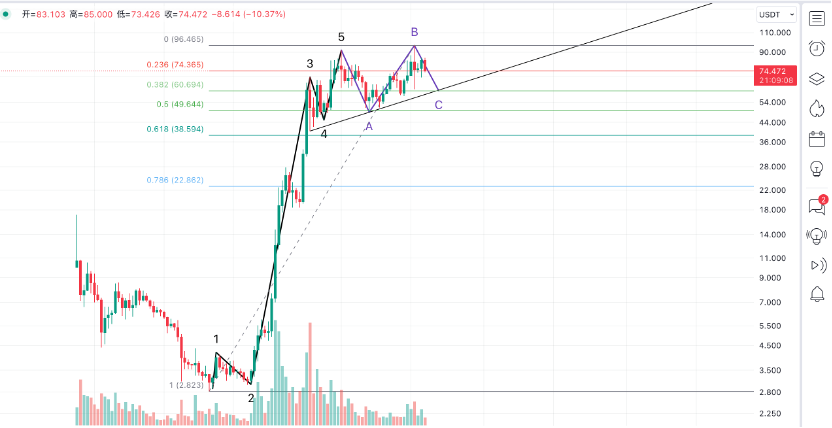
Today I took a look at Ordi, and it should be entering the final stage of the pullback.
Looking at the 3-day candlestick chart, from mid-September 2023 to the end of 2023, there is a complete 5-wave structure. The past two months from January to the present have been a pullback wave phase.
Currently, it is in the final small-level C wave of the pullback wave.

From the chart, Ordi has a clear upward trend line. From the Fibonacci perspective, there are three retracement support levels at 74, 61, and 50. Personally, I believe that all three of these prices are suitable for establishing positions or adding to positions. The possibility of breaking below 50 is minimal.
Once it breaks through 97 again, a new upward trend will be confirmed. As a leading cryptocurrency, if Ordi starts to rise, the entire cryptocurrency market will be driven.
BTC has been struggling to rise recently, and during the US stock trading hours, its performance has not been ideal. ETF continues to see net inflows, while the price remains stagnant, which is not a good sign in itself.
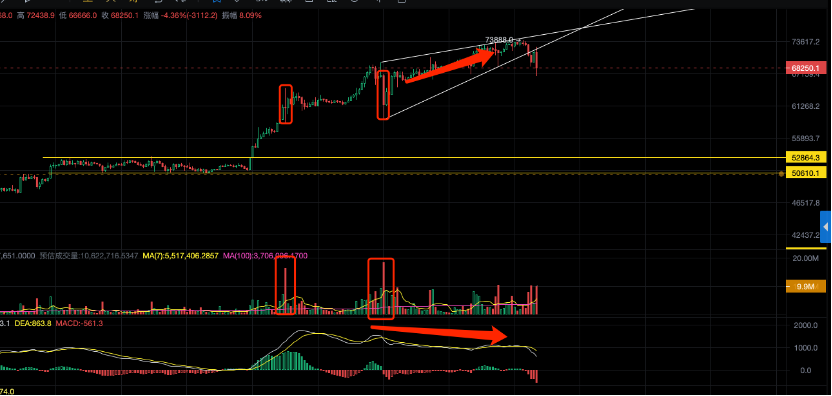
At the time of writing, the price of BTC has dropped to below 68,000. From the 4-hour chart, this forms a bearish wedge pattern after a sustained divergence. However, in a bull market, bearish views should not lead to short positions. Pullbacks are all about creating better buying opportunities. There are two massive volume candles near 59,000, indicating significant buying activity. Therefore, the likelihood of breaking below 59,000 in the subsequent pullback is not very high.
The trend after breaking the previous high of 69,000 is different from the trend after breaking 20,000 in 2020, so the subsequent trend cannot be assumed to be the same. However, it is certain that there will be profit-taking after breaking the previous high. Therefore, the current pullback can be seen as a retest after the breakthrough.
The most ideal trend here is a wide-ranging oscillation, slowly digesting over time, preferably maintaining a long period of oscillation as shown in the yellow line section in the chart. Around 70,000, after sufficient turnover, it can lay the foundation for the future takeoff.

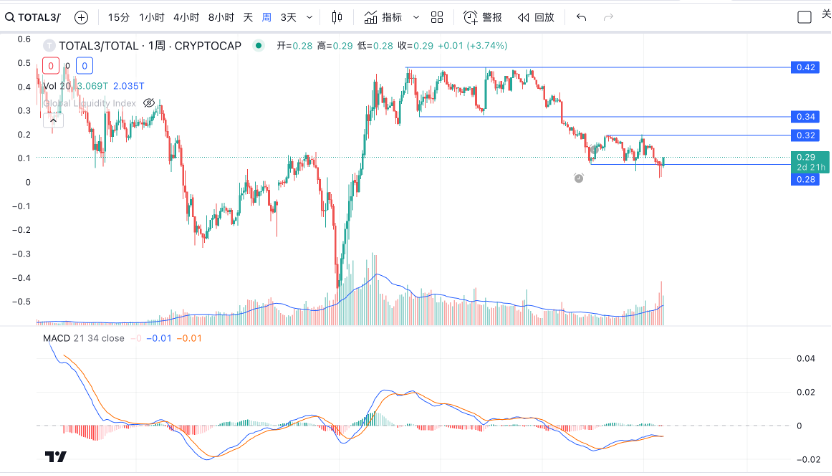
During BTC's oscillation, it can also give other altcoins a chance to perform. The following chart shows the market share of all coins except BTC and ETH. From a weekly perspective, the overall market share is still at a low level. But as mentioned in a previous article, the lowest point has most likely passed. Moreover, during this morning's pullback, the market share of altcoins rose against the trend, which is a positive signal for altcoins.
If BTC shows a rapid decline, then after the first wave of decline, it is highly likely that altcoins will start to rally.

As long as it's not high-leverage trading, pullbacks are a good thing. In any case, let the market move for a few days, and then take action once a more accurate market outline is identified.
Follow me to maximize trend profits with minimal operations.

免责声明:本文章仅代表作者个人观点,不代表本平台的立场和观点。本文章仅供信息分享,不构成对任何人的任何投资建议。用户与作者之间的任何争议,与本平台无关。如网页中刊载的文章或图片涉及侵权,请提供相关的权利证明和身份证明发送邮件到support@aicoin.com,本平台相关工作人员将会进行核查。


