Watch the video: Bitcoin market analysis 2024.02.06
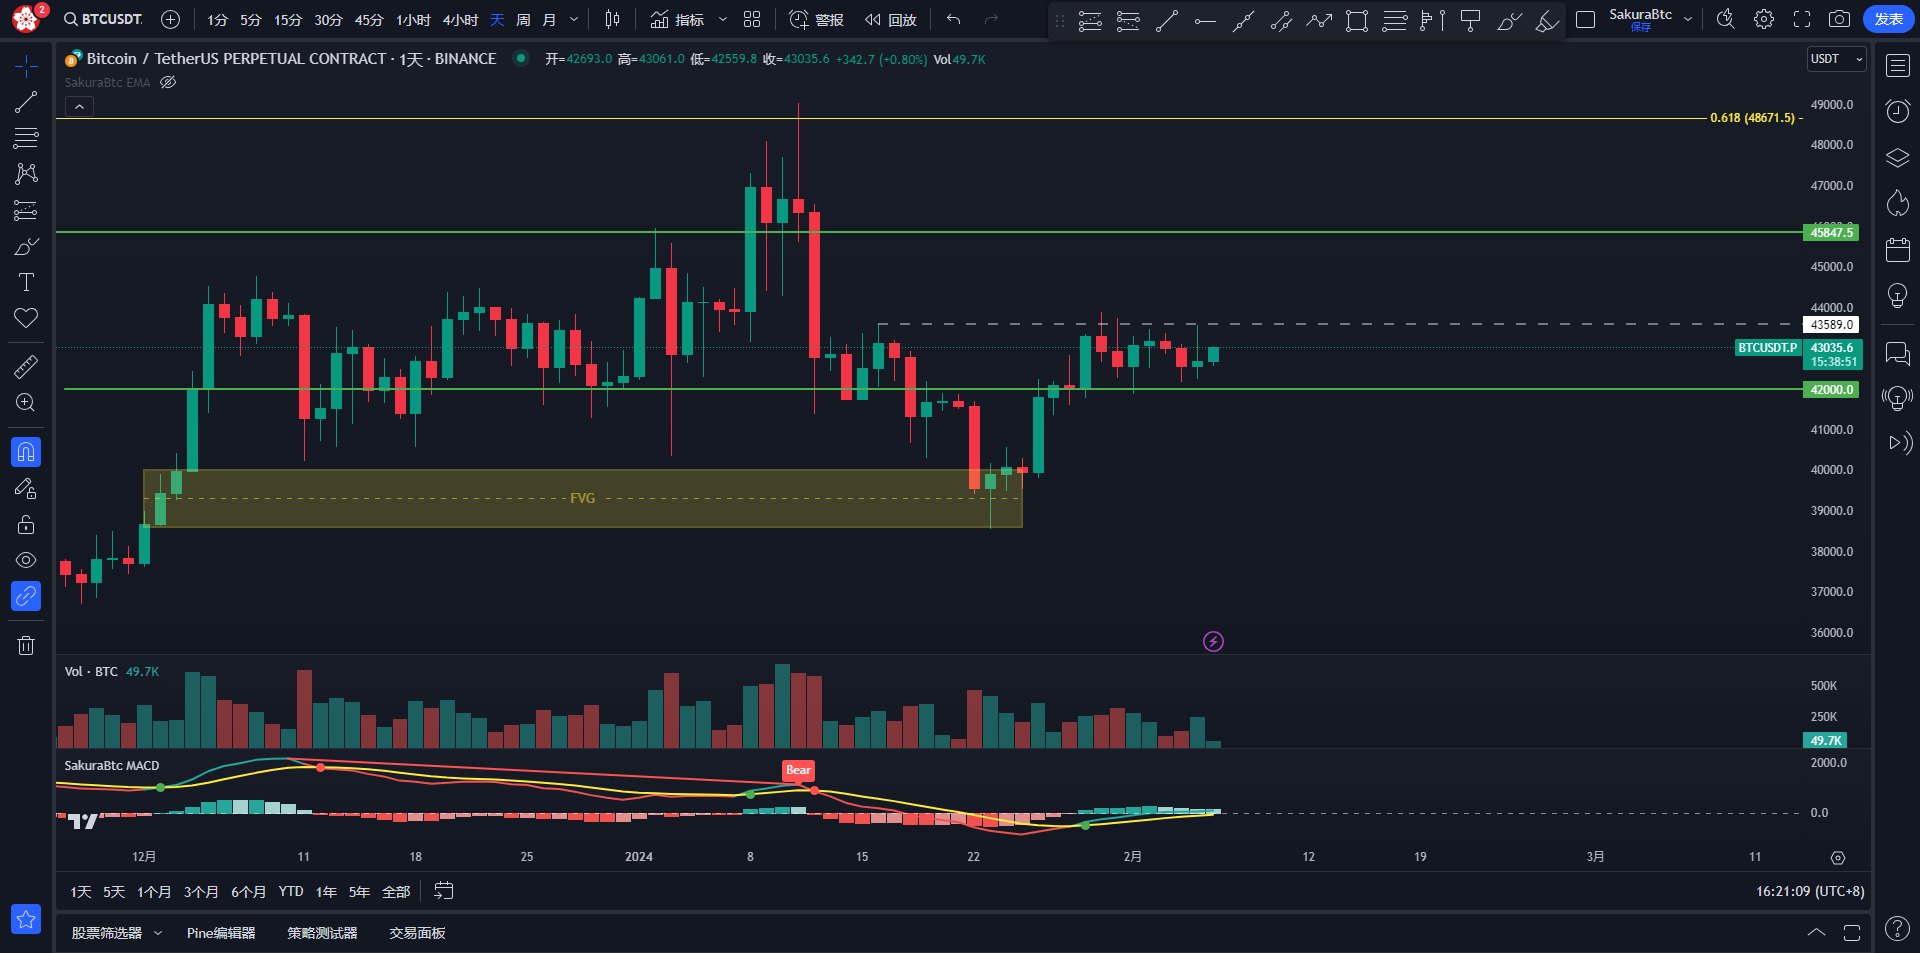
BTC Daily Chart:

From the daily chart, yesterday closed with a long upper shadow candlestick, and the market once again reached a resistance at a previous high point. This creates a parallel top, and I believe that this level is very attractive. The market is unlikely to drop directly from this position, which was the starting point of the previous small bull market. Additionally, the market has not broken through the VAL line of the previous consolidation range I mentioned yesterday, so there is no obvious sign of a weakening trend. We need to pay attention to the support at this level, and if it is broken, we need to focus on the volume distribution at the VAH line from the previous market. If the market is supported at this level and rises again, it is a very good opportunity to go long.
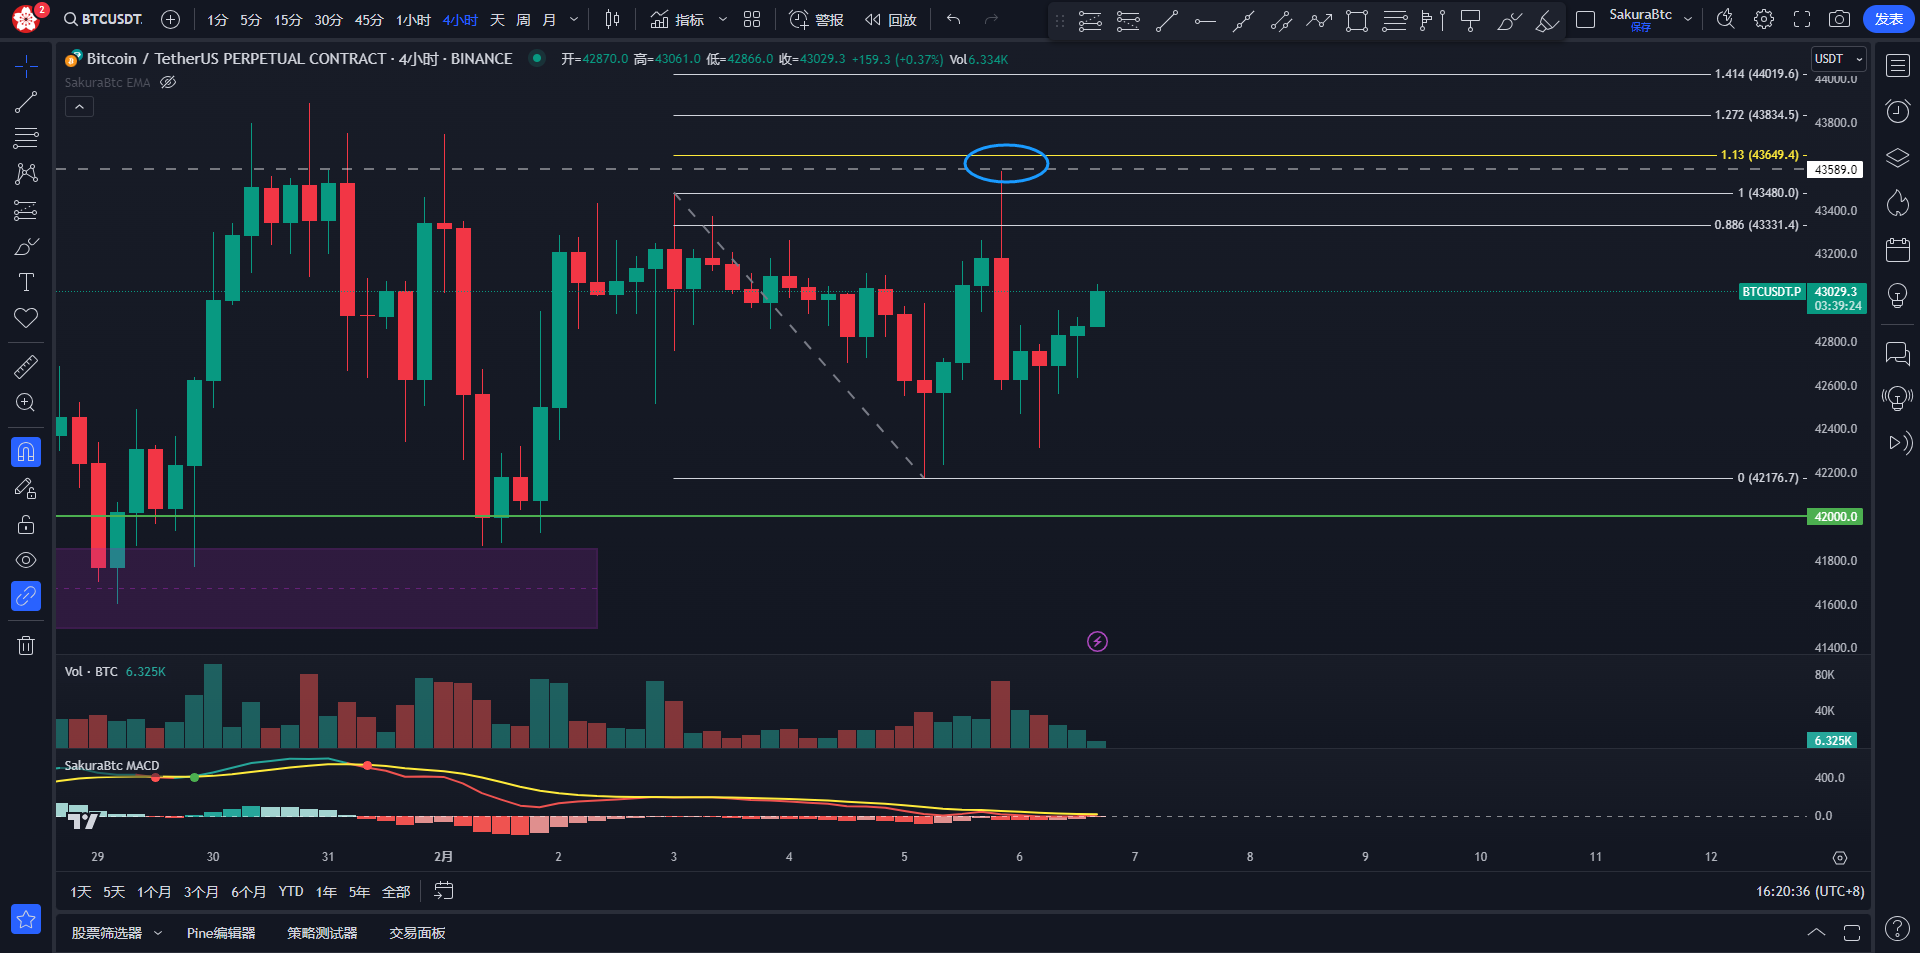
BTC 4-hour Chart:

From the 4-hour chart, as I mentioned yesterday, the long and short forces in the market are very balanced here. The market then made a false breakthrough at this high point, failed to reach the 1.13 position, and then rose again. I believe this level is very attractive. If you entered a long position at these levels yesterday, I think you can continue to hold, with a stop loss at 42000 and the first take profit target at the 1.13 position. If this level is held, we can look for the 1.618 position.
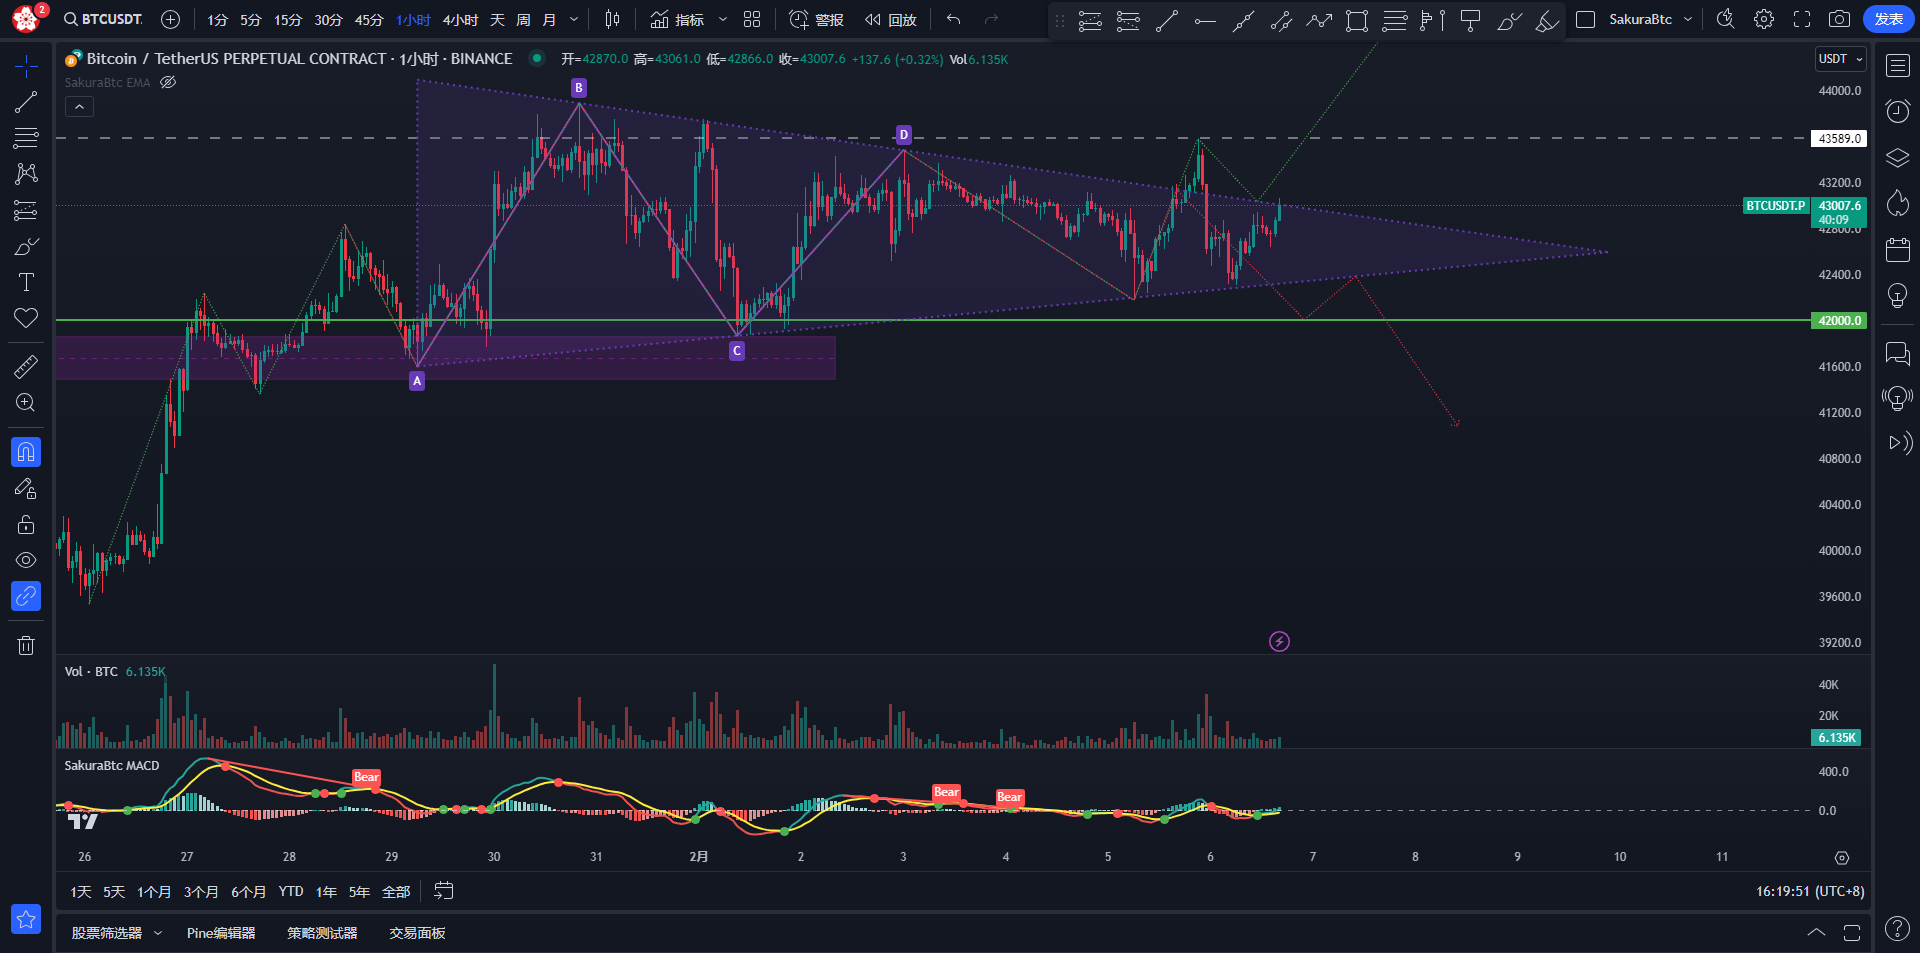
BTC 1-hour Chart:

From the 1-hour chart, there is a converging triangle pattern, which is a neutral bias towards an upward trend. Last night, the market made a false breakthrough of the upper rail of this converging triangle. If the previous market develops from here, this triangle is a continuation pattern of a downtrend, and the market will come to a low point, around 41000. If the previous market develops from here, this triangle is a continuation pattern of an uptrend, and the market will come to a high point, around 45600. We need to focus on whether the market breaks upward or downward.
In summary, today's market, we need to pay close attention to the converging triangle pattern on the 1-hour chart and observe whether the market breaks upward or downward, in order to make corresponding decisions.
If there is anything about today's market that needs to be discussed, feel free to communicate. Thank you.

Risk Warning: This platform promises to provide professional information services. The content of this platform is for reference only and does not constitute any investment decision advice. At the same time, this platform does not promise investors to obtain profits, nor does it agree to share investment profits or bear investment losses with investors. The market is risky, and investment needs to be cautious.
免责声明:本文章仅代表作者个人观点,不代表本平台的立场和观点。本文章仅供信息分享,不构成对任何人的任何投资建议。用户与作者之间的任何争议,与本平台无关。如网页中刊载的文章或图片涉及侵权,请提供相关的权利证明和身份证明发送邮件到support@aicoin.com,本平台相关工作人员将会进行核查。


