Watch the video: Bitcoin market analysis 2024.02.02
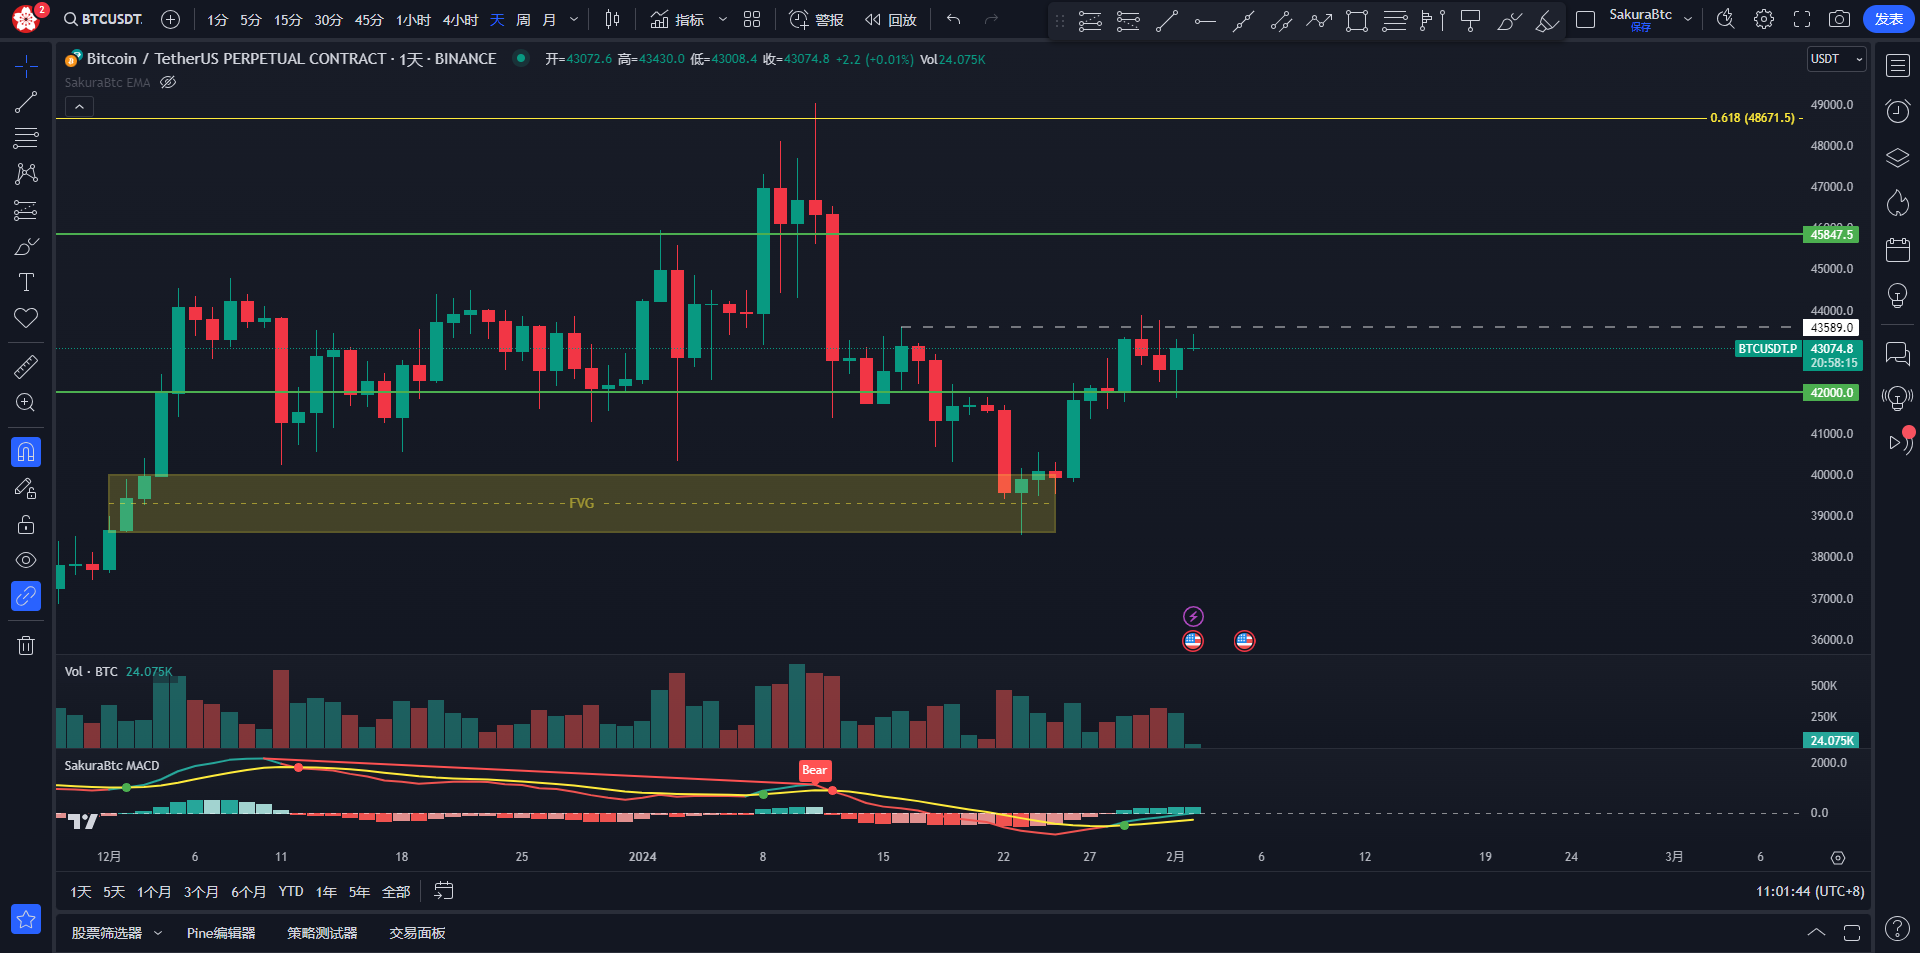
BTC Daily Chart:

From the daily chart, yesterday closed with a bullish candlestick. The market fell below the low of the day before yesterday, then quickly filled the gap left by the previous rapid rise in the candlestick, and rose again after obtaining liquidity. Therefore, the previous day's decline was a bear trap. If you did not take profit in time, it was easy to get trapped. From the daily chart, there is no sign of a weakening trend, and it is still an upward trend. For the long positions we entered at these levels earlier, I mentioned that the first take-profit point is this line. The market broke this line twice before but did not hold, so I believe that the resistance of this line is not very strong, and it is very likely that the market will hold this line. Our next take-profit point is at the distribution of trading volume in the area ahead, at the position of the VAL line, which is roughly around 44800. We need to pay close attention to the price behavior at this line. When the market reaches this line, we can take profit on a portion of the position again. At the same time, if the market shows a false breakthrough and a rapid decline, we can also enter a short position to balance the remaining long position's profit.
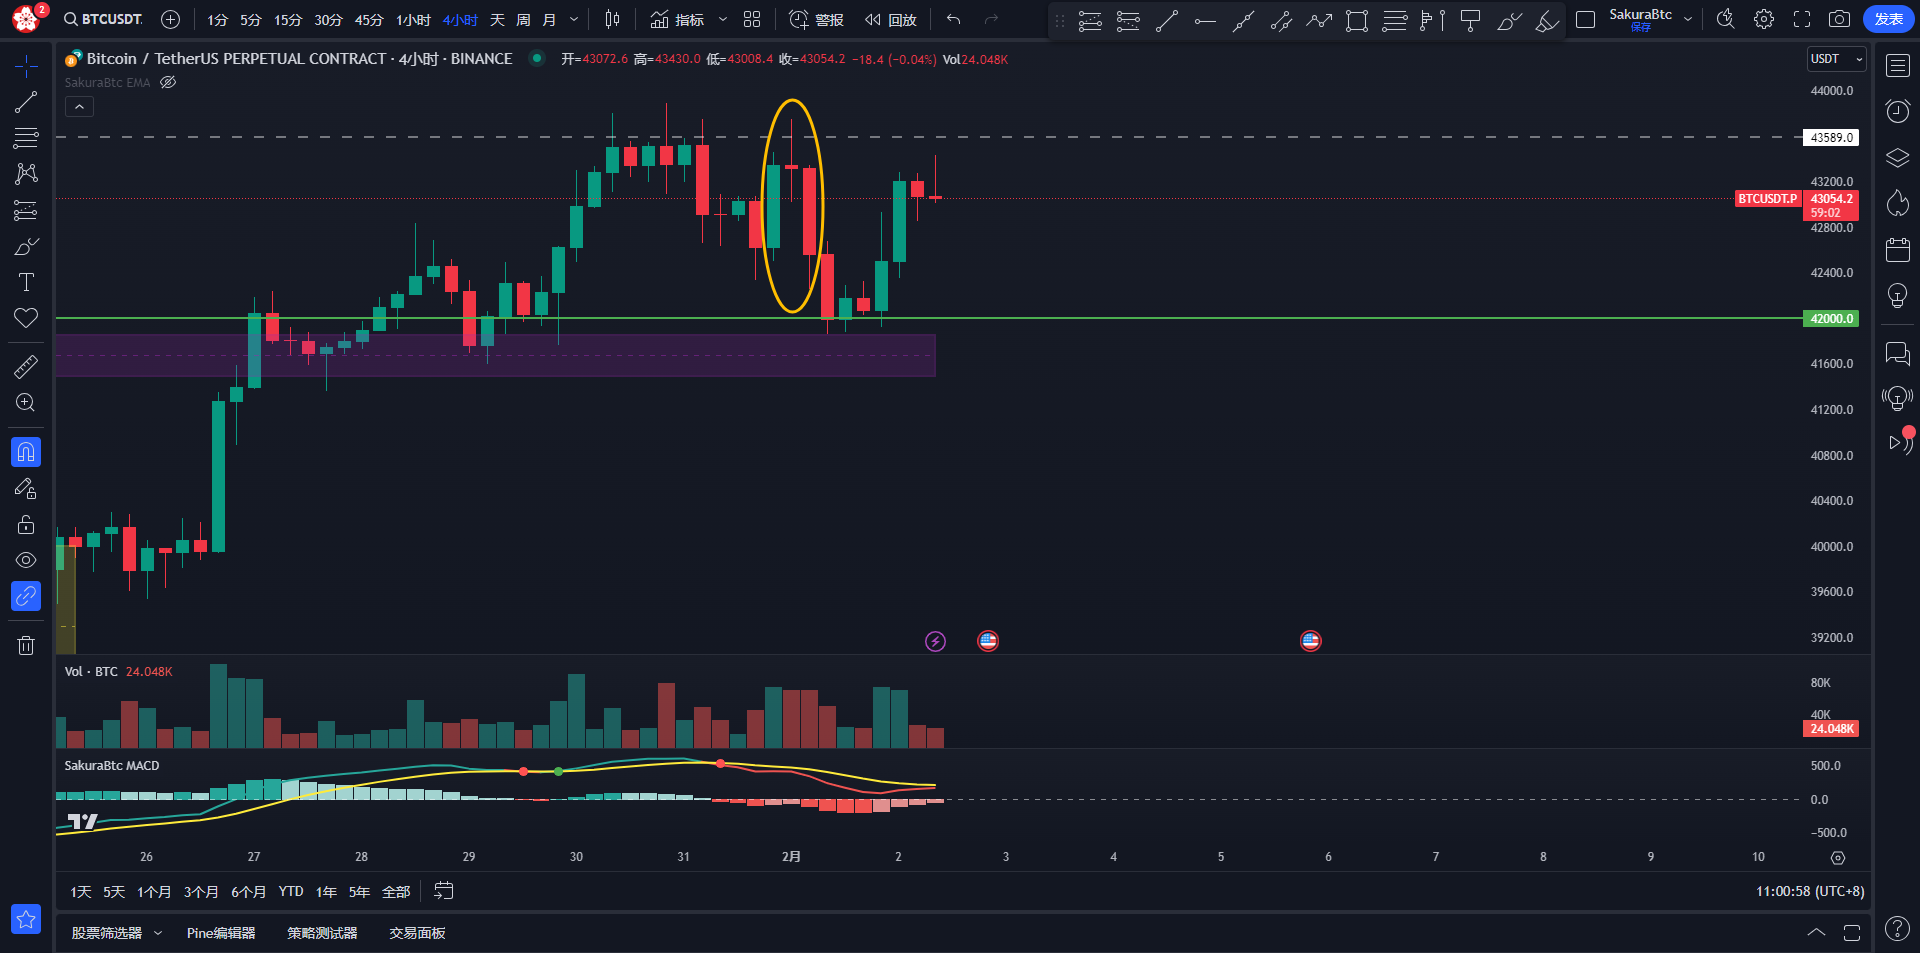
BTC 4h Chart:

From the 4-hour chart, the market showed a bearish evening star pattern yesterday, but at this high point, it did not break through the previous high points, instead forming a parallel top, so this evening star is very likely a bear trap. Therefore, do not chase short positions at this point. As expected, the market later falsely fell below the 42000 line and then rose again.
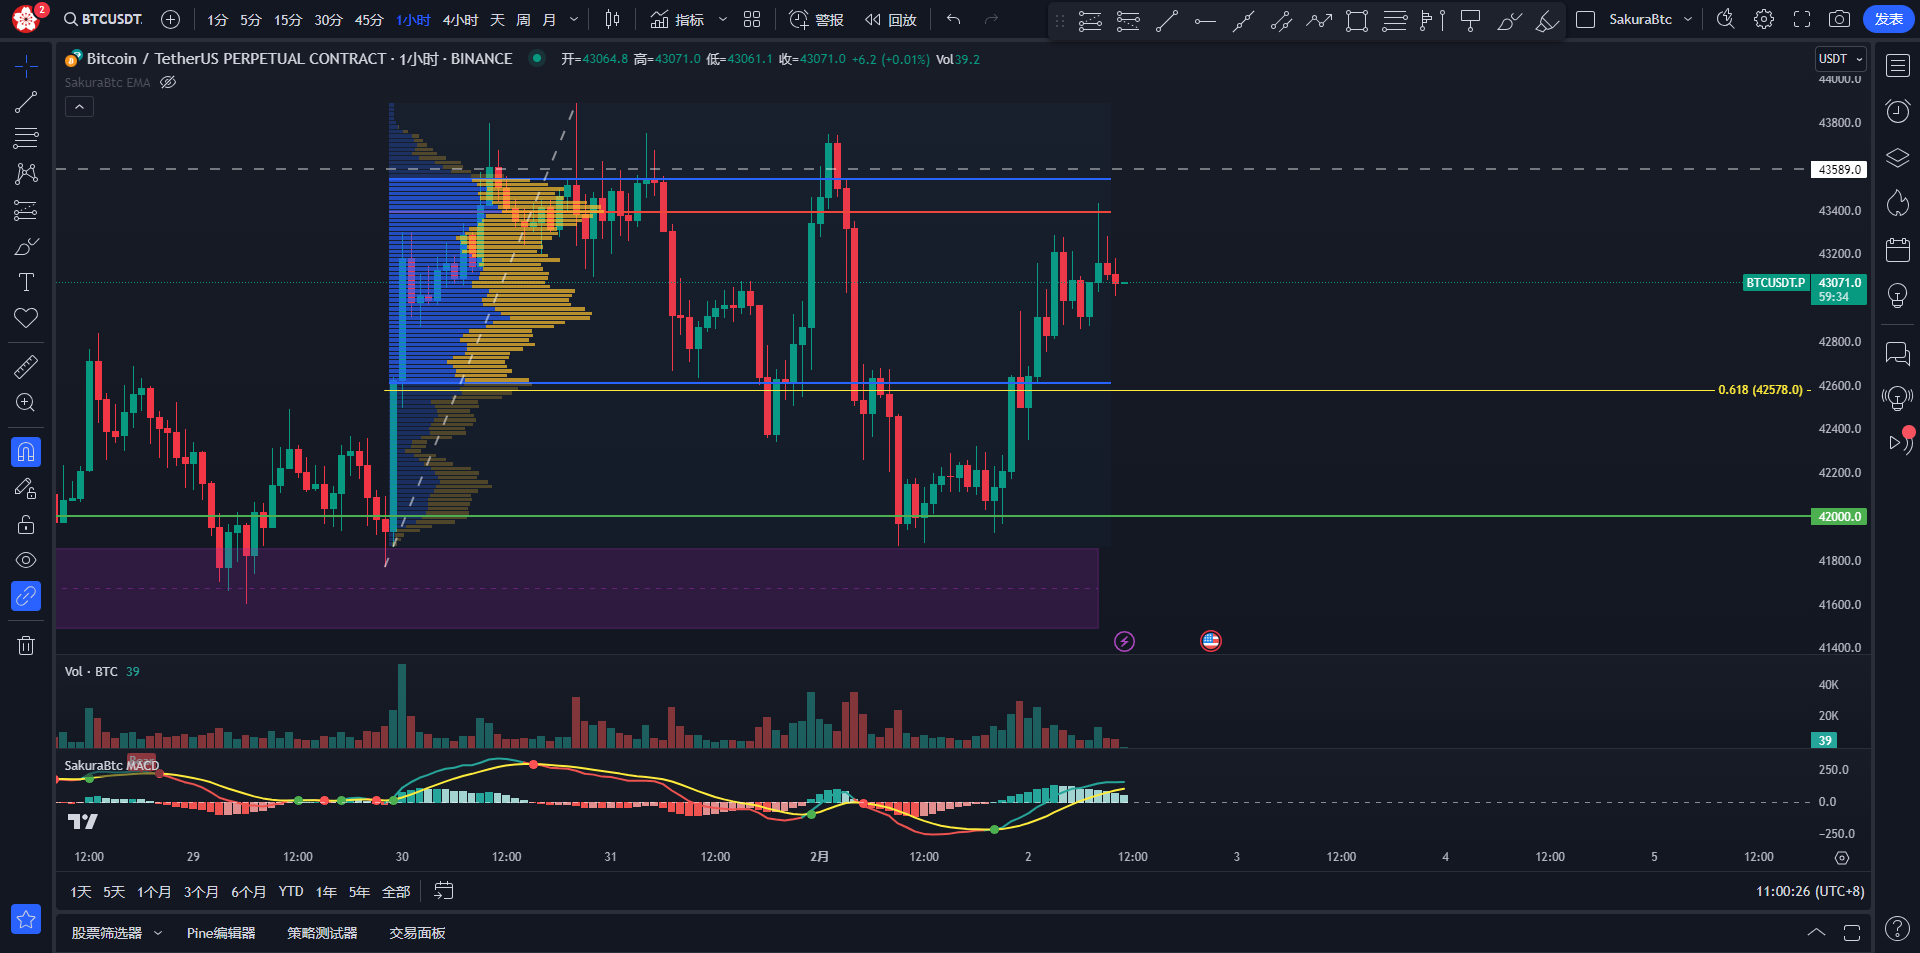
BTC 1h Chart:

From the 1-hour chart, the market is currently being resisted at the POC line, but I believe that the resistance at this line is not very strong. When the market successfully holds the POC line, the resistance at the previous high point is also not strong. Our focus still needs to be on the price behavior at the 44800 line above the market.
In summary, for today's market, it is important to pay attention to the breakthrough at 43888. If the market holds this line, the next take-profit point will be at 44800.
Feel free to discuss any aspects of today's market. Thank you.

Risk Warning: This platform promises to provide professional information services. The content of this platform is for reference only and does not constitute any investment advice. At the same time, this platform does not promise investors to obtain profits, nor does it agree to share investment profits or bear investment losses with investors. The market is risky, and investment needs to be cautious.
免责声明:本文章仅代表作者个人观点,不代表本平台的立场和观点。本文章仅供信息分享,不构成对任何人的任何投资建议。用户与作者之间的任何争议,与本平台无关。如网页中刊载的文章或图片涉及侵权,请提供相关的权利证明和身份证明发送邮件到support@aicoin.com,本平台相关工作人员将会进行核查。


