On the evening of January 30th, AICoin researchers conducted a live graphic and textual sharing of the "EMA Automated Real Trading (with Membership)" in the AICoin PC End-Group Chat-Live. The following is a summary of the live content.
I. Introduction to EMA Strategy
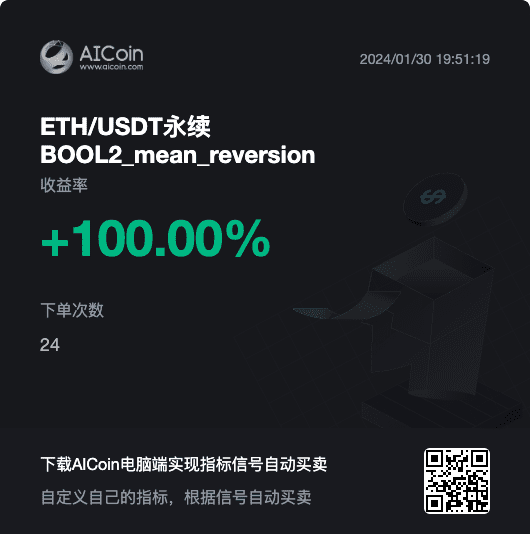
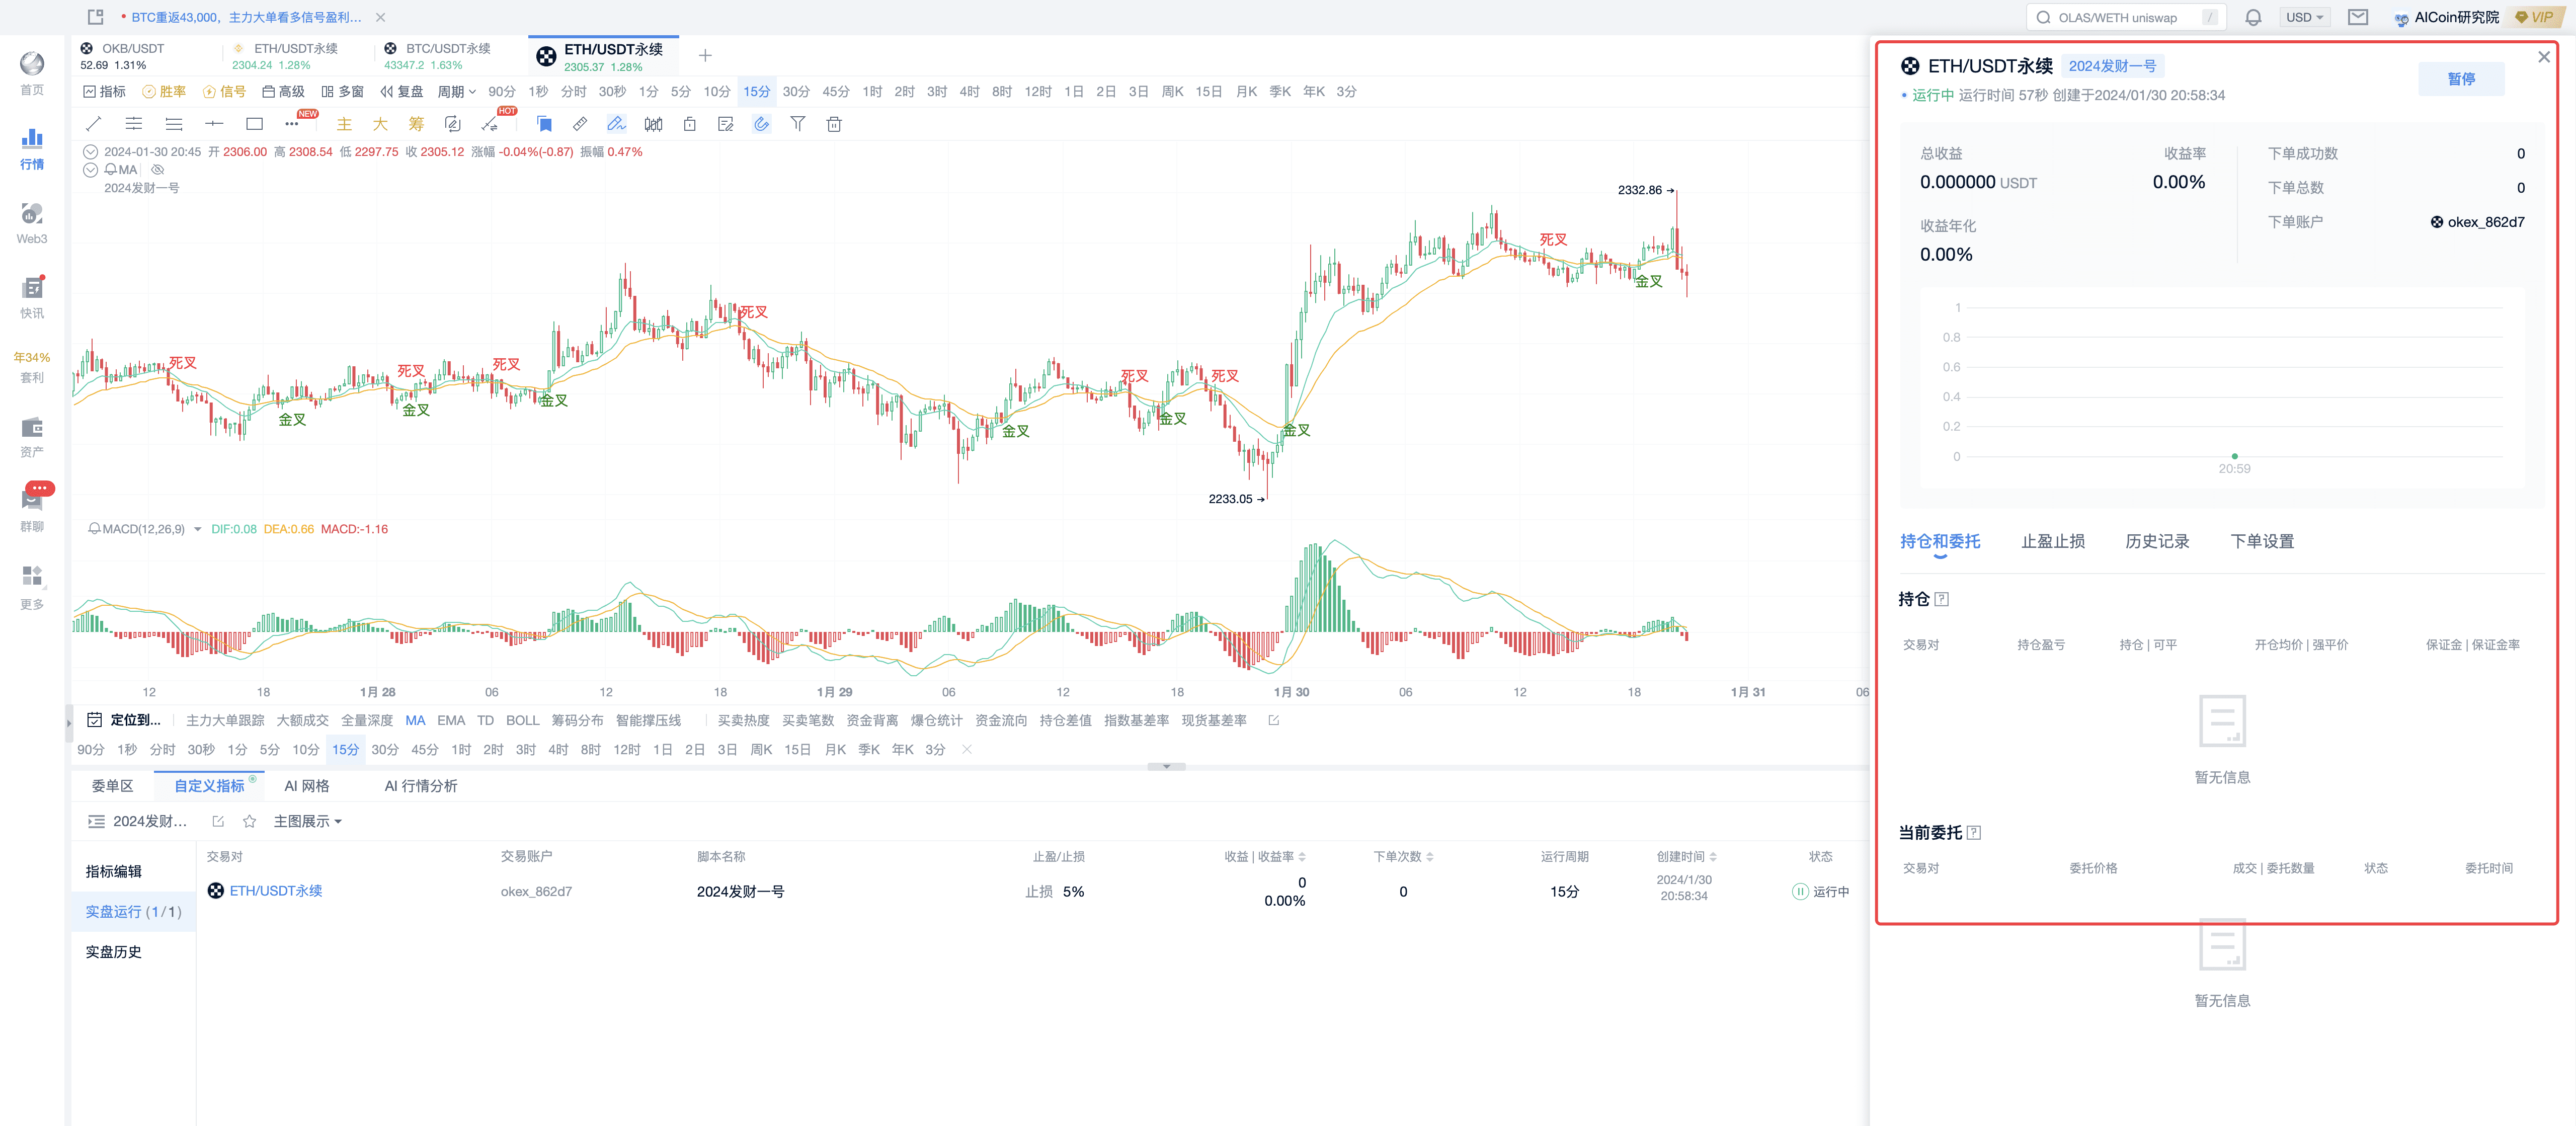
1. Running Script Strategy Profit Situation
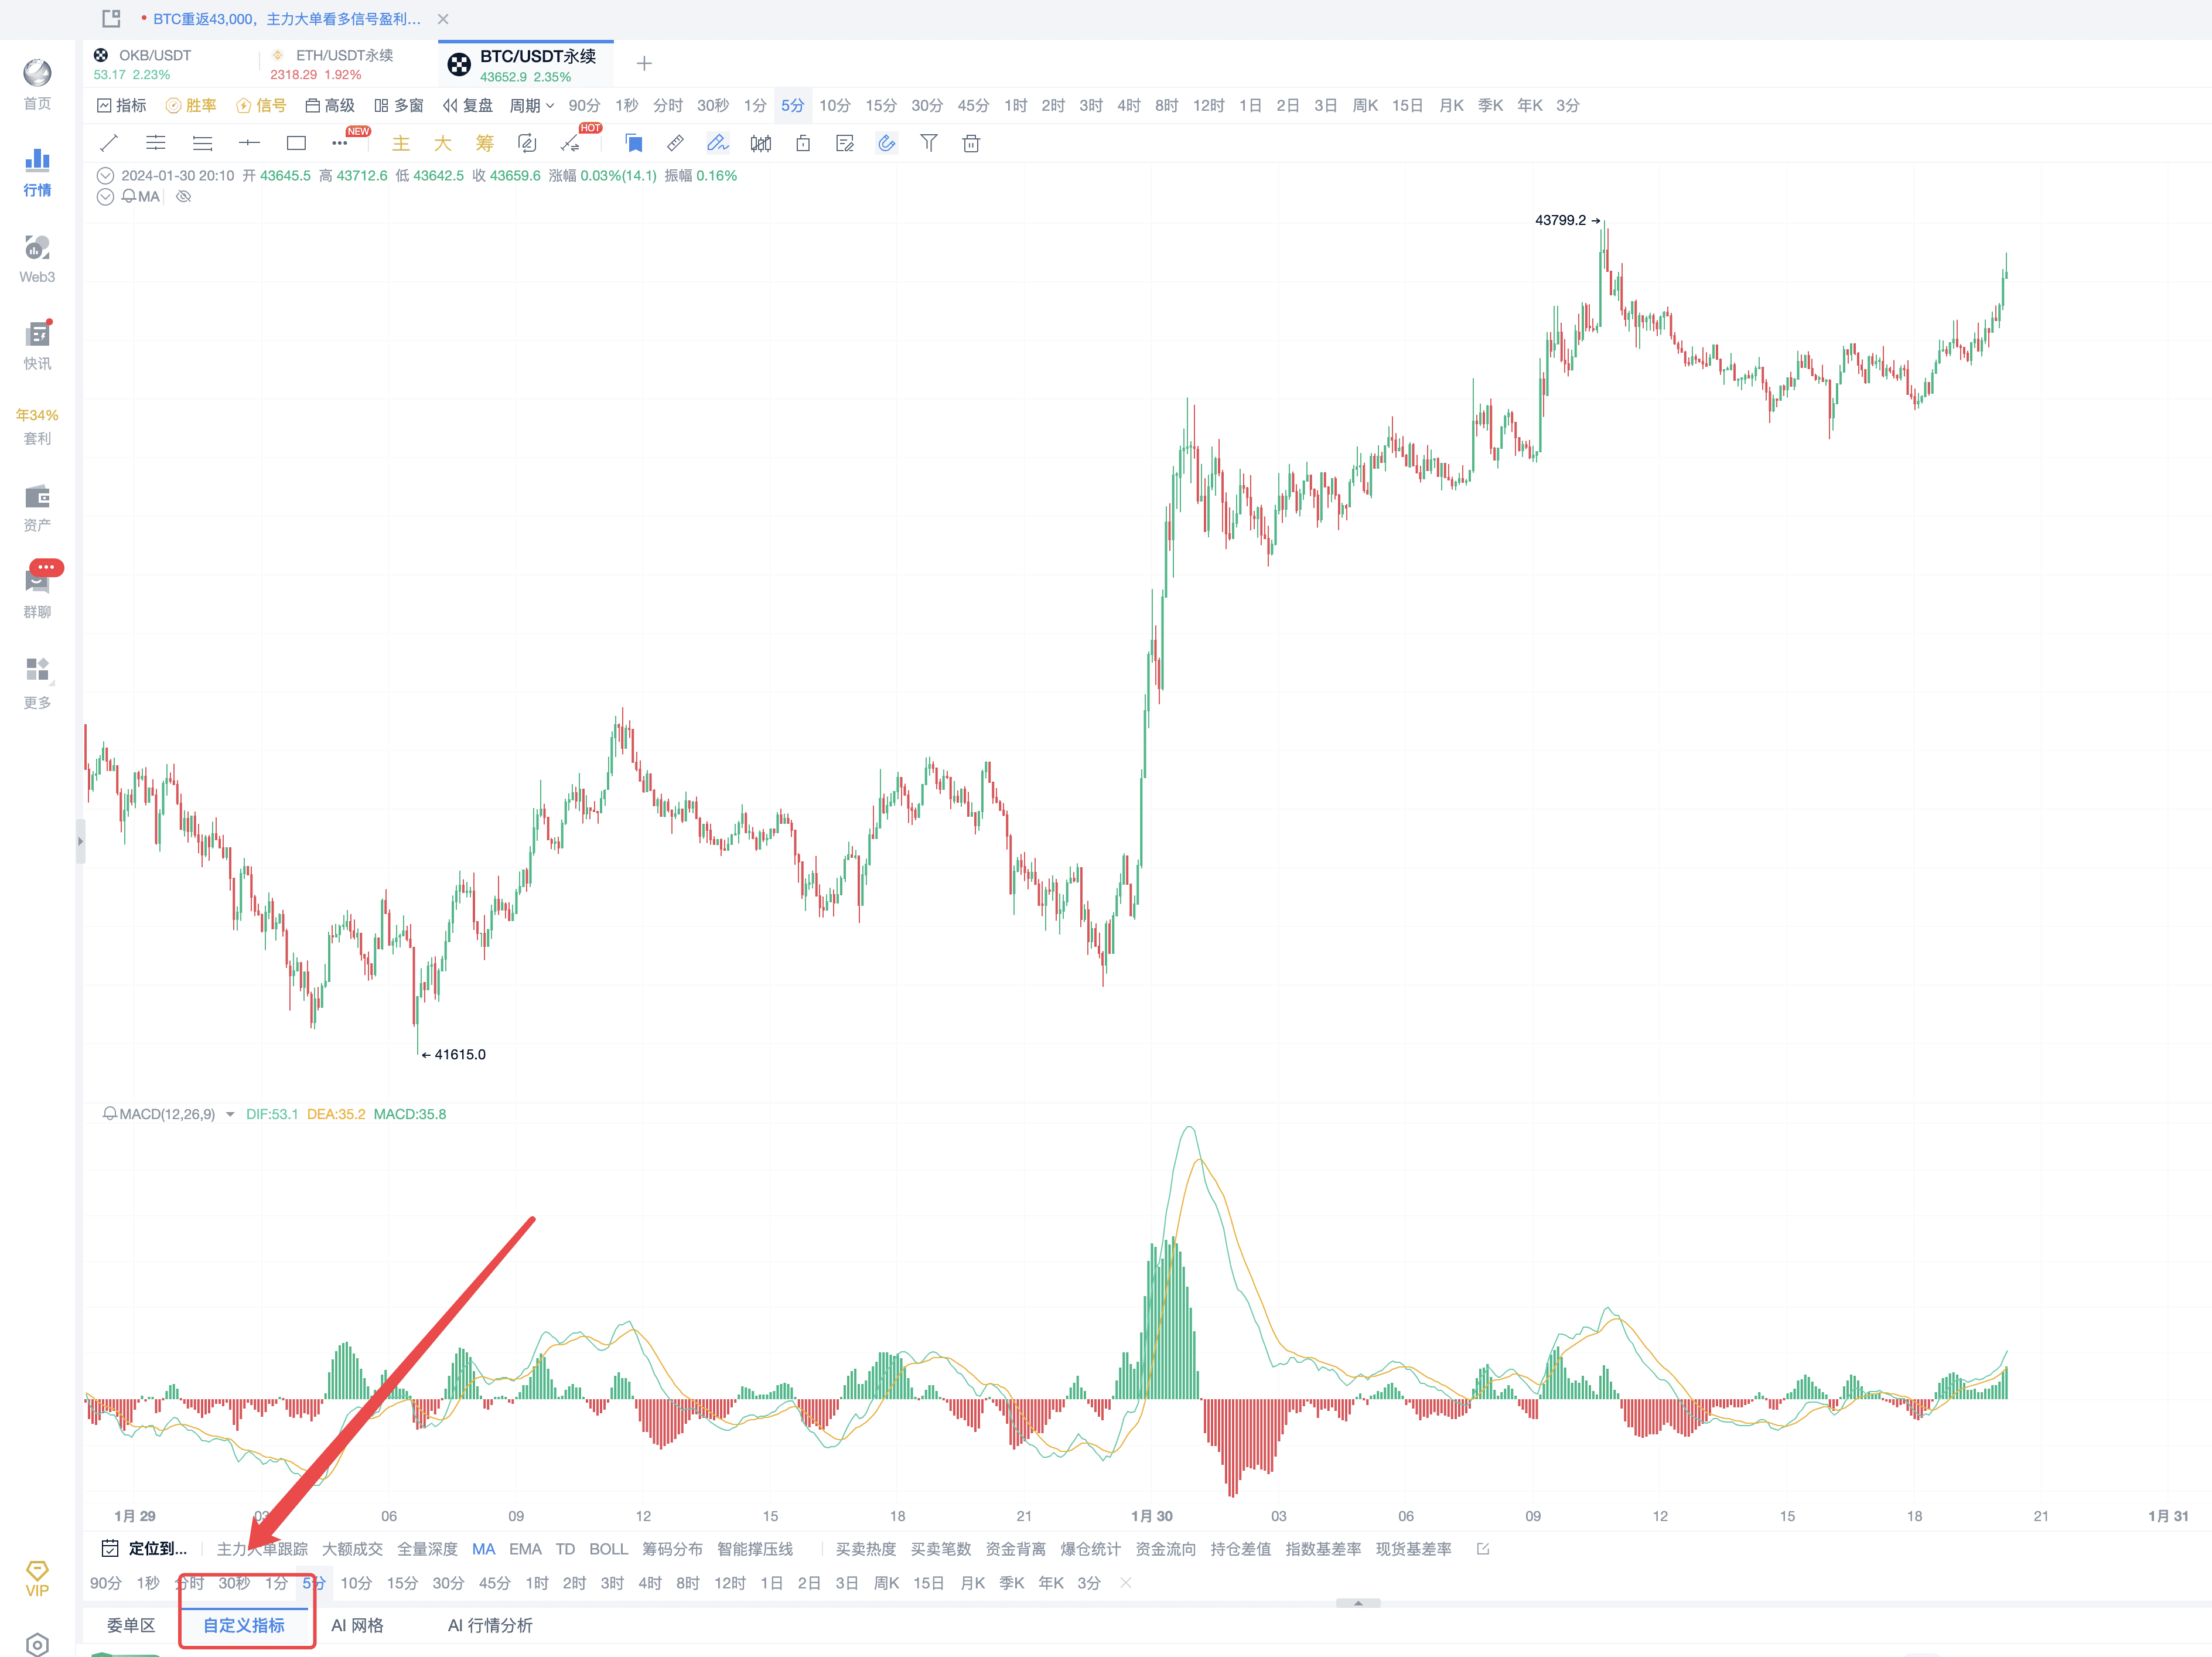
2. Understanding EMA Strategy
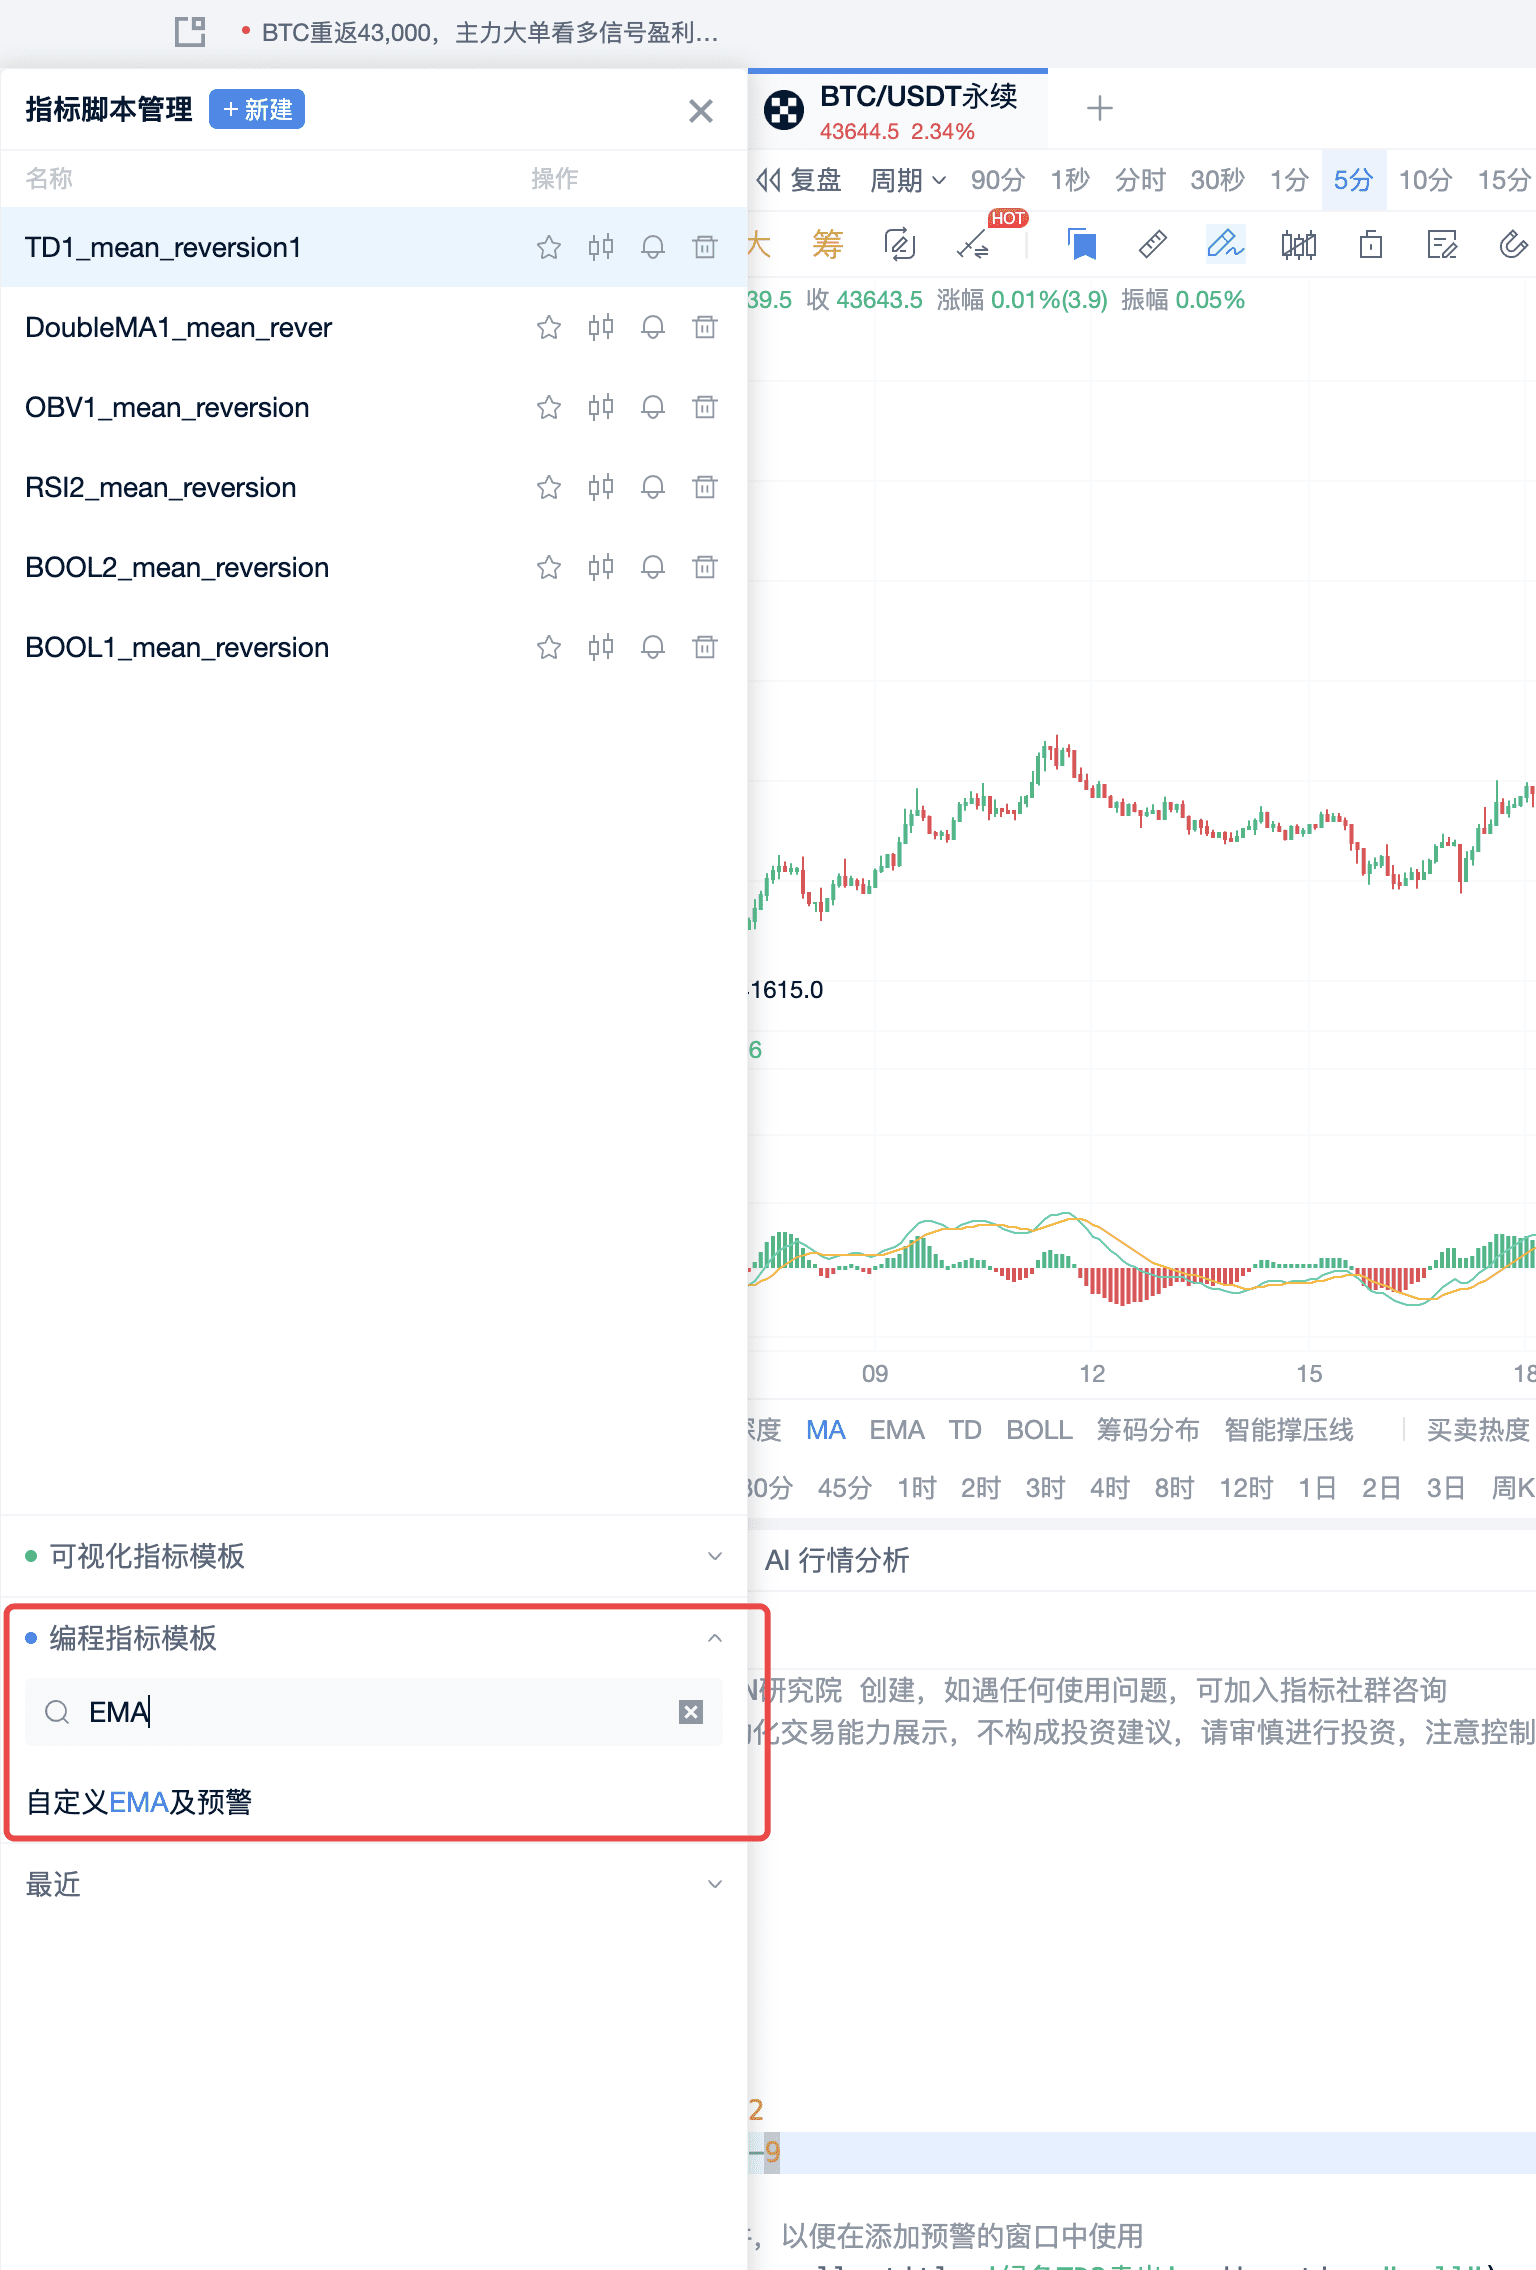
Step 1: Open custom indicators as shown in the figure
Step 2: Click to select as shown in the figure
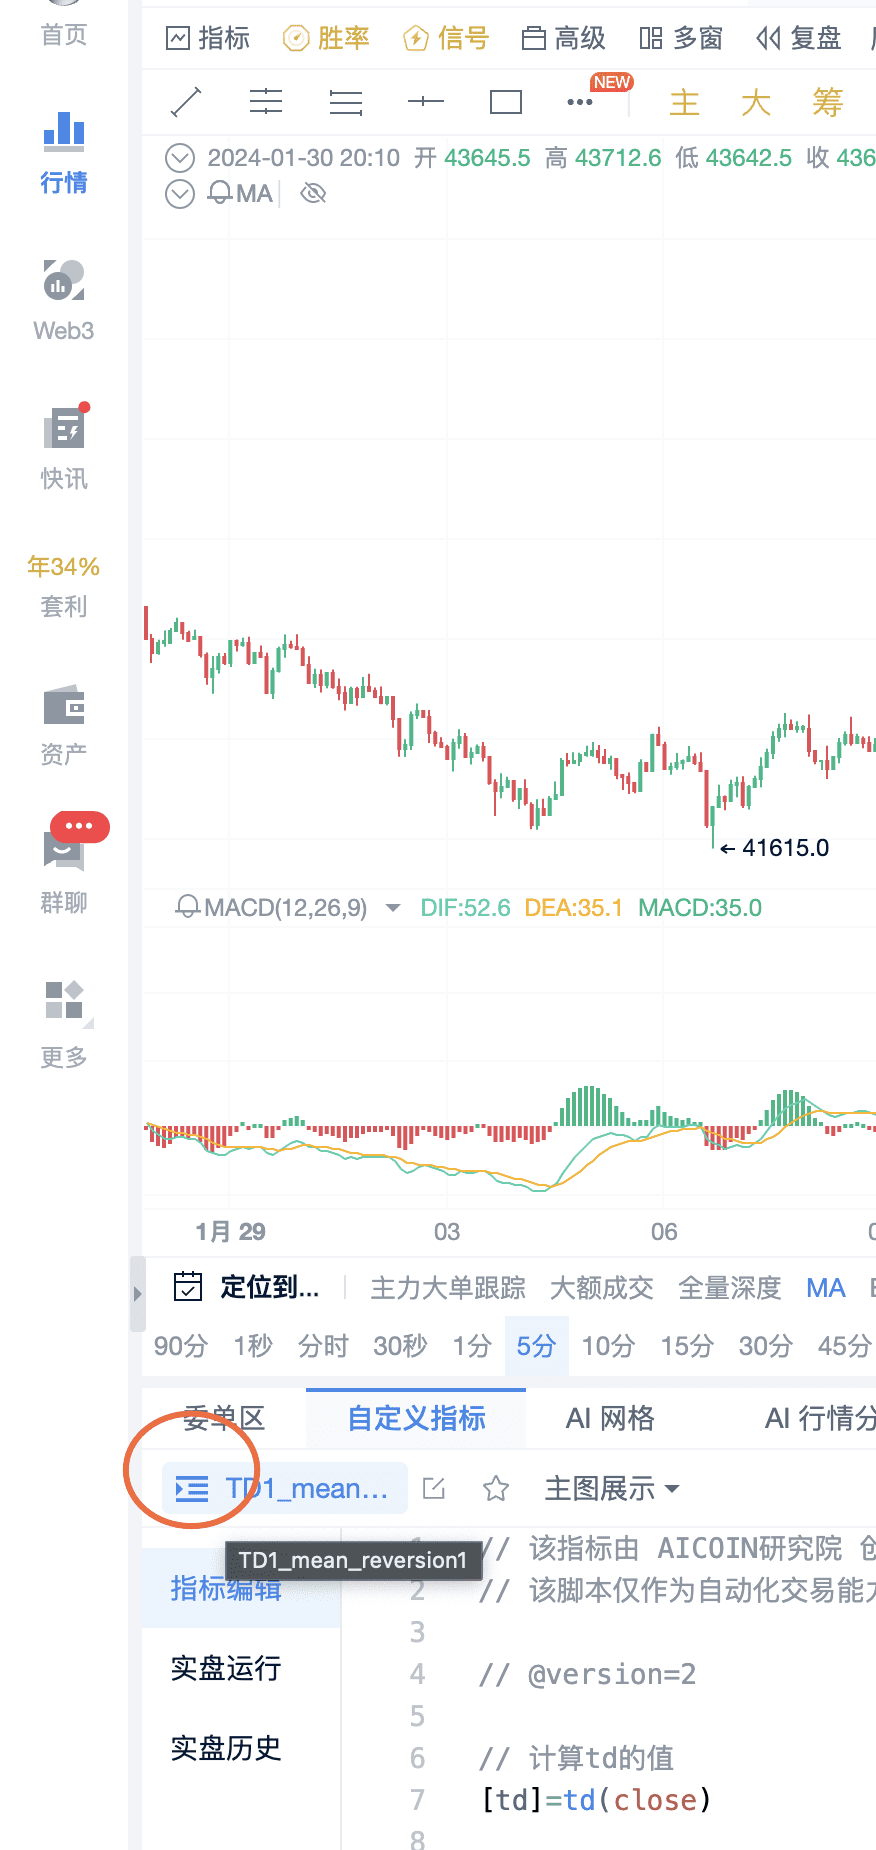
Step 3: Search and view EMA indicators as shown in the figure
II. EMA Strategy
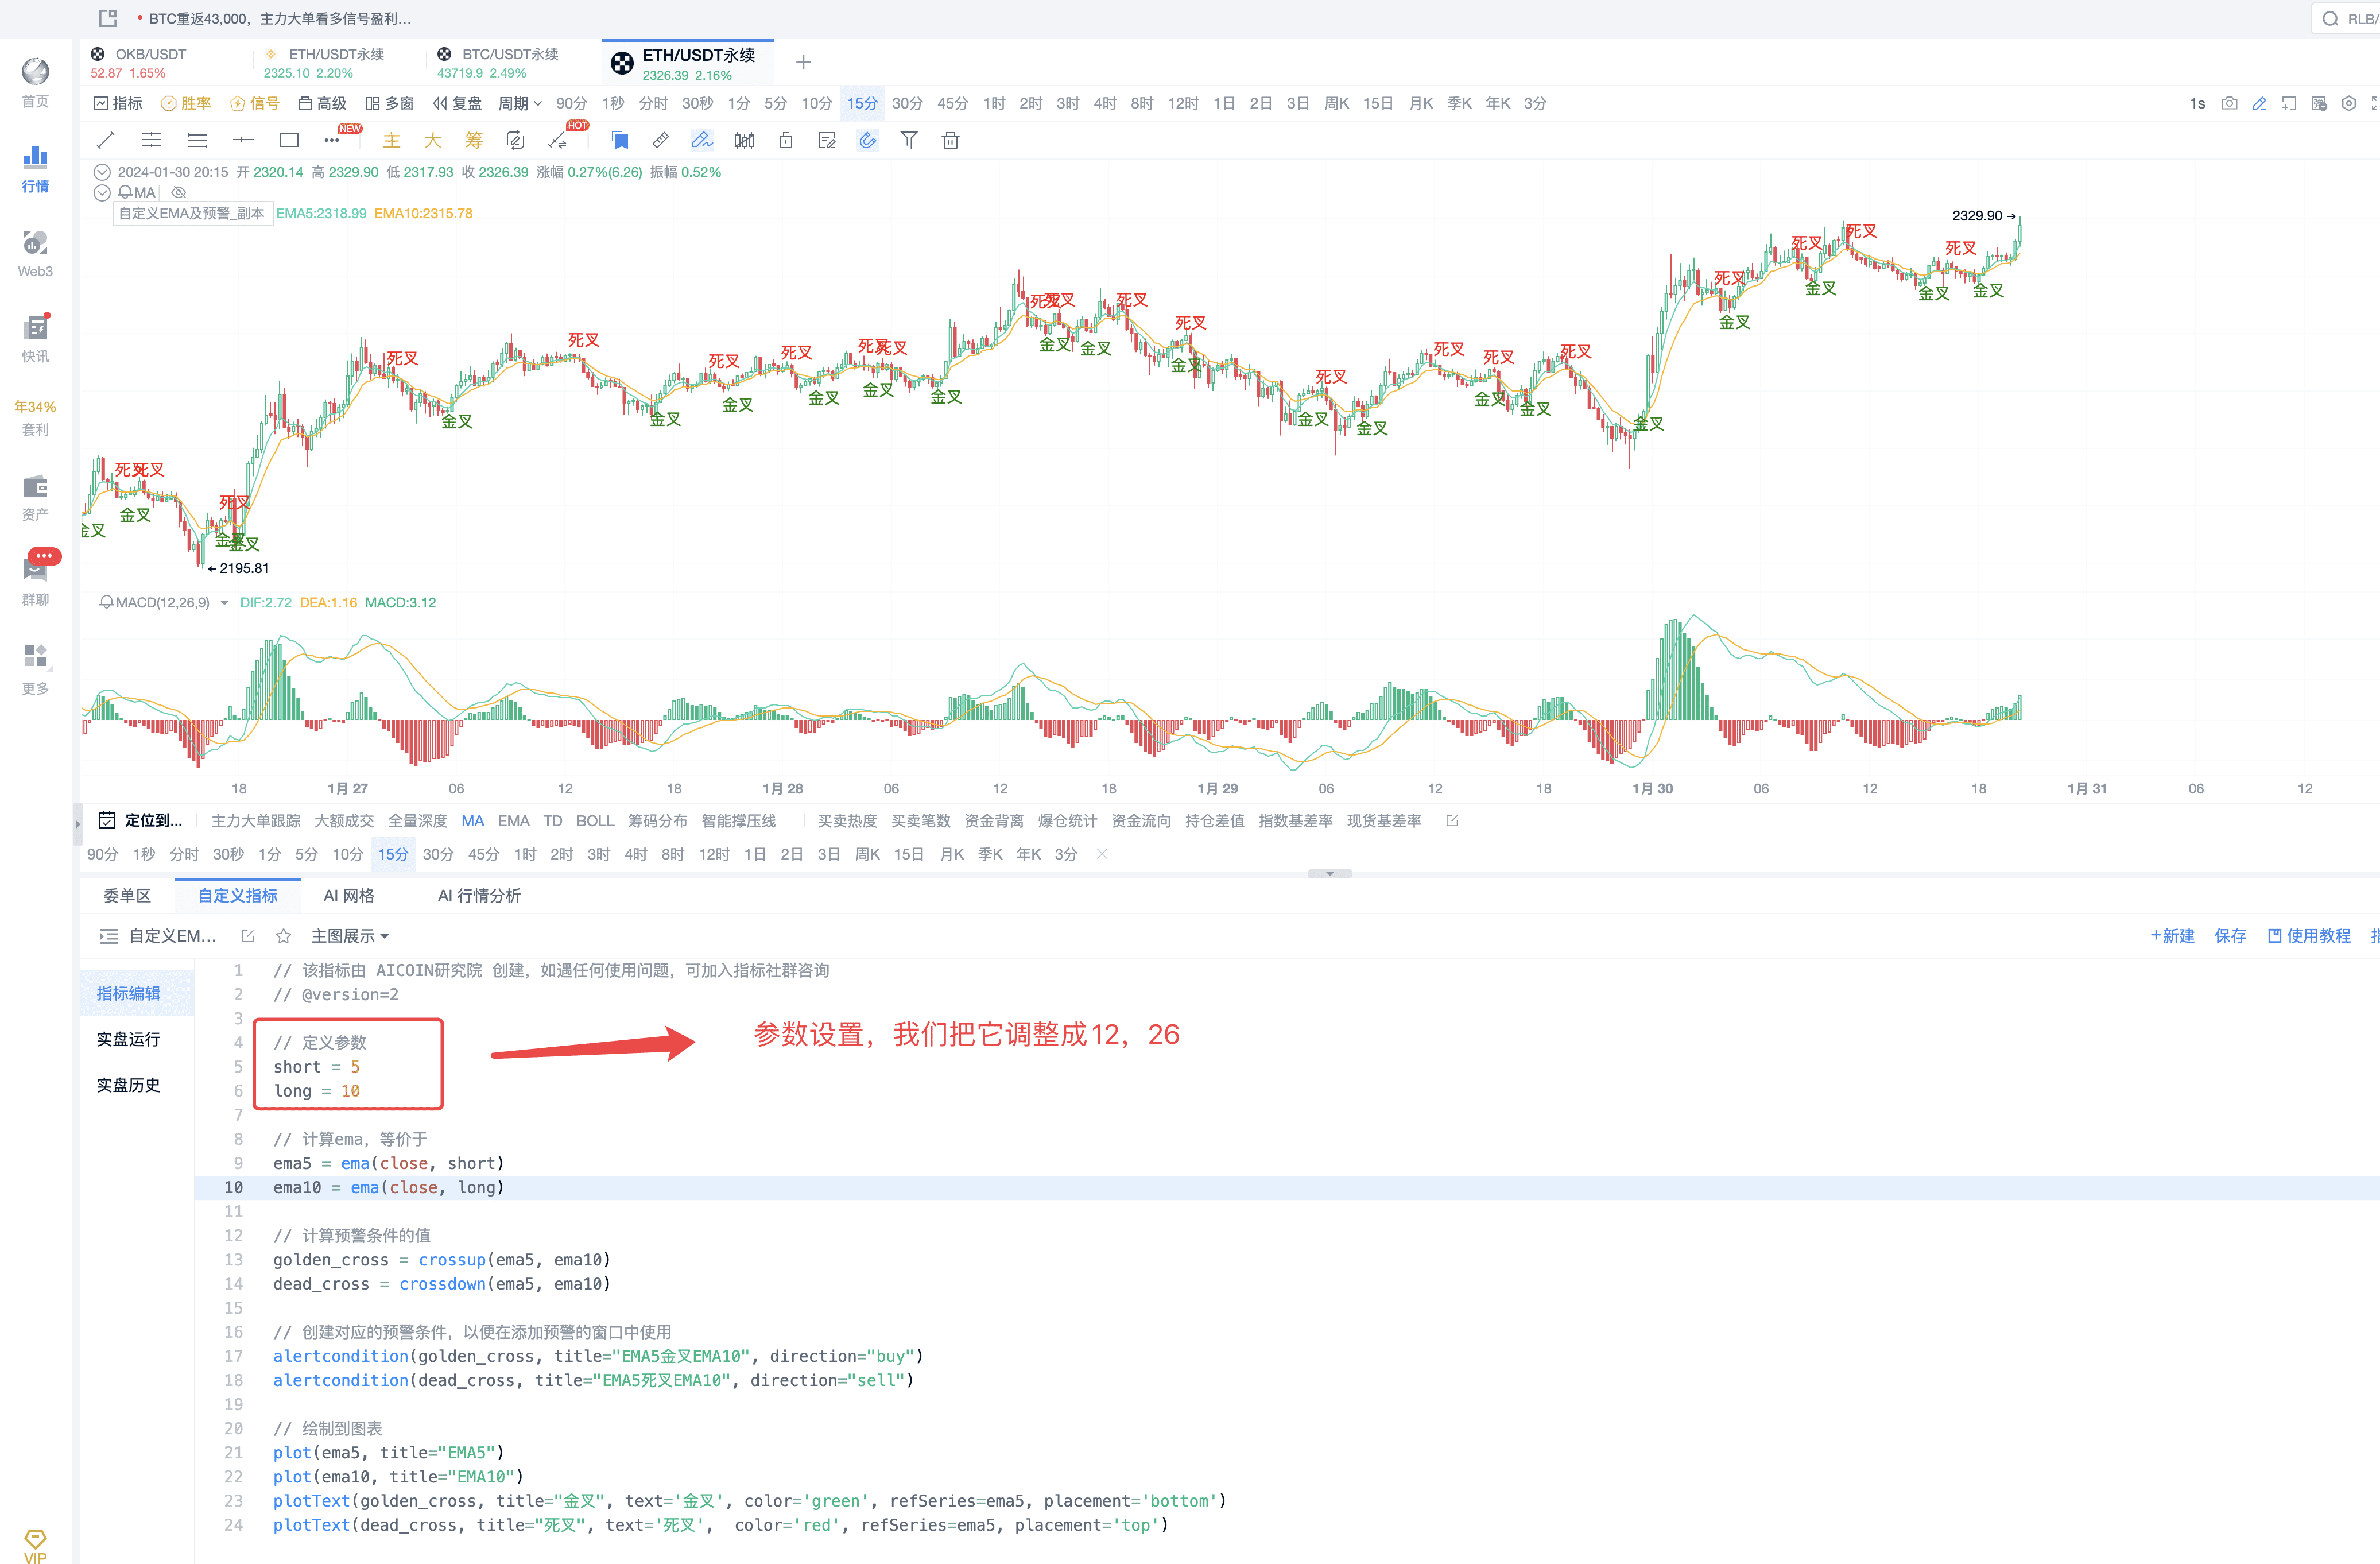
EMA parameters: 12, 26.
Operation method: When the golden cross occurs, the trend is bullish, suitable for long positions; when the death cross occurs, the trend is bearish, suitable for short positions.
III. Running EMA Strategy
Step 1: Change Parameters
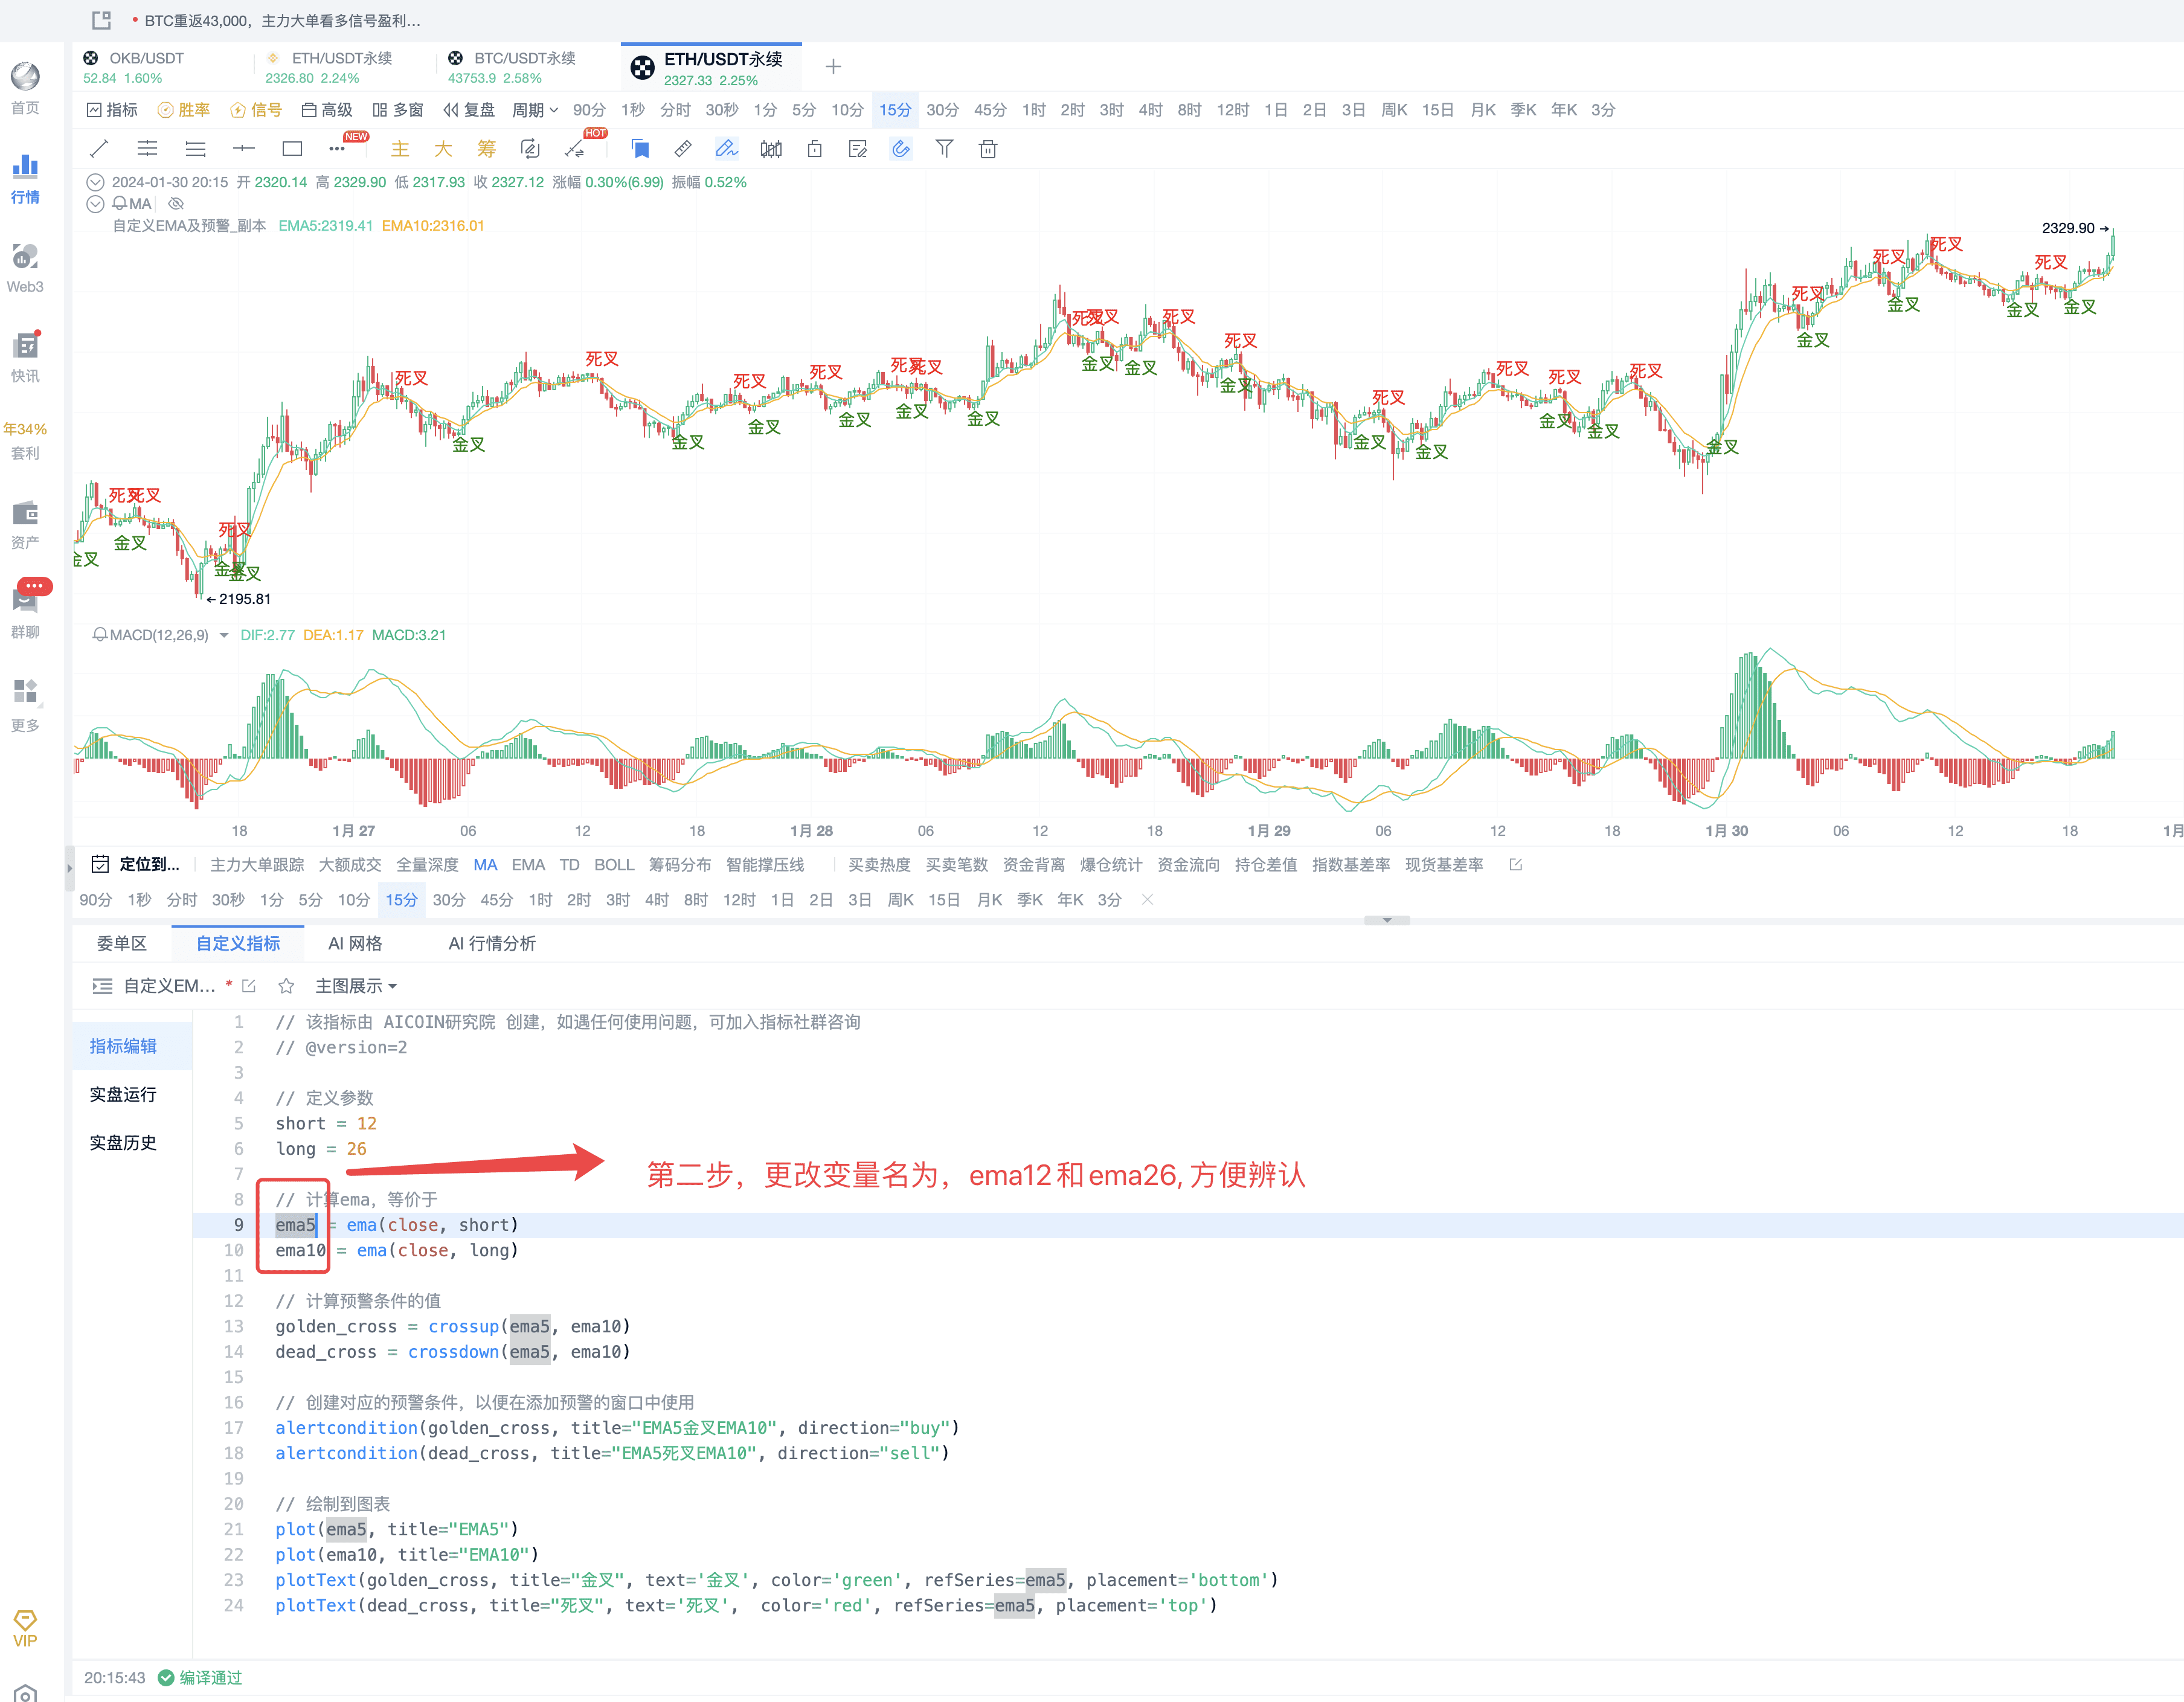
Step 2: Adjust Variable Names
Additional: Our research institute will also be a regular member of the PRO group in the future; PRO members can communicate more with our research institute. With more market hotspots, there are many opportunities to make money. Let's exchange and collide together! Explore every opportunity to make money in digital currency! Click the link below to open the PRO group automatically: https://www.aicoin.com/zh-CN/vip
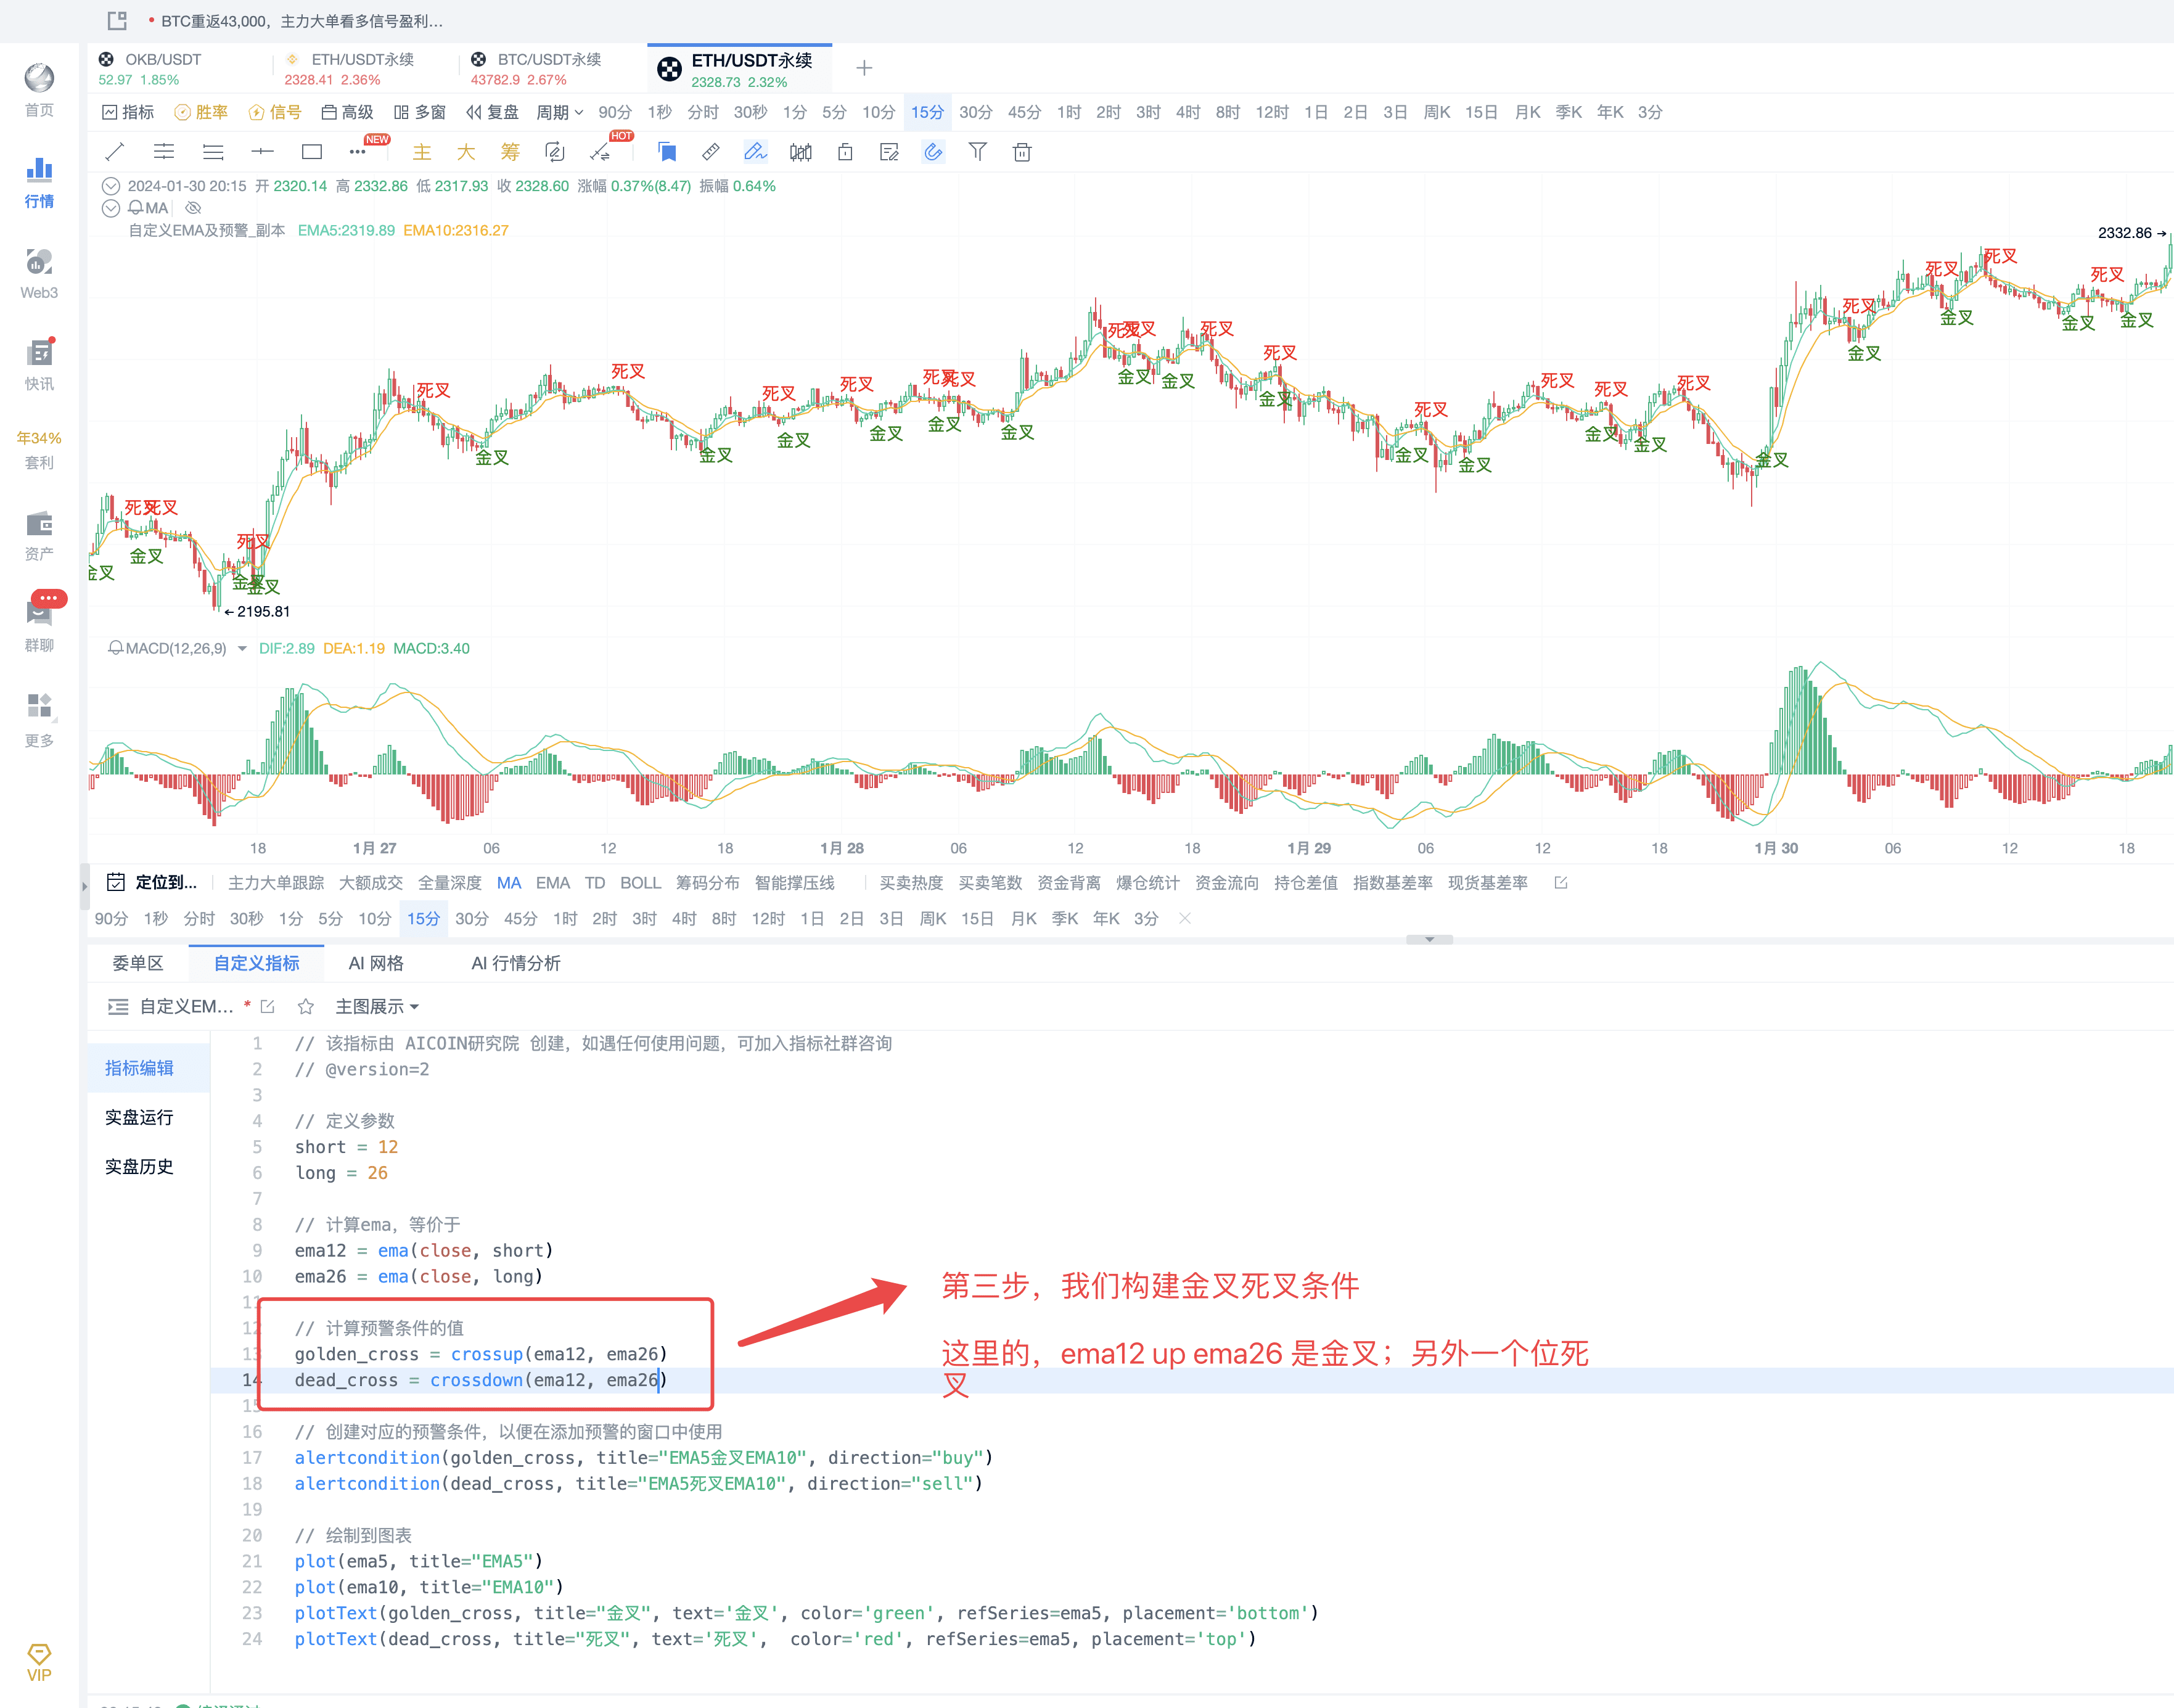
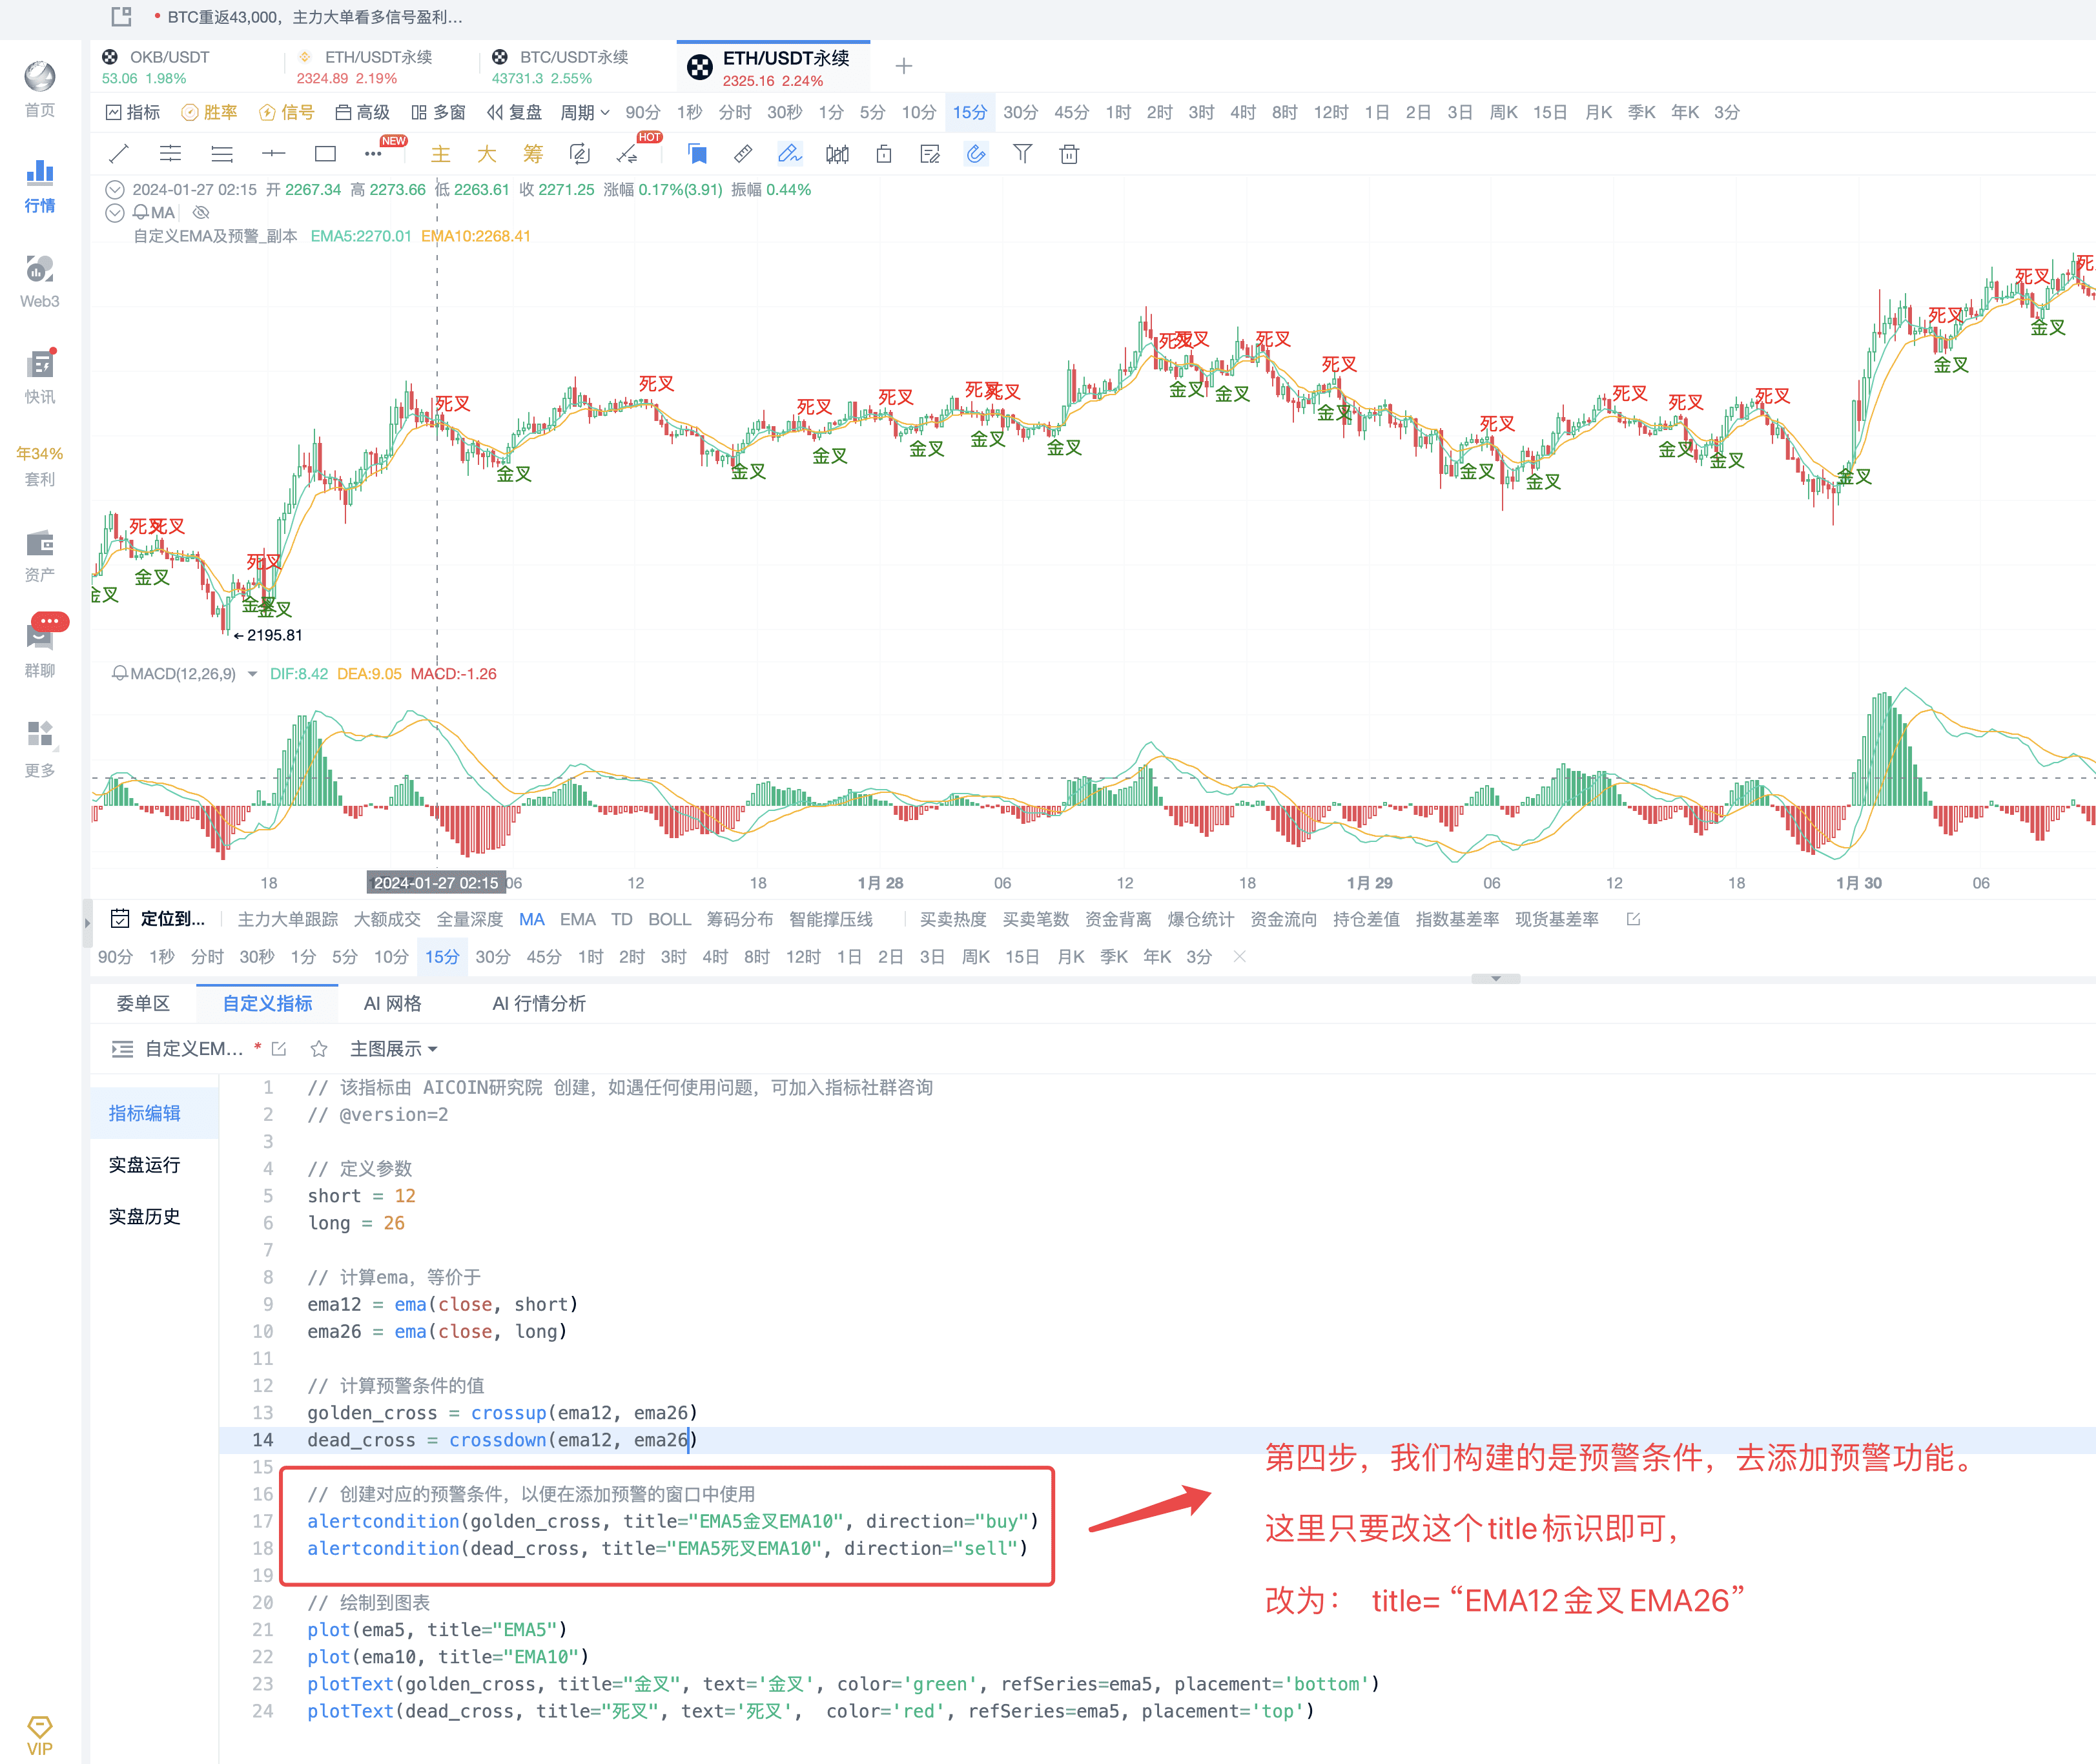
Step 3: Constructing Signal Conditions
Step 4: Change Alert Conditions
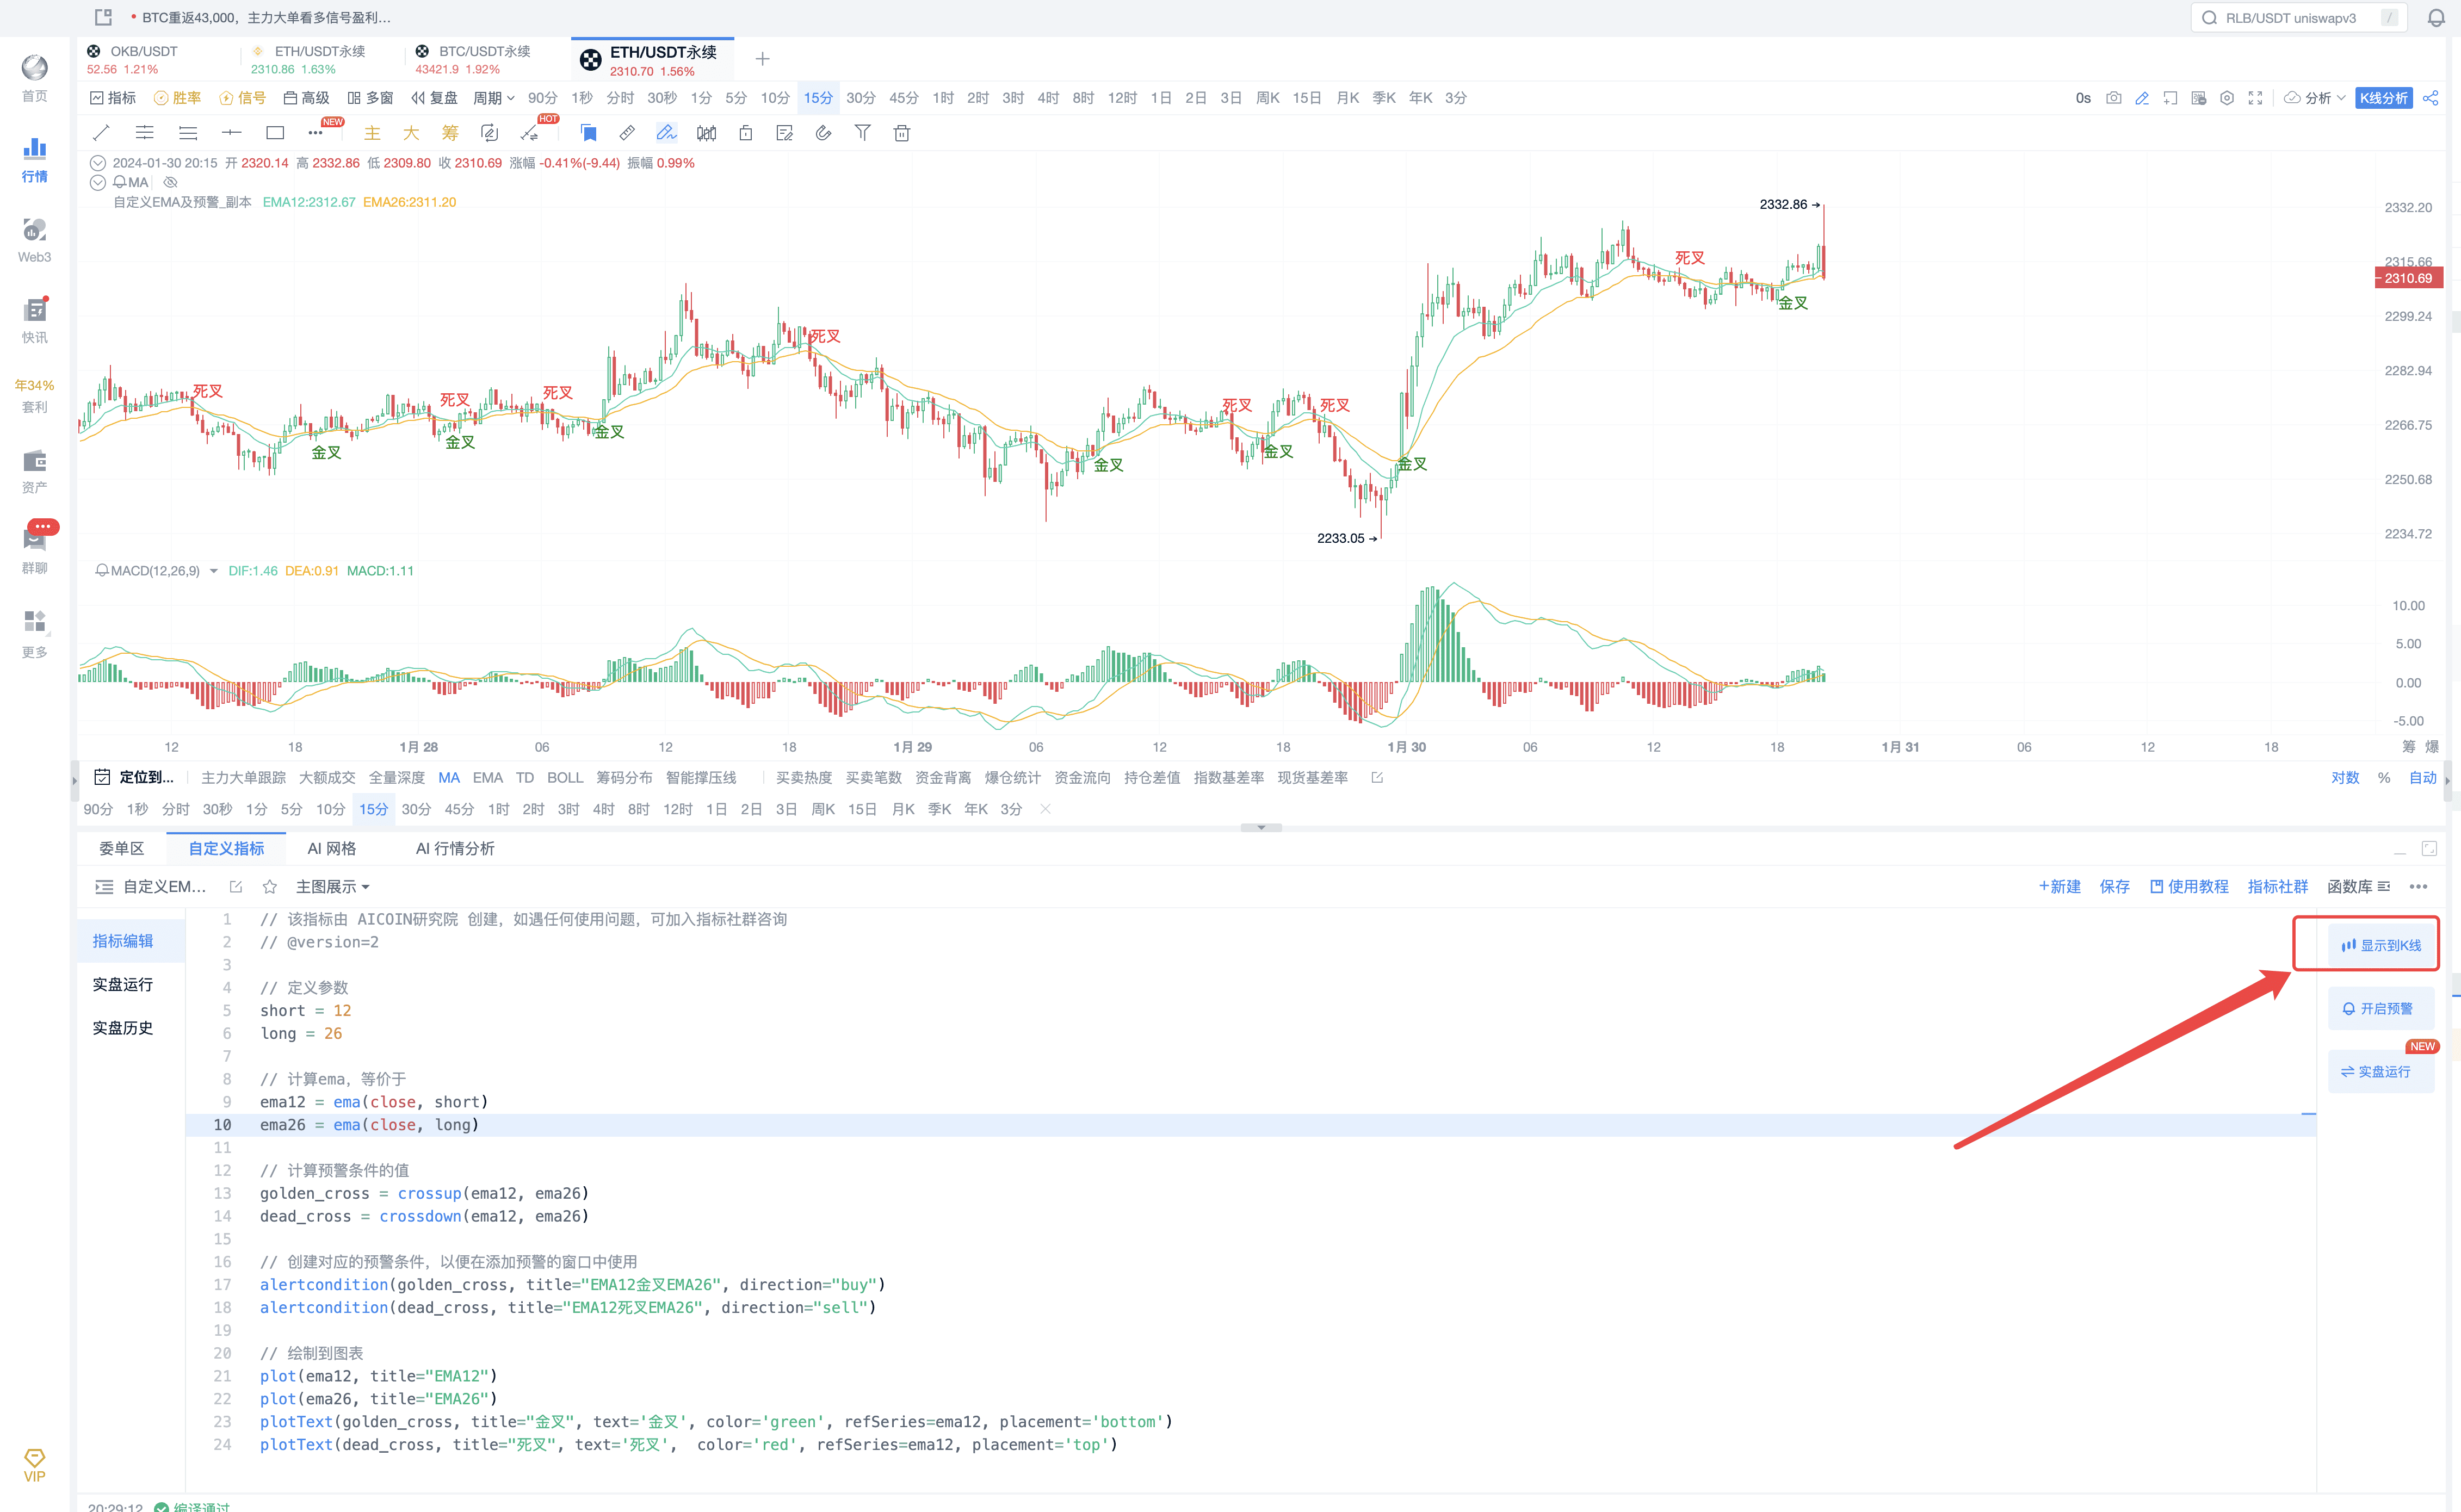
Step 5: Click to Display on the K-line
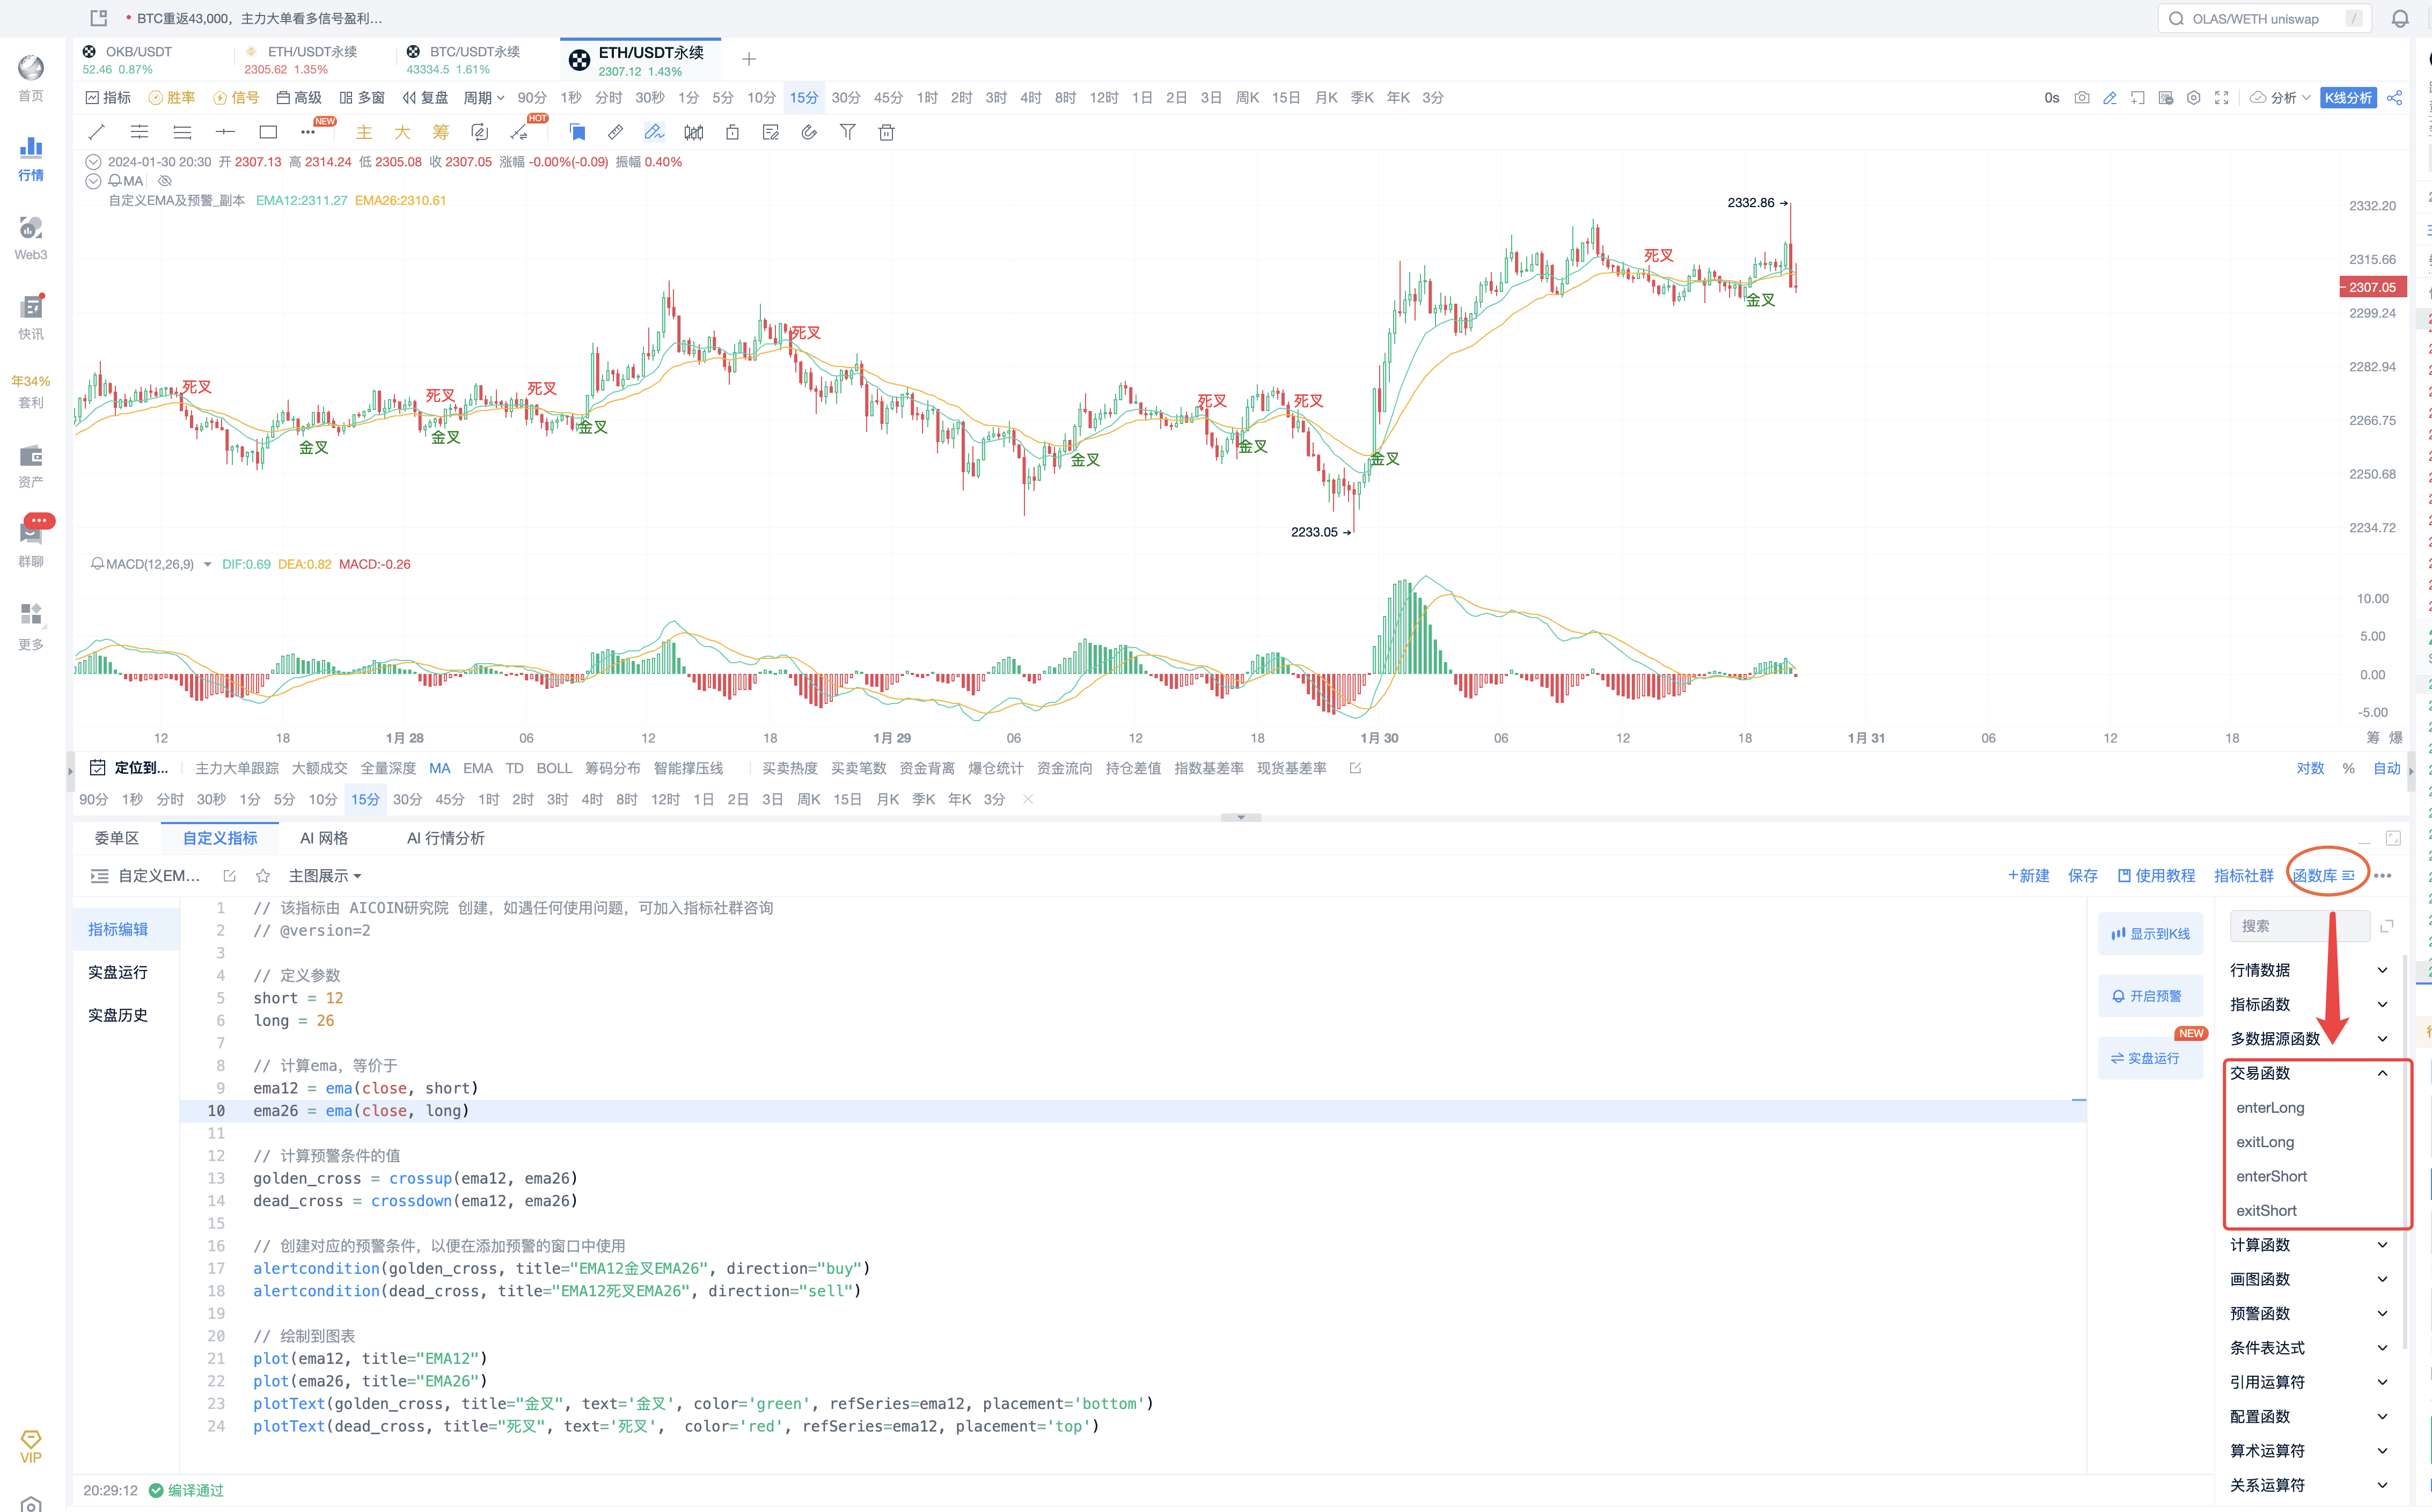
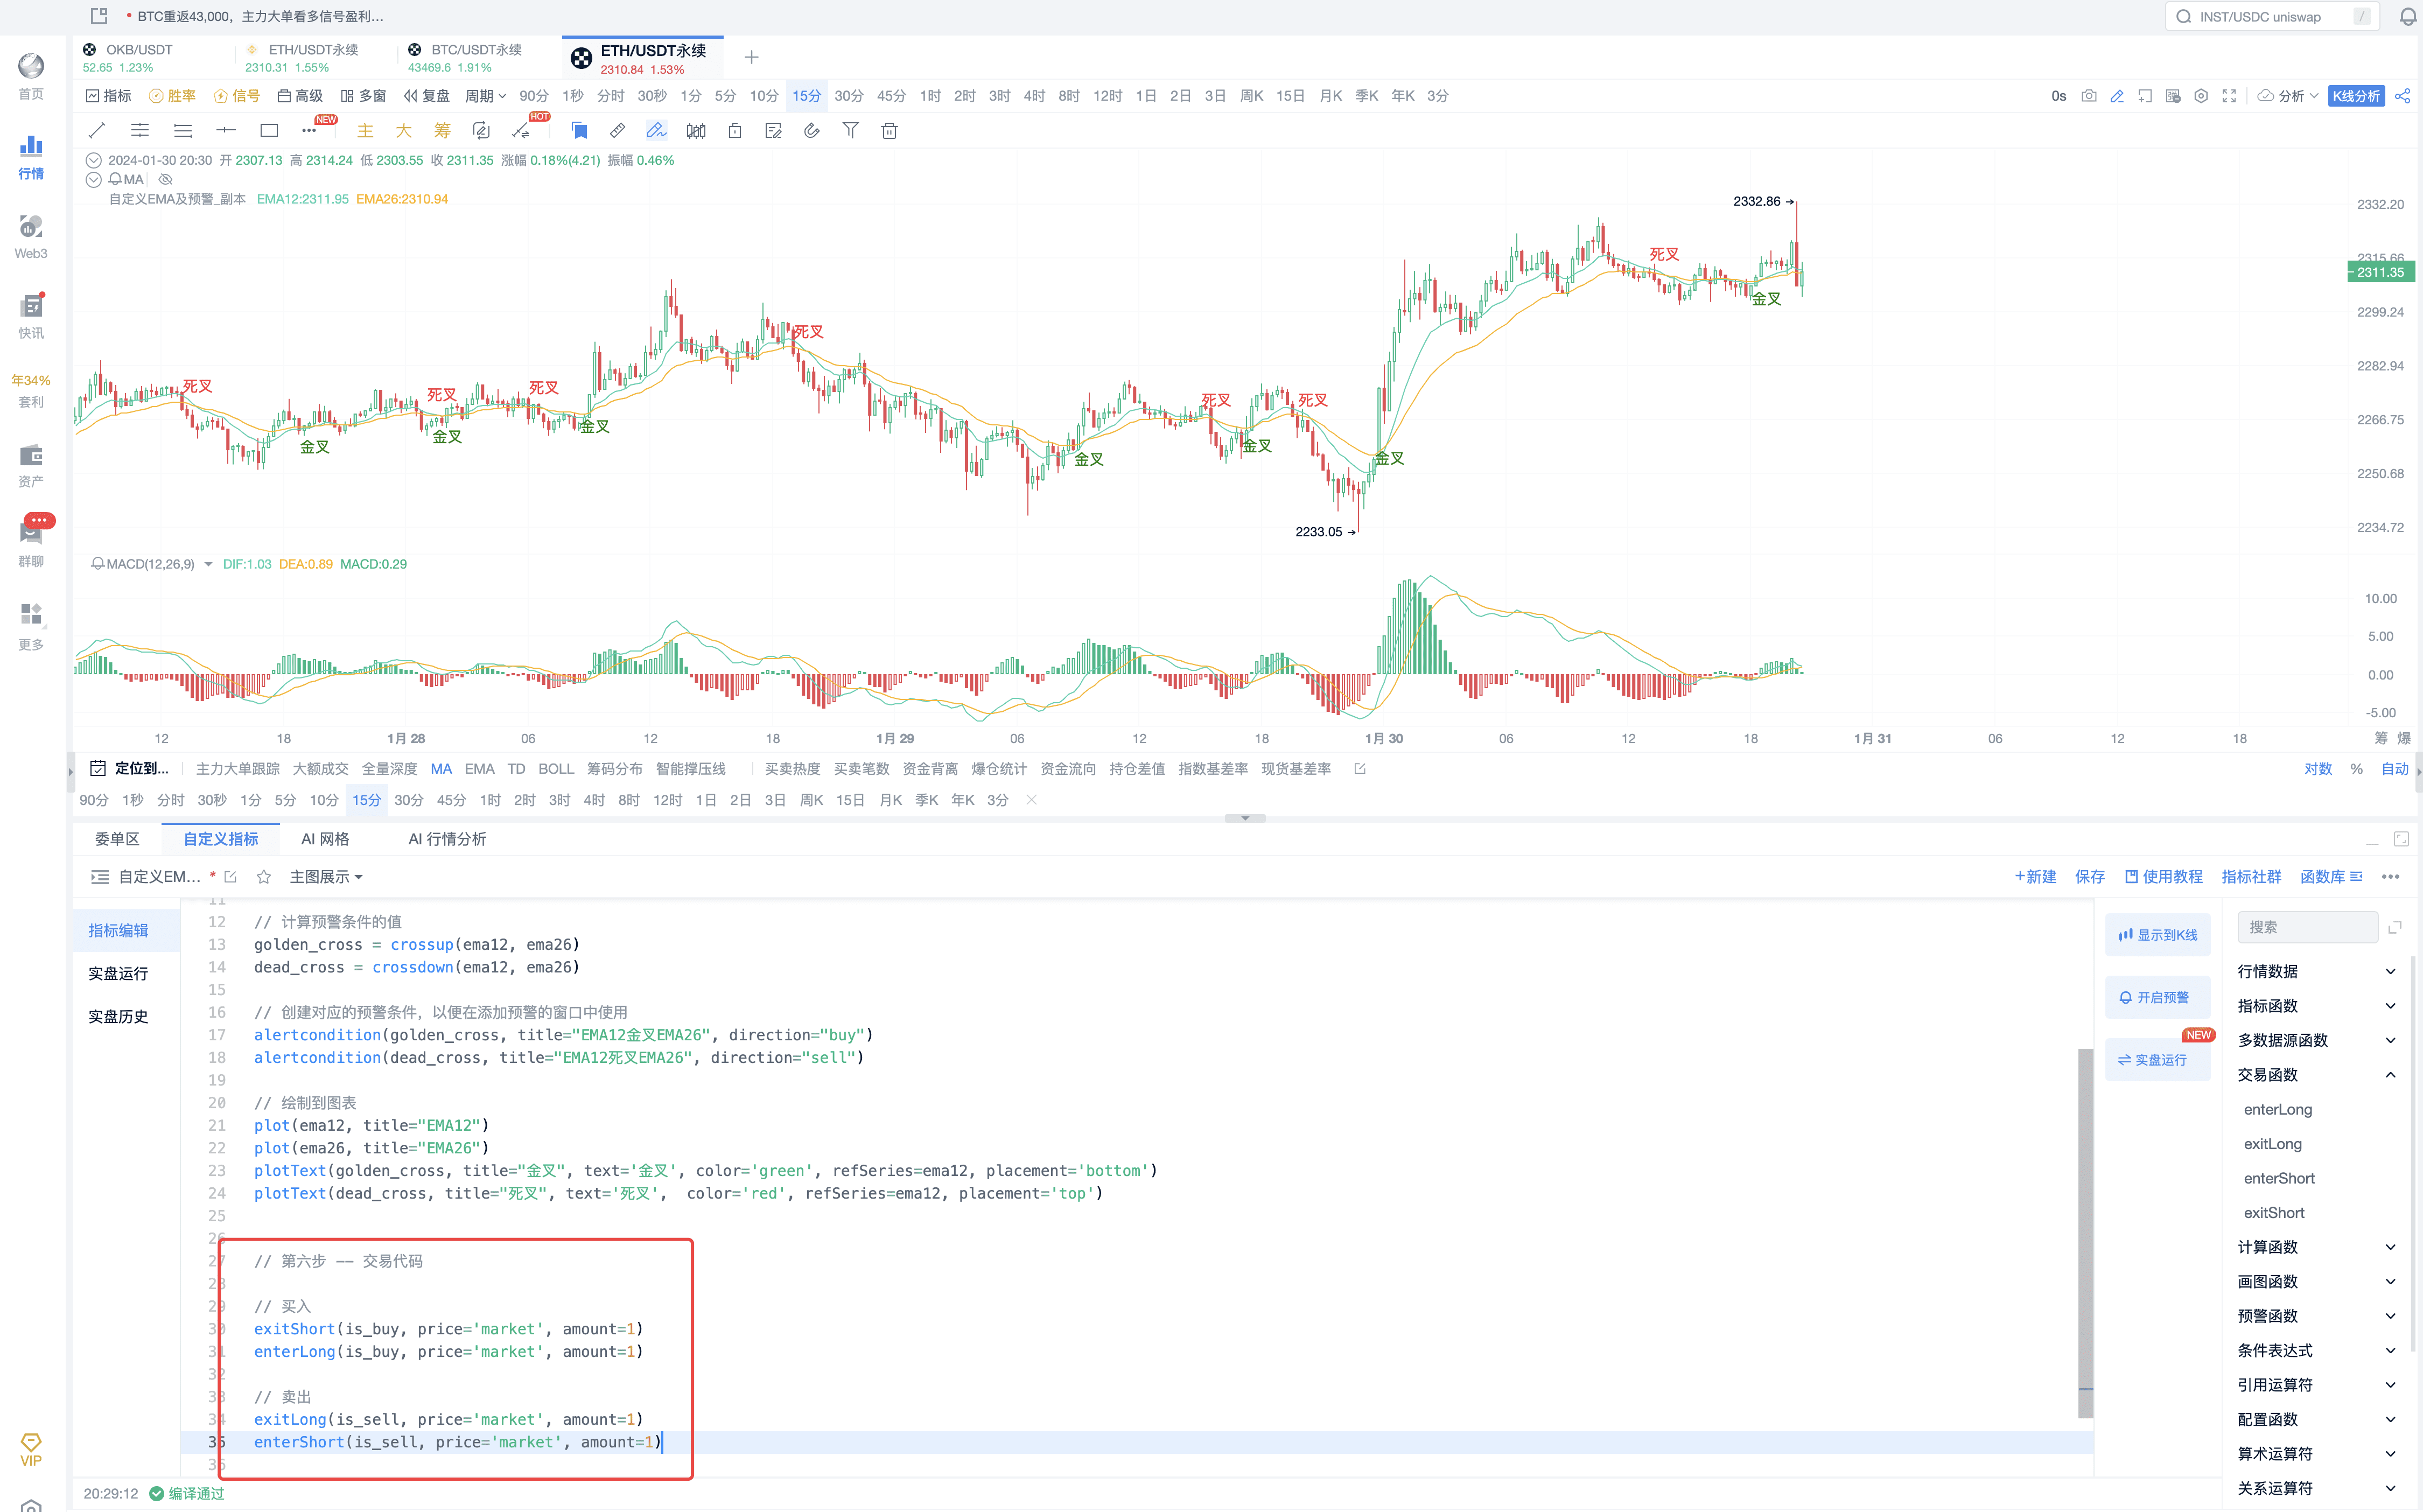
Step 6: Add Trading Functions
Supplement trading code
Step 7: Complete Trading Code
(1) Complete version of trading code
// This indicator is created by AICOIN Research Institute. In case of any usage issues, you can join the indicator community for consultation.
// @version=2
// Define parameters
short = 12
long = 26
// Calculate EMA, equivalent to
EMA12 = EMA(close, short)
EMA26 = EMA(close, long)
// Calculate the value of alert conditions
golden_cross = crossup(EMA12, EMA26)
dead_cross = crossdown(EMA12, EMA26)
// Create corresponding alert conditions for use in the alert window
alertcondition(golden_cross, title="EMA12 Golden Cross EMA26", direction="buy")
alertcondition(dead_cross, title="EMA12 Death Cross EMA26", direction="sell")
// Draw on the chart
plot(EMA12, title="EMA12")
plot(EMA26, title="EMA26")
plotText(golden_cross, title="Golden Cross", text='Golden Cross', color='green', refSeries=EMA12, placement='bottom')
plotText(dead_cross, title="Death Cross", text='Death Cross', color='red', refSeries=EMA12, placement='top')
// Step 6 -- Trading code
// Buy
exitShort(golden_cross, price='market', amount=1)
enterLong(golden_cross, price='market', amount=1)
// Sell
exitLong(dead_cross, price='market', amount=1)
enterShort(dead_cross, price='market', amount=1)
(2) If you only want to go long and not short, the trading code can be written as follows:
// Step 6 -- Trading code
// Buy
enterLong(golden_cross, price='market', amount=1)
// Close position
exitLong(dead_cross, price='market', amount=1)
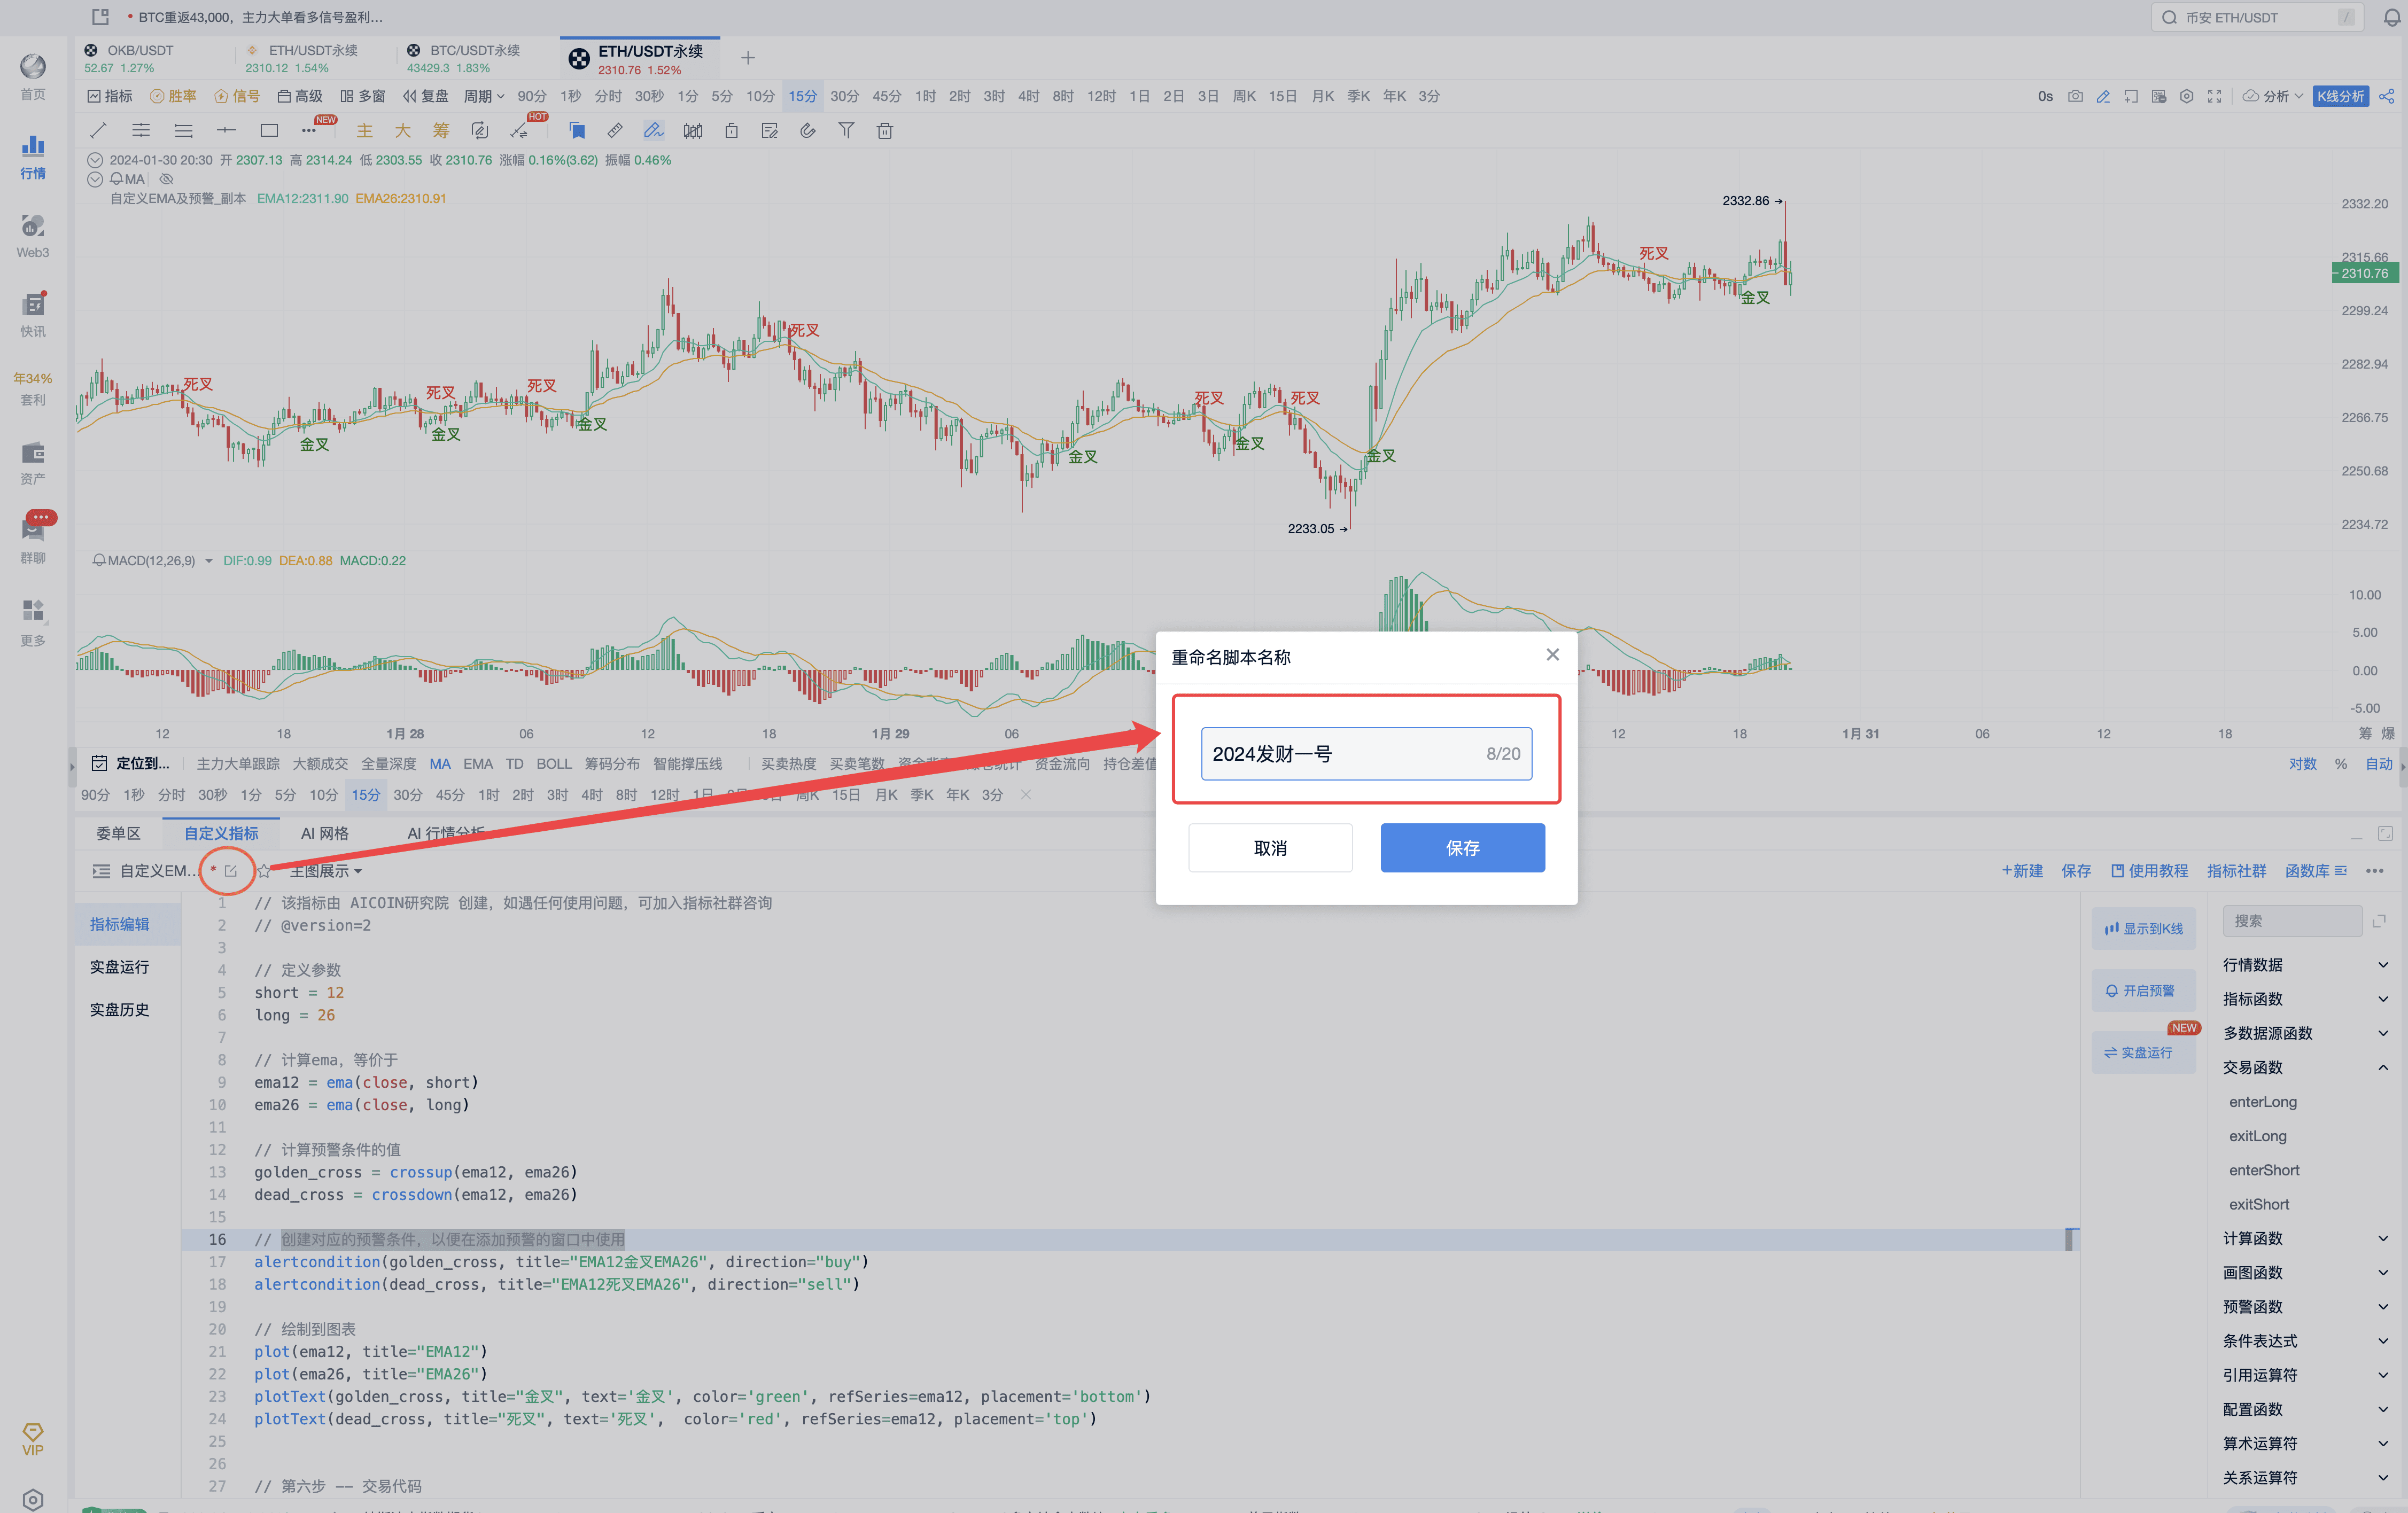
Step 8: Select to Modify Name as Shown in the Figure
IV. Parameter Modification for Real Trading
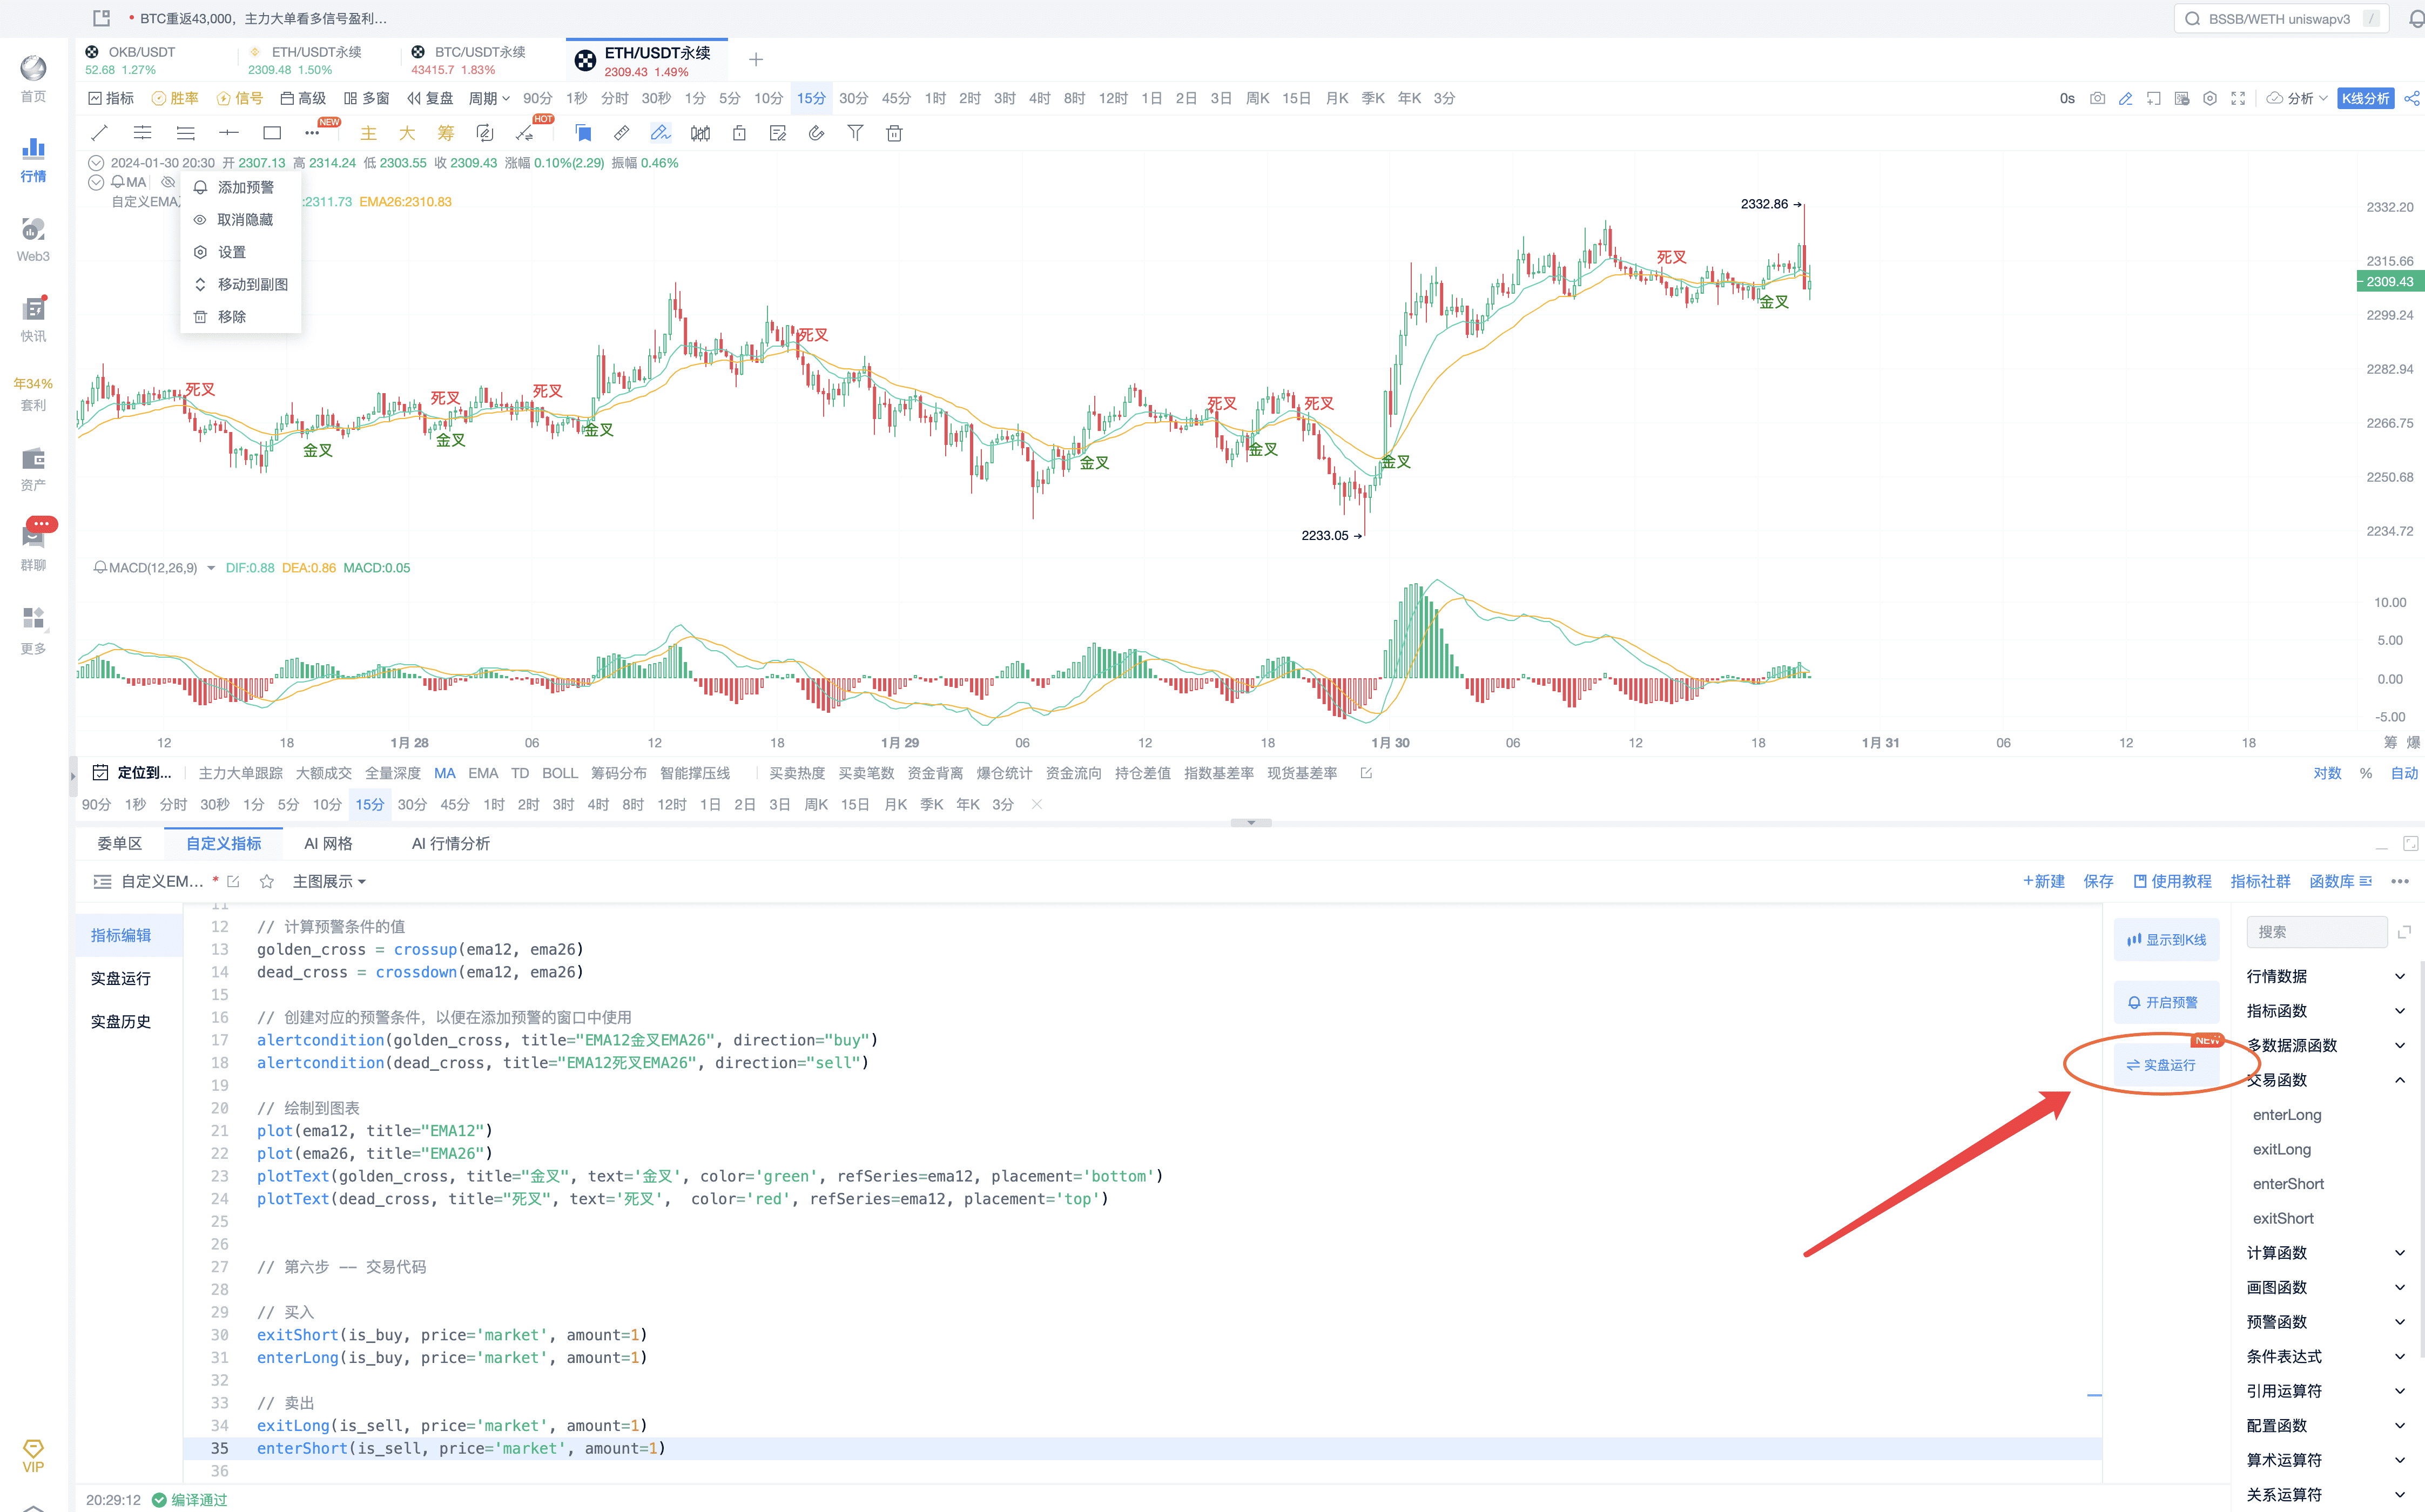
1. Click to Run Real Trading
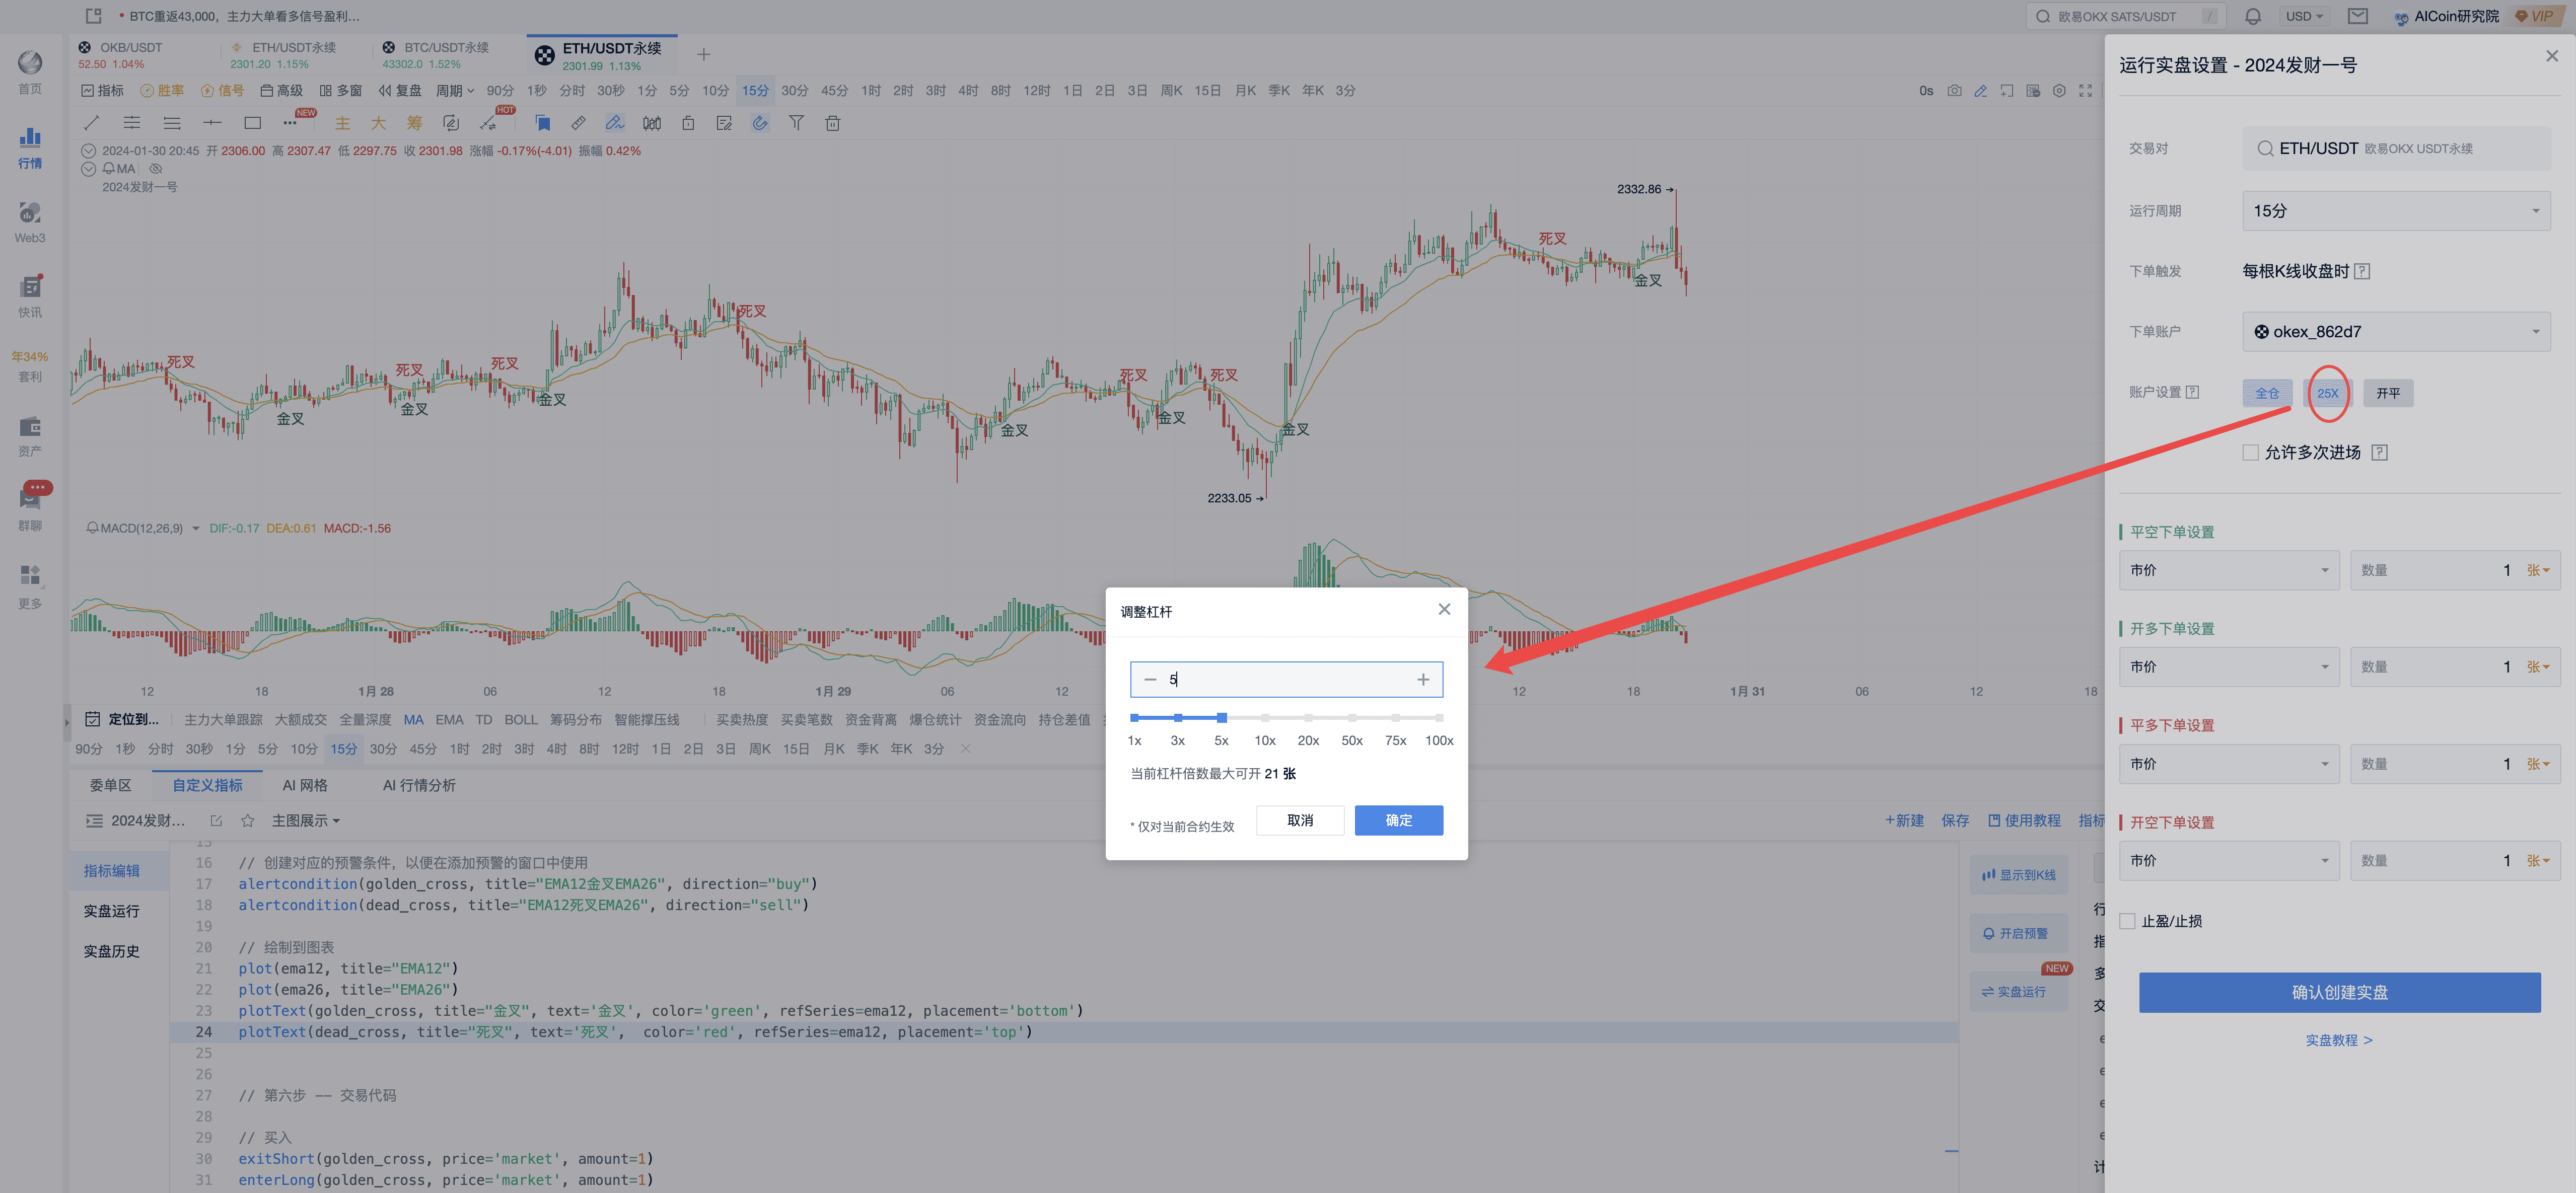
2. Confirm the trading target and period, and set the leverage multiplier properly; if the leverage is too high, it can be adjusted to 5 times.
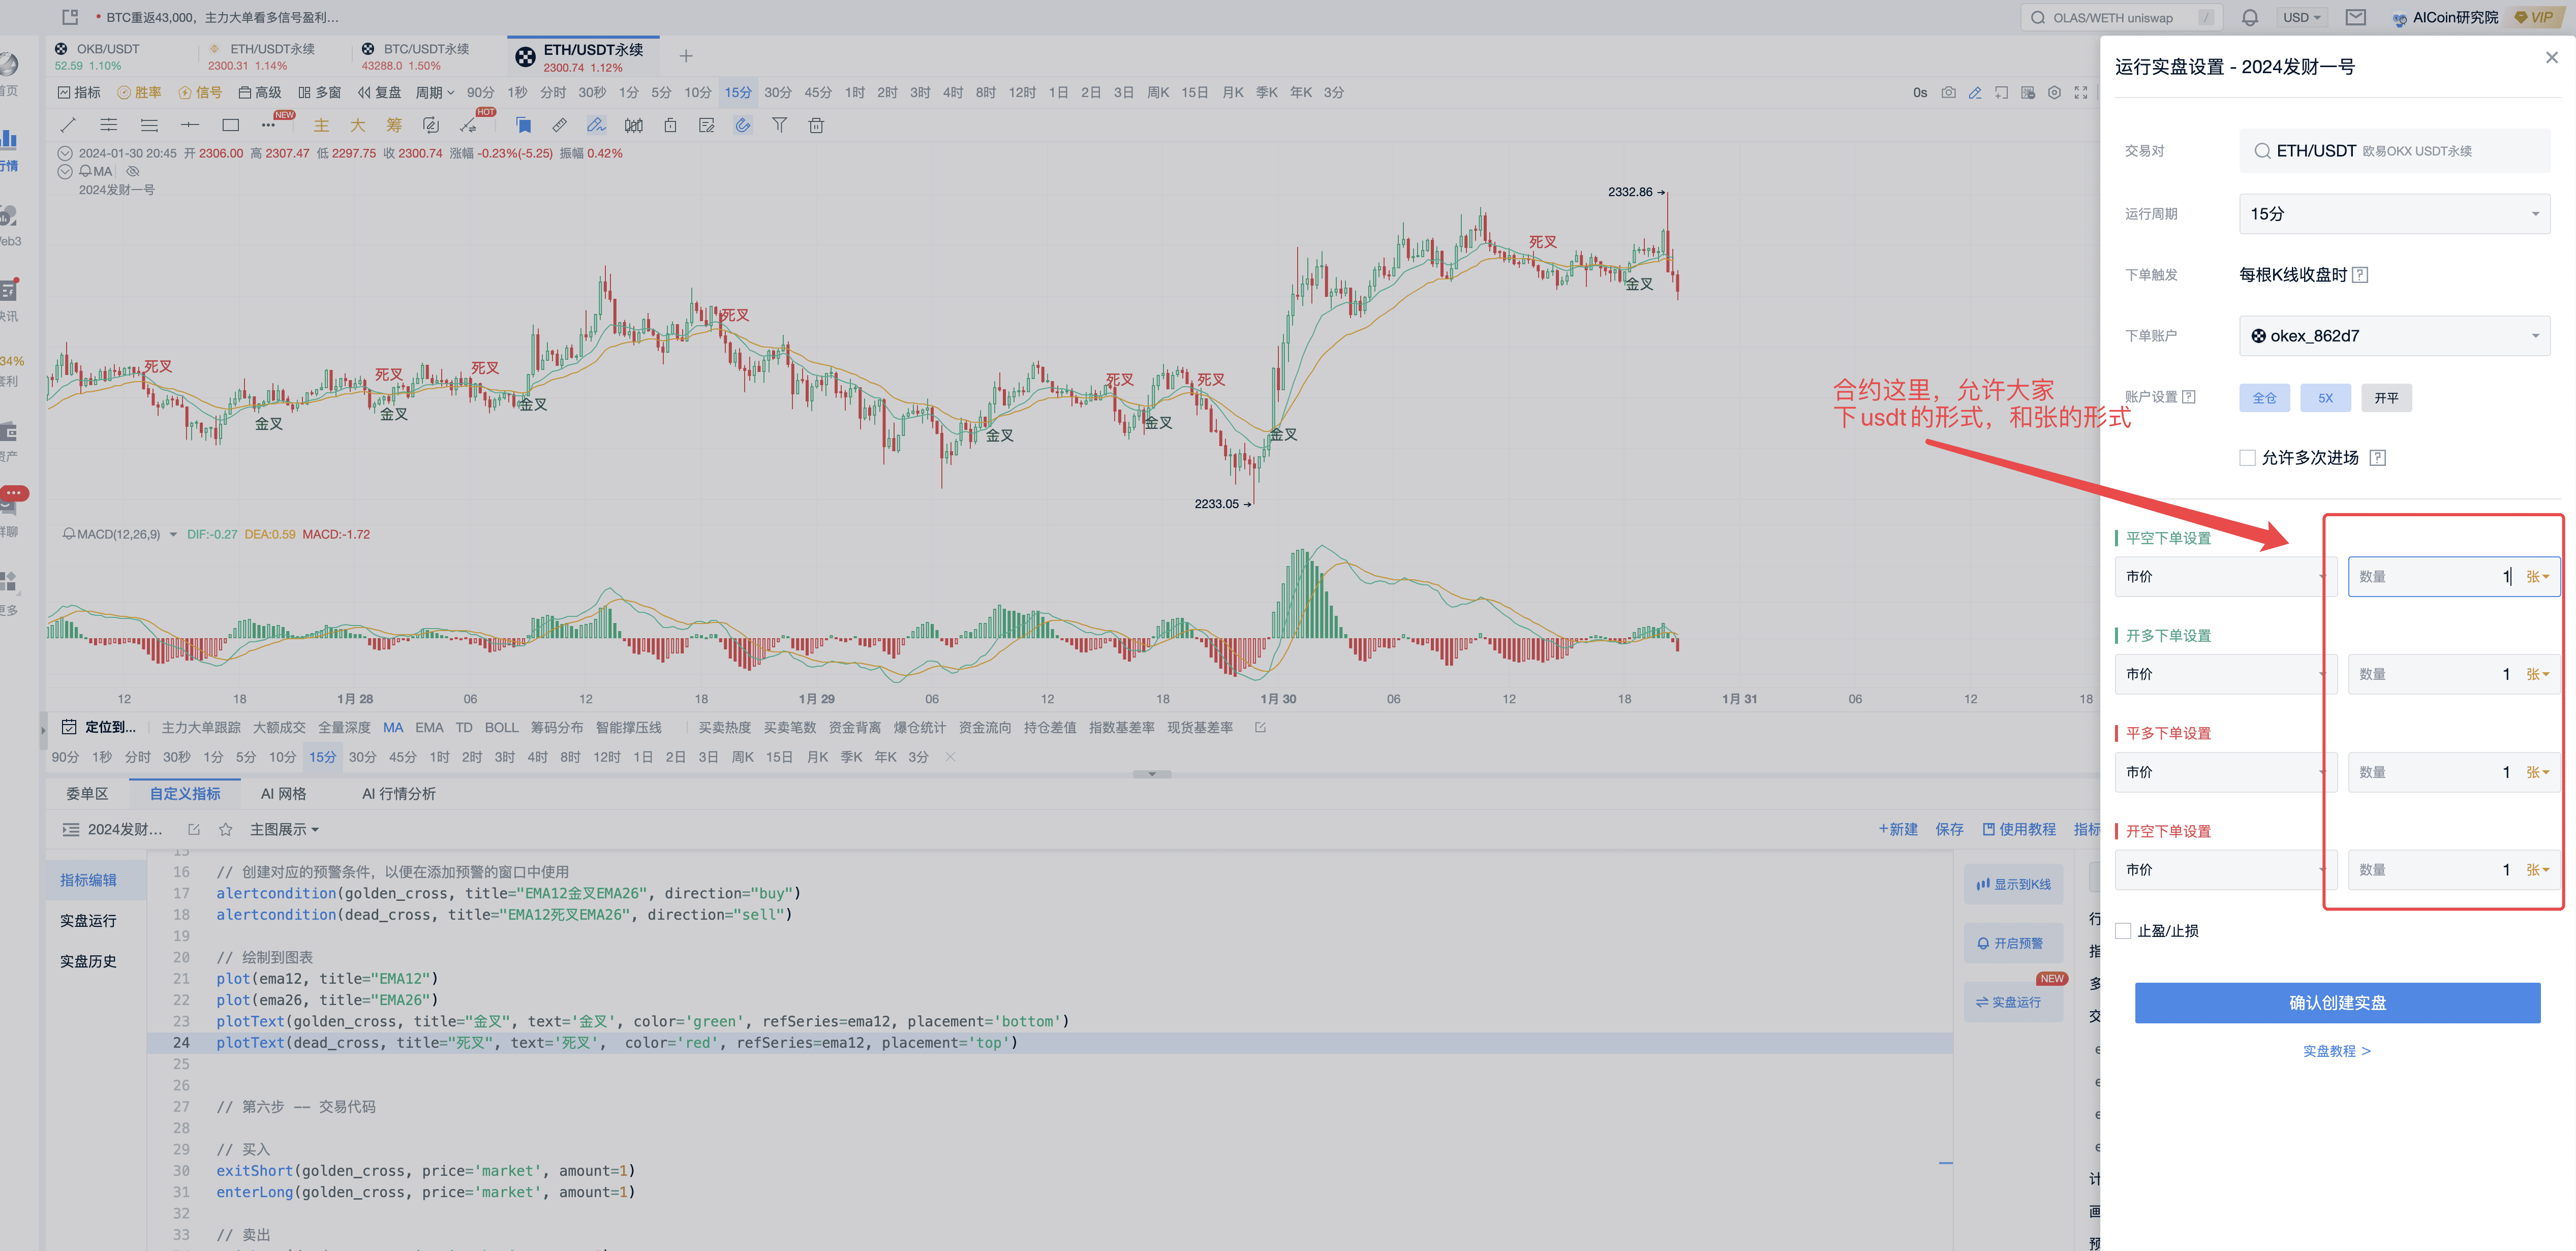
3. Make adjustments according to the situation, encircle to switch contract units as shown in the figure
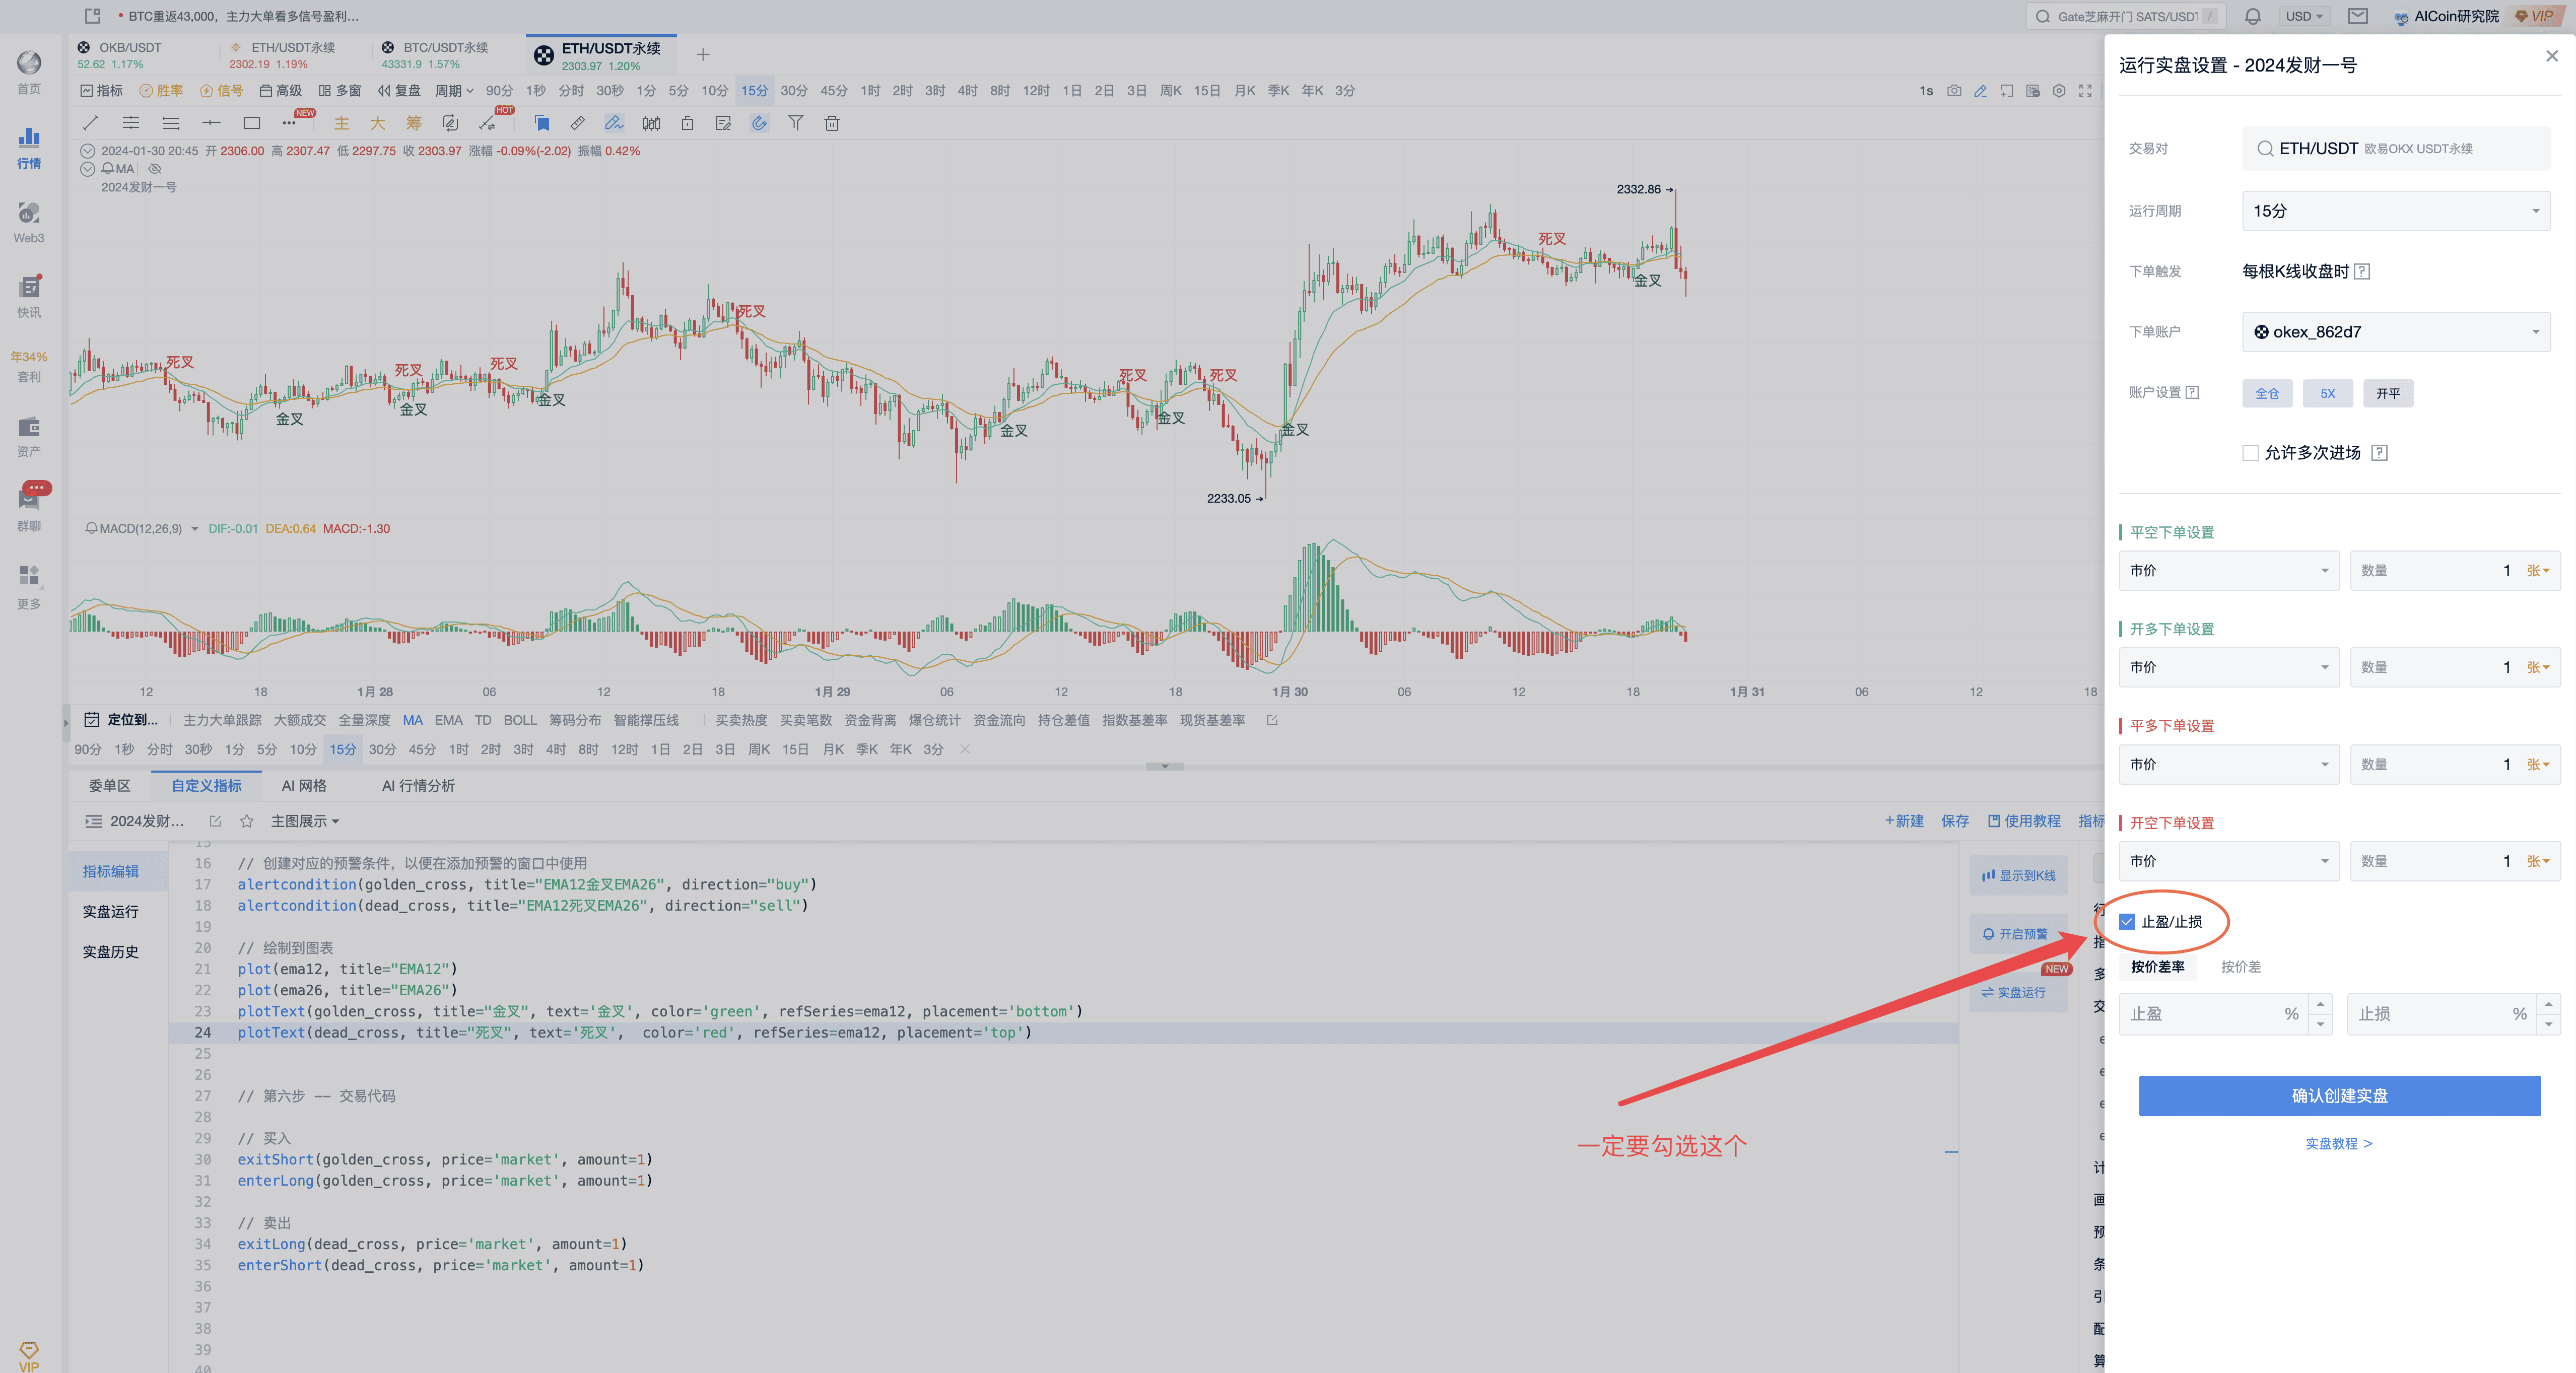
4. Check as shown in the figure, set take profit and stop loss
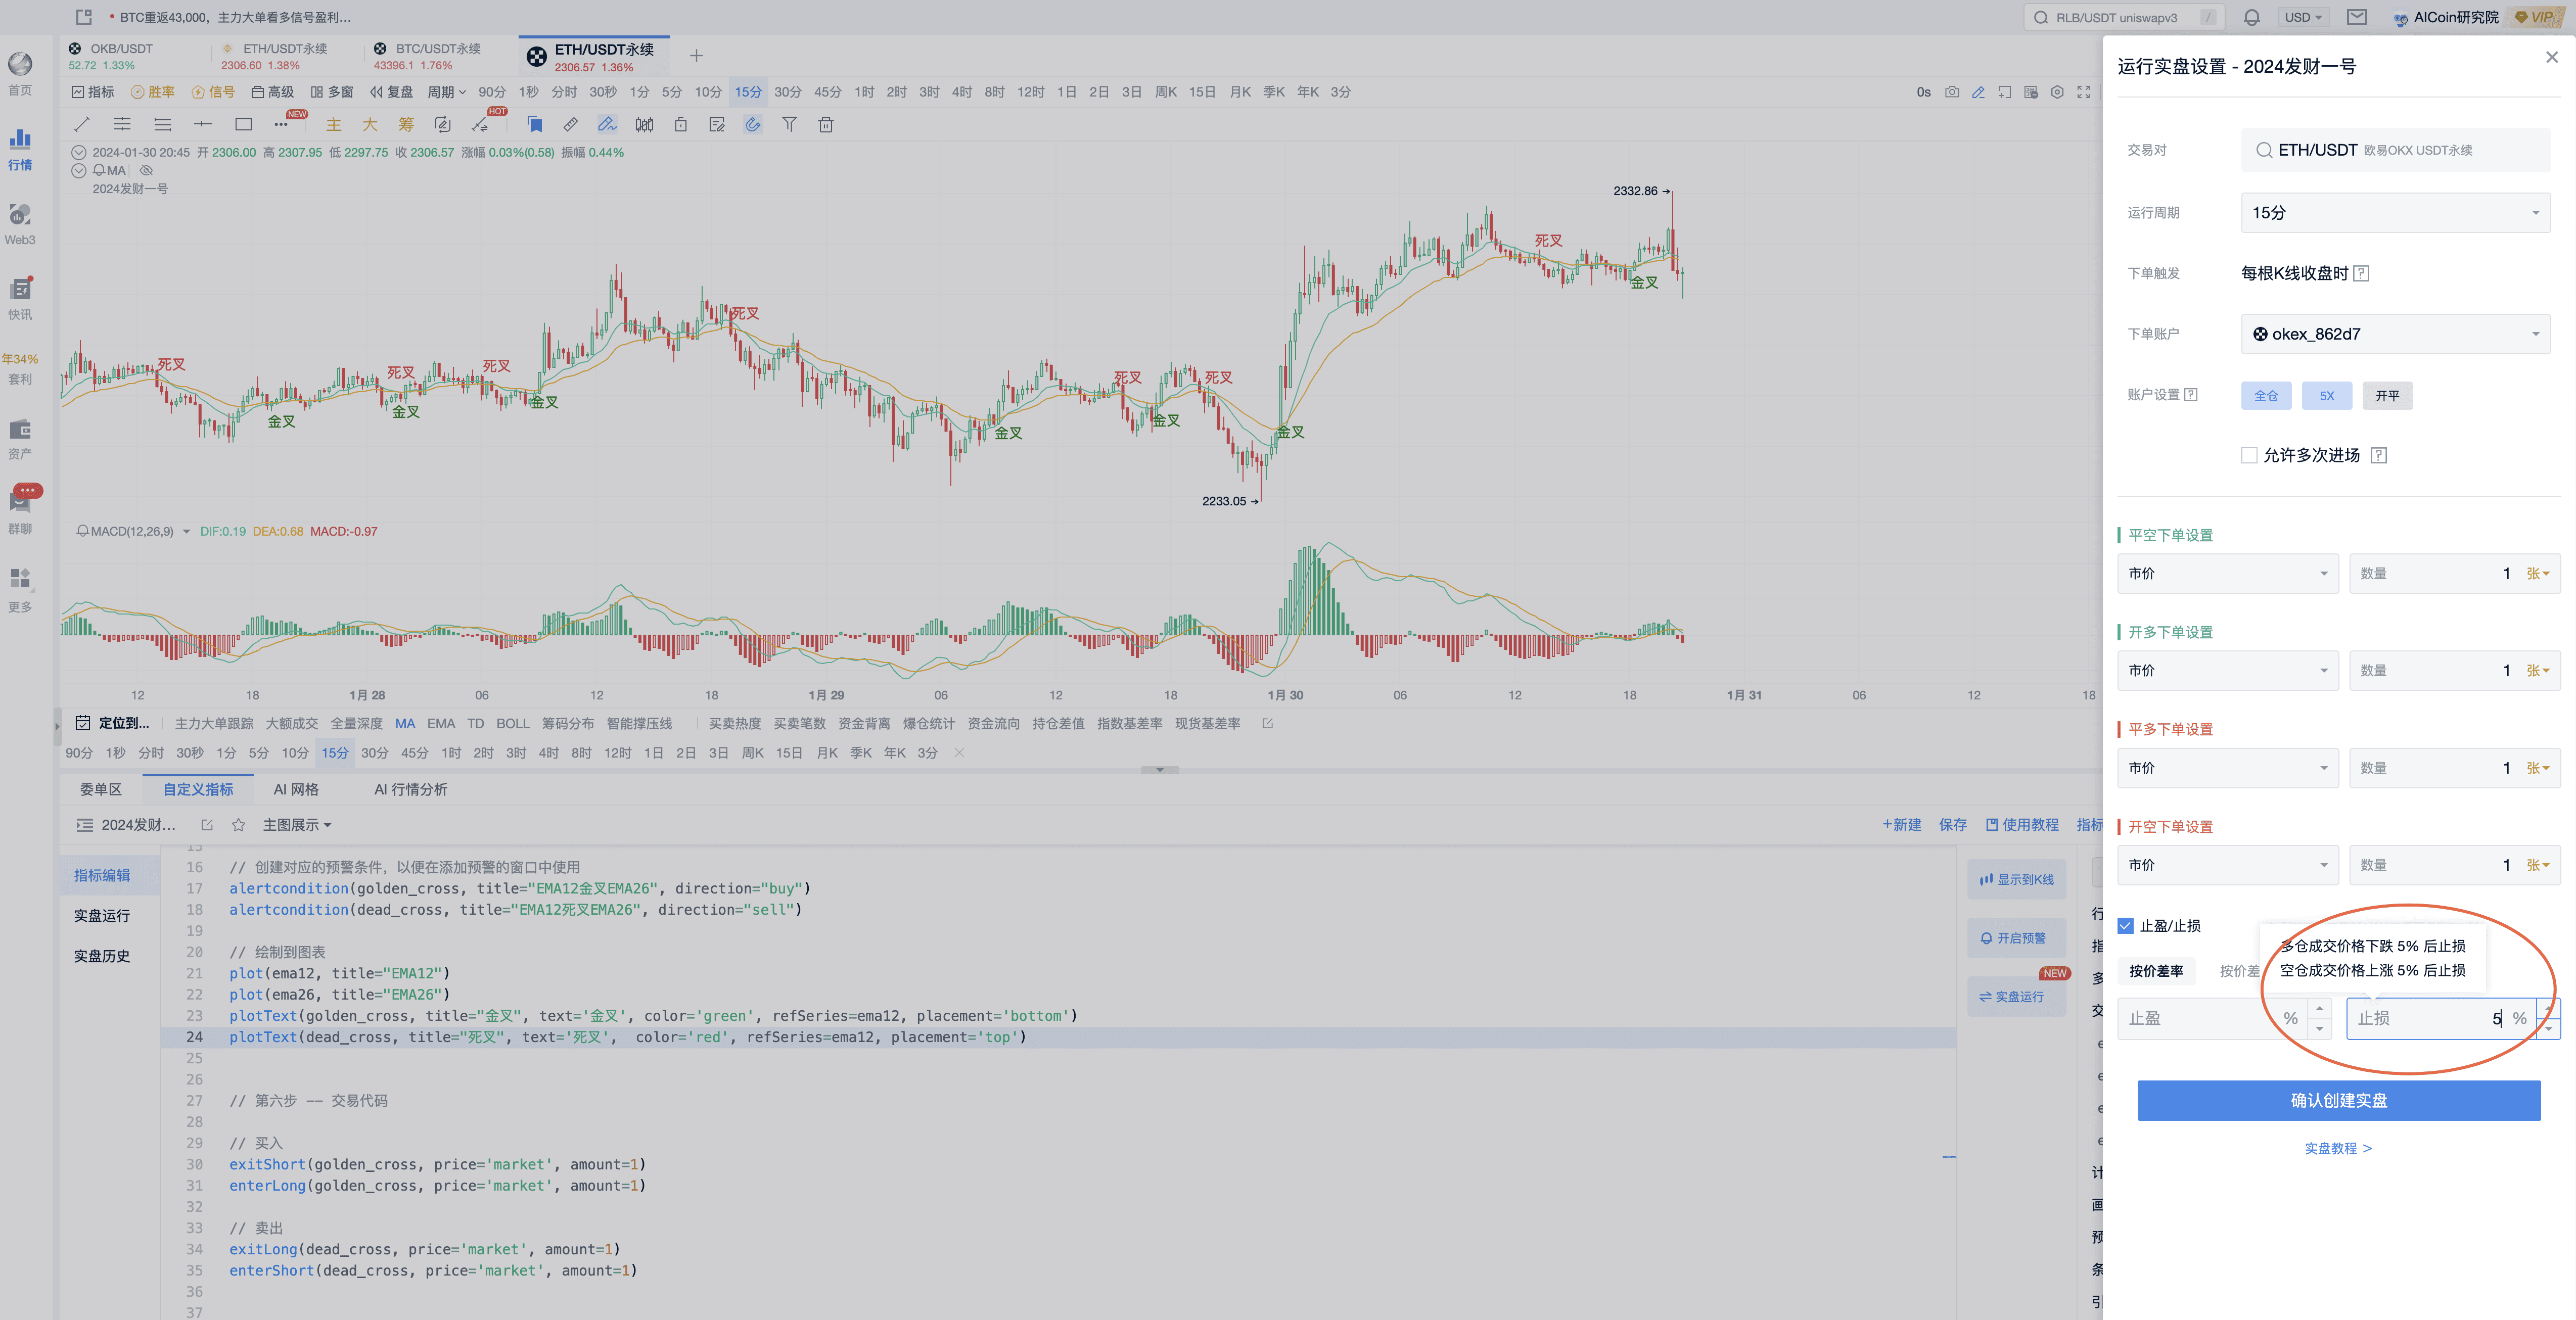
Refer to the settings in the figure below, and set the stop loss to be triggered after a 5% increase or decrease in transactions.
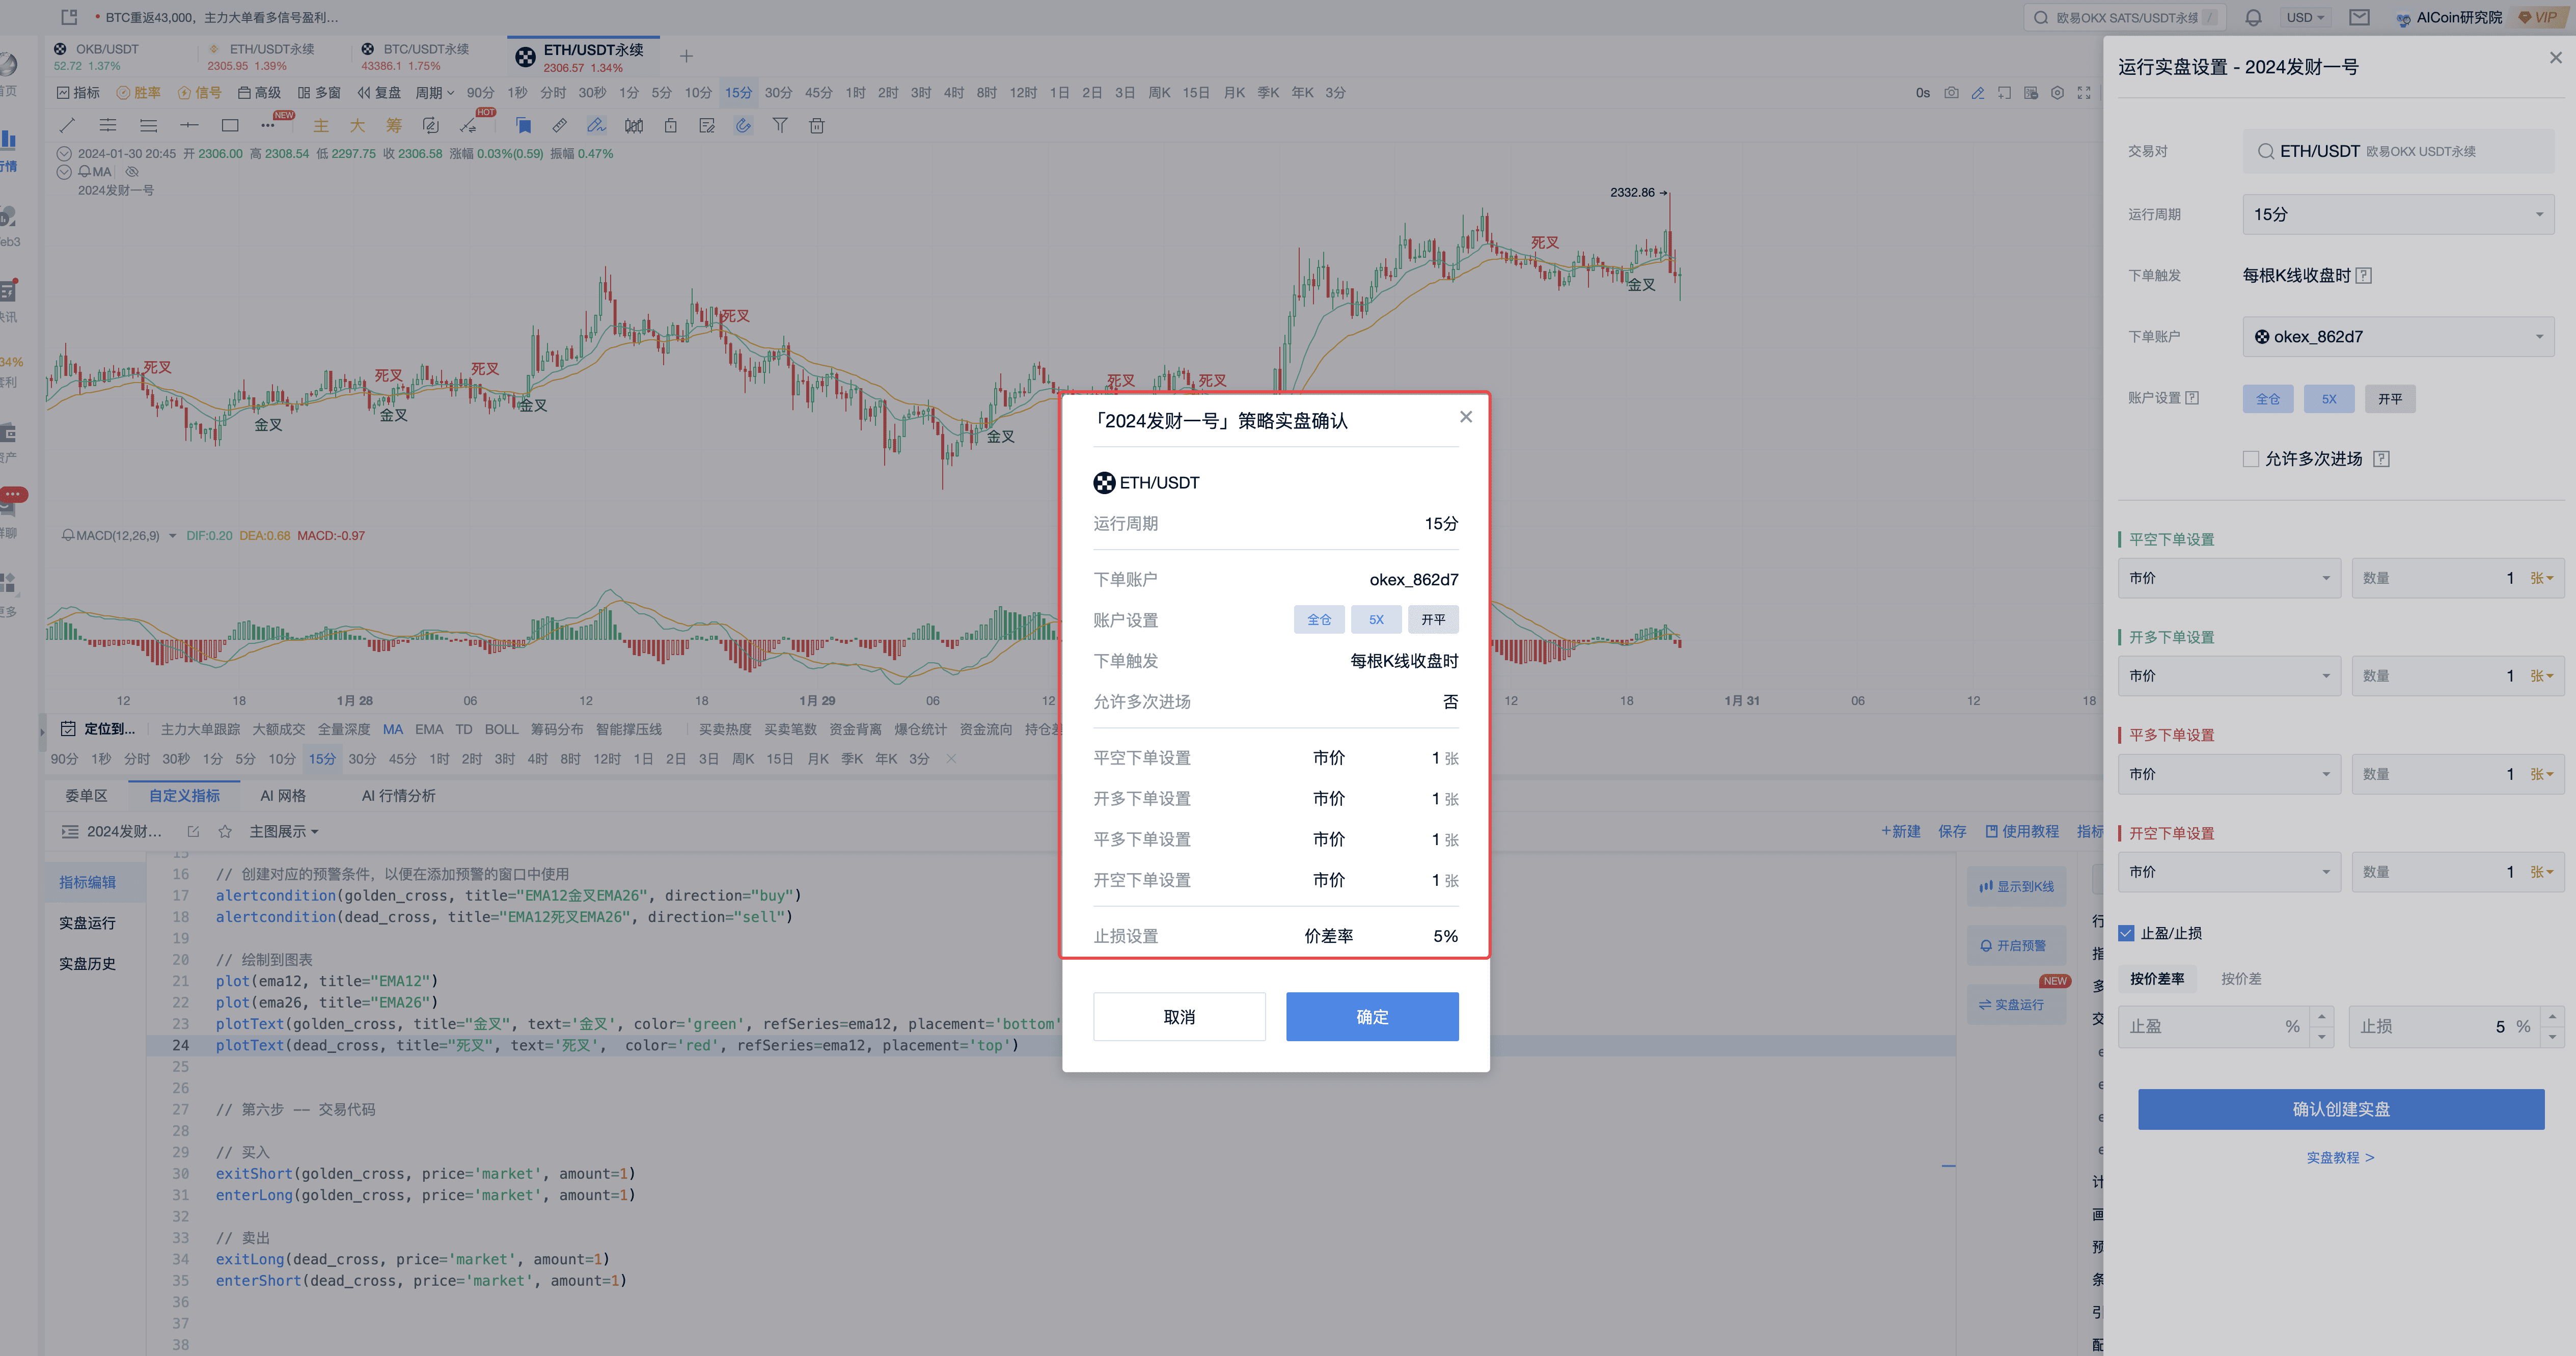
5. Click OK to run the real trading, and start the "Wealth No.1"!
6. View basic information as shown in the figure below
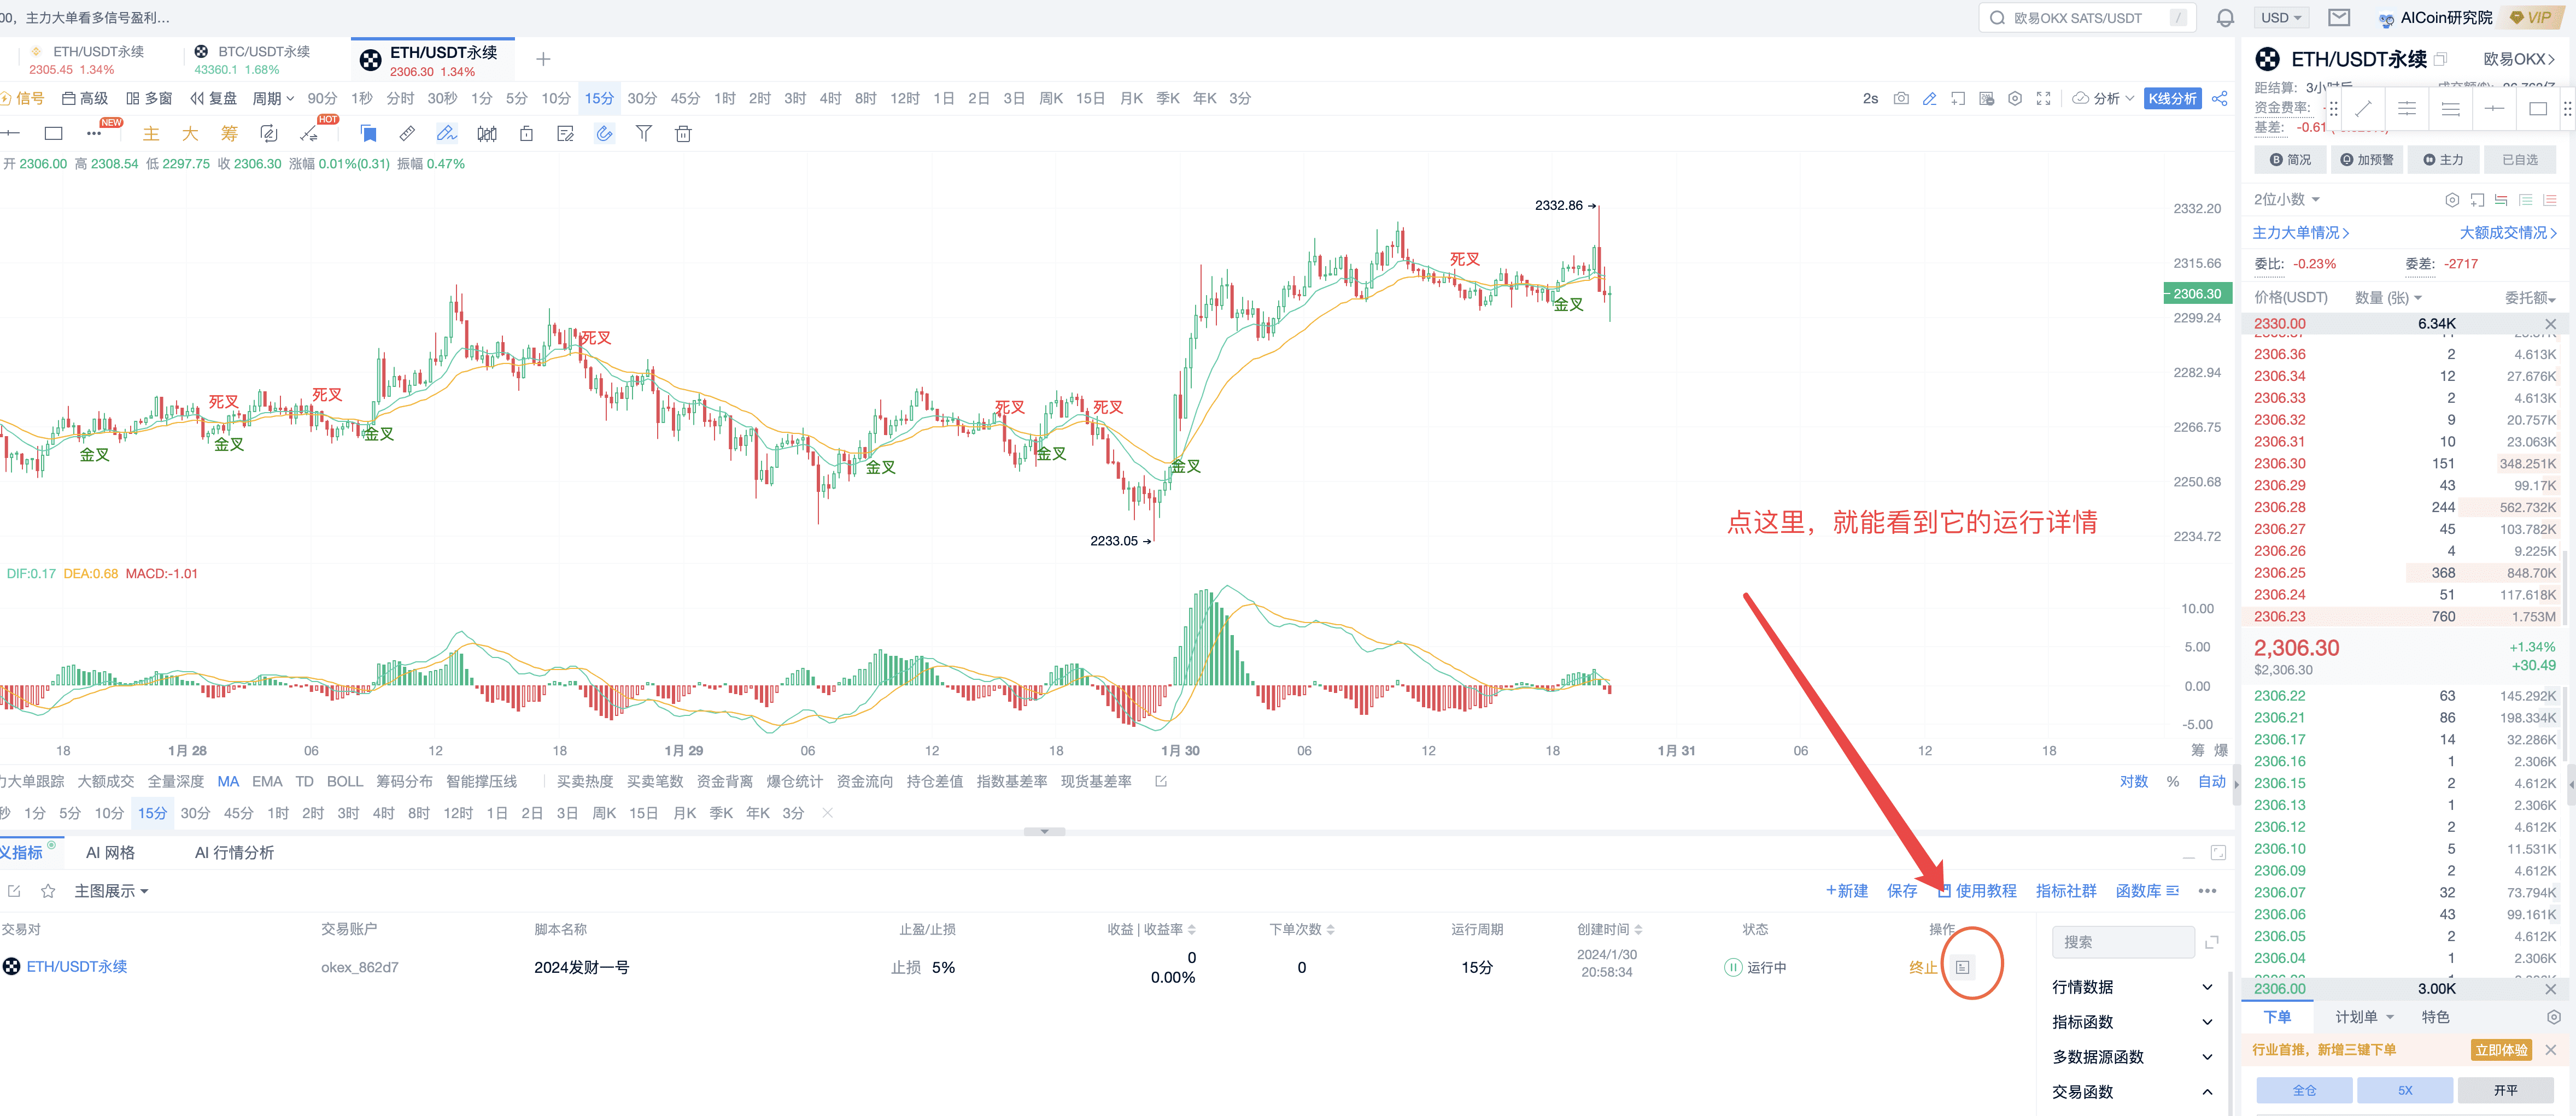
You can view detailed explanations of the strategy.
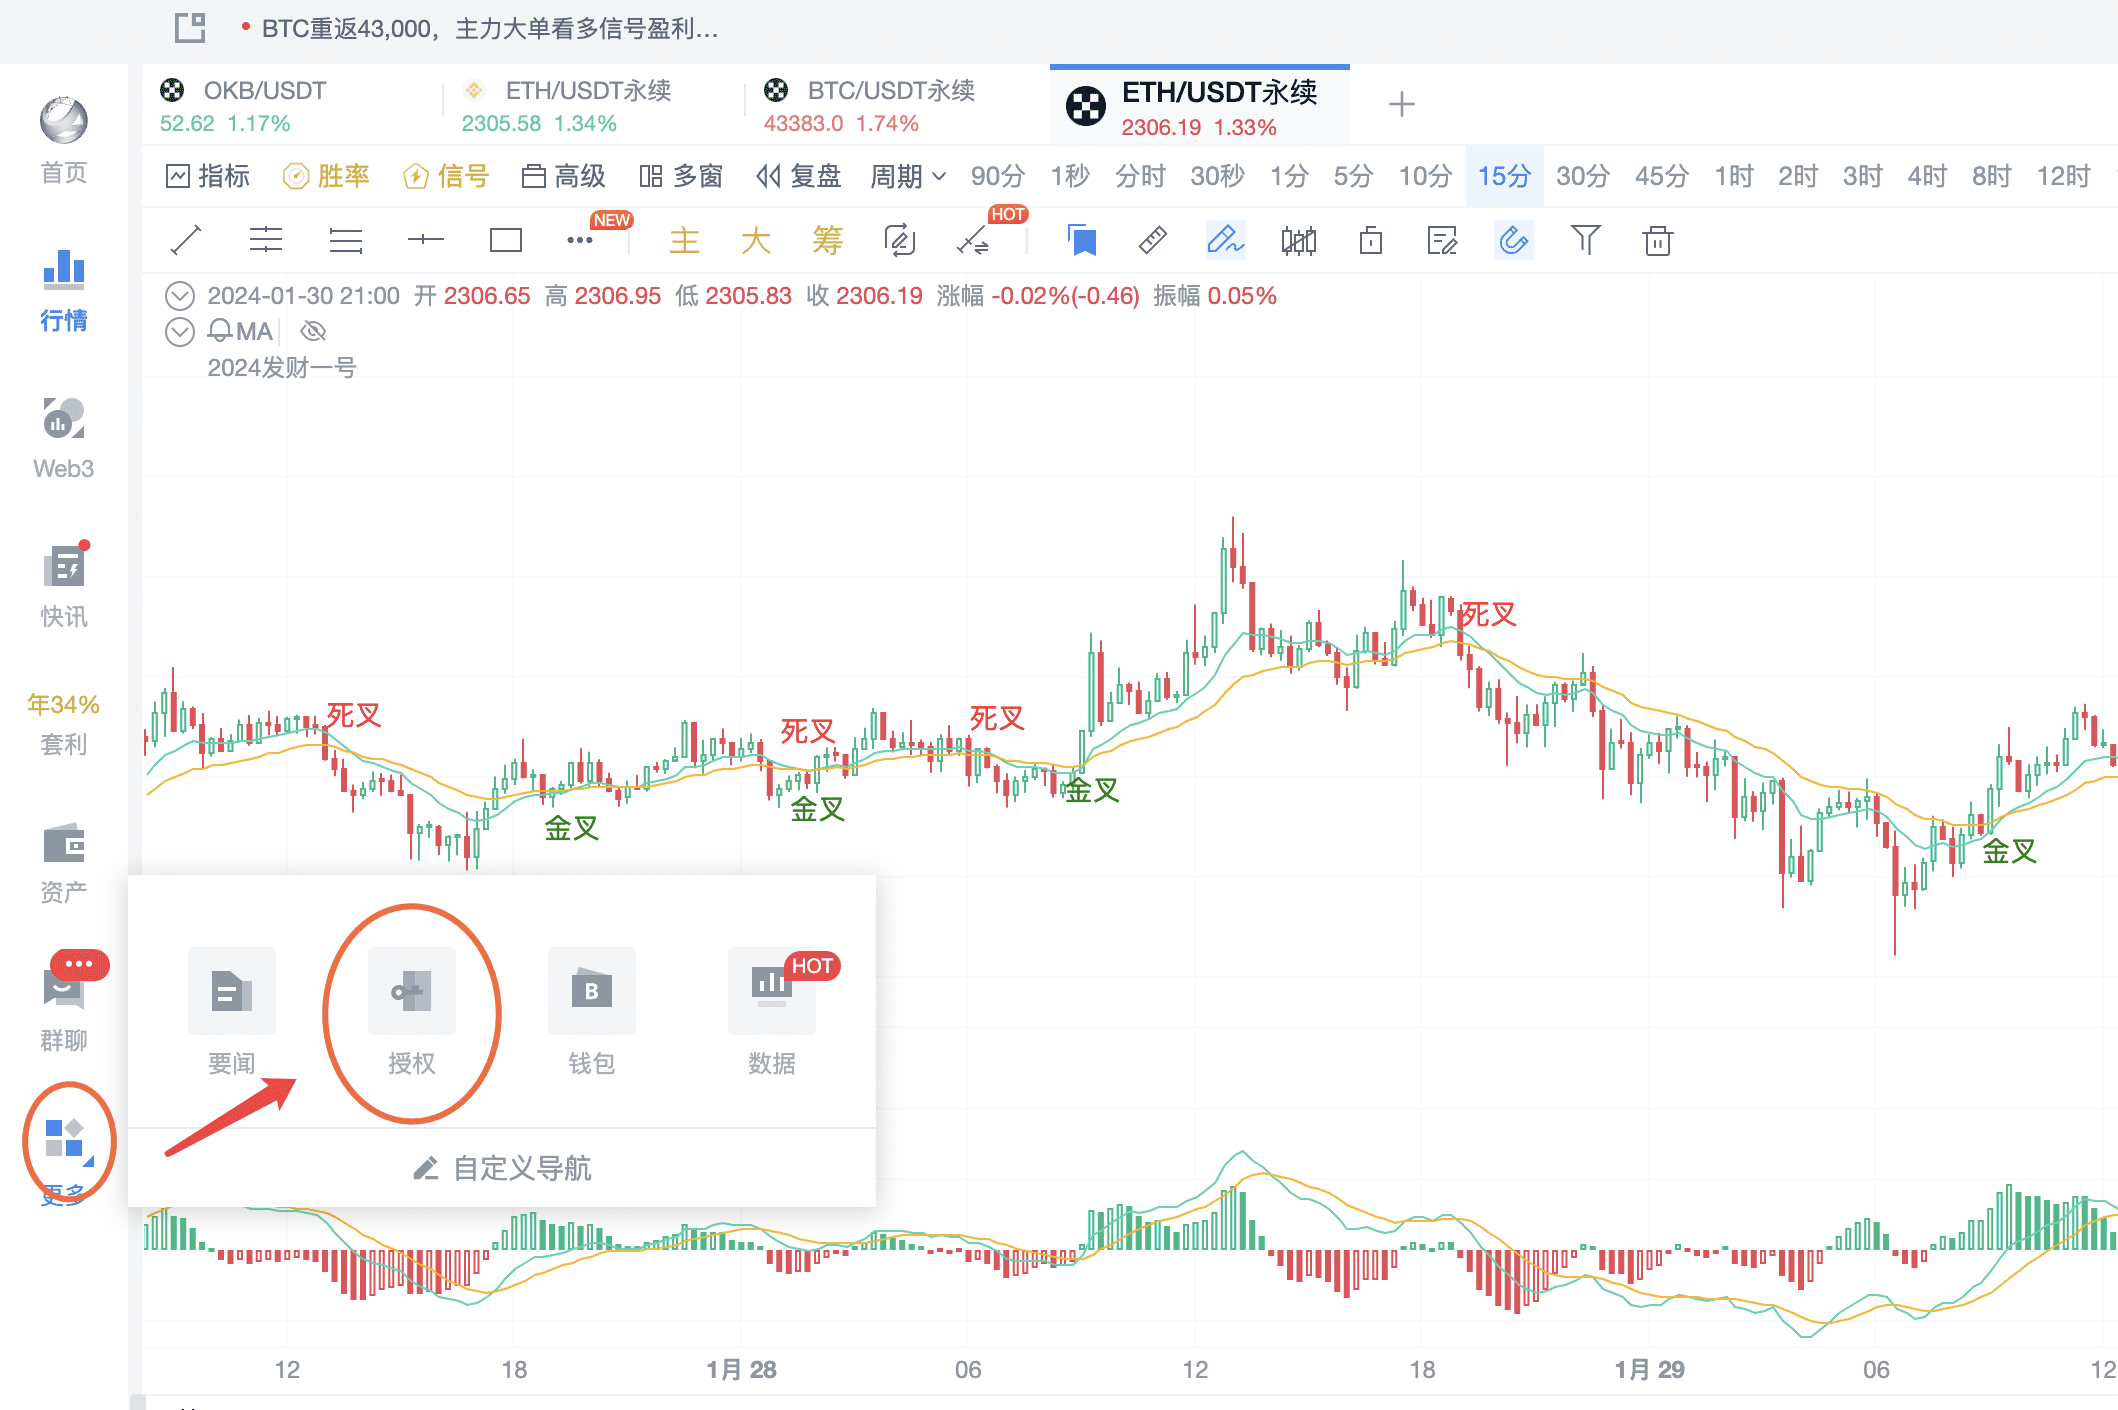
Other: This strategy can be used for spot and contract trading. Authorization as shown in the figure below is required before running real trading.
V. Q&A:
- What is the best period to use the EMA indicator?
The EMA indicator is very useful for timeframes below 4 hours.
- How to determine when to use which strategy?
First, make a preliminary judgment by analyzing a period of market trends, and also consider the indicators on a larger timeframe. Then, use custom indicators for automated trading. However, manual observation of the market direction is still necessary.
- How to filter out oscillating signals?
Trend strategies generally need to be endured. What can be done is to add some indicators to filter out unsuitable signals. For example, the previously recommended MA strategy, EMA triple moving average strategy, different strategies make different profits.
In the future, our research institute will be stationed in the PRO group to share more signals and market opportunities with students. In 2024, our research institute will bring different perspectives and different ways of making profits. In our live broadcast room, in our PRO CLUB group!

Join PRO membership, enjoy the benefits of PRO CLUB group members, and explore trading opportunities to build automated trading strategies together. Click the link below to open the PRO group automatically: https://www.aicoin.com/zh-CN/vip
Recommended Reading
Unveiling MACD: The All-Powerful Indicator in the Investment Field
Spot BTC ETF: The New Darling of Investment, Promising Future
Mastering the MA Indicator, Embarking on the Road to Financial Freedom
For more live broadcast content, please follow AICoin's "News/Information-Live Review" section, and feel free to download AICoin PC End
免责声明:本文章仅代表作者个人观点,不代表本平台的立场和观点。本文章仅供信息分享,不构成对任何人的任何投资建议。用户与作者之间的任何争议,与本平台无关。如网页中刊载的文章或图片涉及侵权,请提供相关的权利证明和身份证明发送邮件到support@aicoin.com,本平台相关工作人员将会进行核查。