I, a commoner, have been farming in Nanyang, striving to survive in the chaotic market, not seeking fame in the coin circle, but seeking to be true to my heart. I really like a quote from Robert T. Kiyosaki, "The love of money is the root of all evil, and poverty is the root of all evil." I believe everyone in the coin circle is here to profit. I hope that in the days to come, my market analysis can help everyone gain a lot in the coin circle. The sea of learning is boundless, and learning is endless. Continuously increasing one's knowledge and combining it with one's own trading habits is the only way to survive and achieve one's ambitions in the coin circle.
First, let's analyze the recent market trends of Bitcoin, Ethereum, Ordi, and ACE.
Bitcoin (BTC) has rebounded from around 38500 to a high of 42246, currently trading near 41666. Looking at the rebound during this period, it completely meets my previous expectations. From the weekly chart, it currently belongs to a candlestick with a small body and a long lower shadow, but due to insufficient volume, the pattern may not have much effect. Looking at the daily chart, what's interesting is that the MA120 moving average currently provides support, rebounding to near the position of the MA30 moving average. It belongs to a situation where the MA120 moving average has emerged, standing above the MA60 moving average, and being pressured by the MA30 moving average. Strictly speaking, the strength of BTC also depends on whether the position of the MA30 moving average can be broken through. Looking at the 4-hour chart, both the MA30 and MA60 moving averages have been broken through, currently being pressured by the MA120 moving average near 42300. There may be a short-term pullback, but perhaps the magnitude is not very large, as it is a rapid rise during an upward trend, which does not quite fit the timeline. Therefore, it is important to pay attention to the resistance near 42300 in the future. If it is broken through, there may be hope to reach near 44000, which would indicate a strong trend for BTC, but the probability may not be very high. Looking at the hourly chart, it is currently in a rebound during a downtrend, and all moving averages are above. From the hourly chart, the uptrend may continue, but due to the significant resistance near 42300, it is still advisable to be conservative in trading. My suggestion is: if BTC retraces to 41300, it is recommended to go long and wait for it to break through 42300 before exerting strong upward pressure. If it fails to break through 42300, there may be a greater possibility of a phased retracement. In a market like this, it's either staying out of the market and waiting for a retracement to go long, or waiting for a successful breakthrough of 42300 before going long, which is safer.

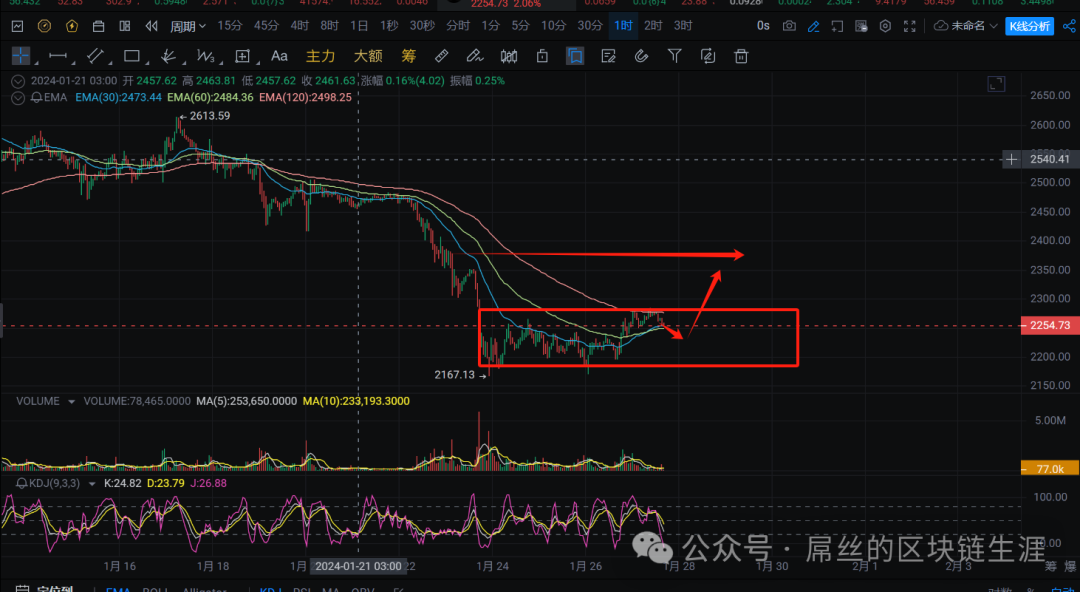
Ethereum (ETH) currently shows a relatively weak trend compared to BTC. Looking at the daily chart, although the MA120 moving average has not been reached, the trend is in a consolidation and oscillation phase, with a rebound during the downtrend. The support level on the daily chart is at 2050, and the upward pressure level is near 2380. Looking at the 4-hour chart, it is currently the first intersection of the price and the MA30 moving average, and the upper moving averages are still far from the price, so there is still a short-term demand for an uptrend. Overall, it may oscillate upwards, but when it touches near 2380, there will be a significant selling pressure, so it needs to be noted. Looking at the hourly chart, it is a range-bound area between 2170-2280, with all three moving averages above, indicating a normal trend. Overall, my suggestion is: if there is an opportunity to reach 2380, it is recommended to go long, and short positions can be entered, with a lower long position near 2230-2250, and the target is 2380.

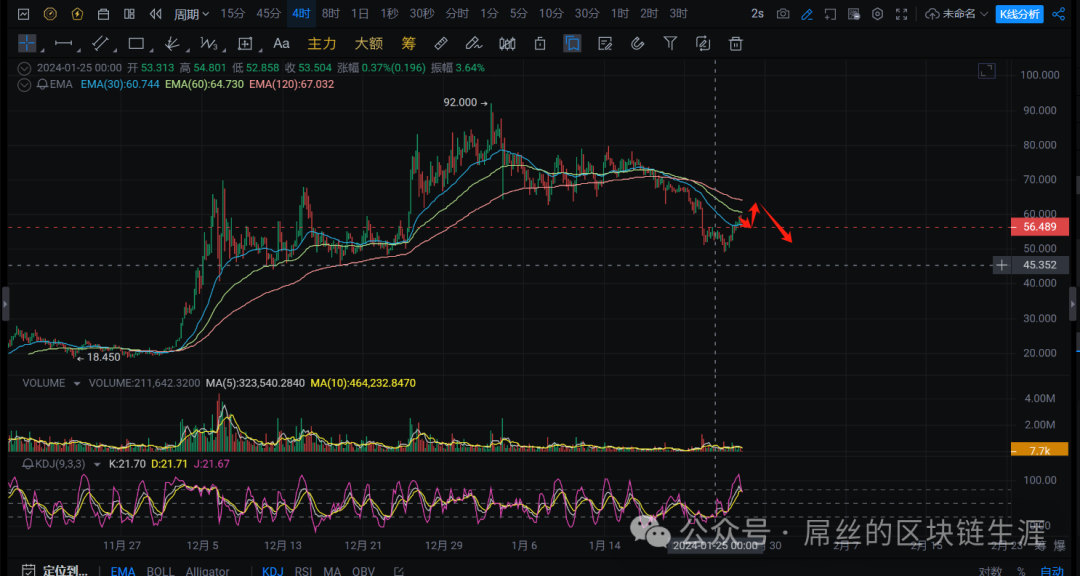
Ordi's recent trend has been quite eye-catching. The reason is the large fluctuations, which many people enjoy. Looking at the 4-hour chart, pay attention to the resistance level near 64 of the MA120 moving average, not exceeding by much. Personally, I feel that when this rebound reaches near 64, it must be exited, including for those who play spot trading. The reason is that Ordi has come down from a high position, and it is already clear that the approximate selling point for the big players is around 75, so it is almost impossible for Ordi to reach 75. After this rebound, Ordi will continue to decline on the daily chart. Of course, breaking below 50 is only a matter of time. Therefore, it is more appropriate to have a short-selling strategy for this coin, but I suggest that guidance is needed for this coin, as it has large fluctuations in small currencies, and contracts are easily unsustainable. Overall, my suggestion is: if you have long positions, hold on a bit longer, and when it reaches 64, many people doubt my judgment, but I can tell you openly here that it will definitely reach near 63, so rest assured. The important thing is what you do after reaching this level, whether you can calm down and not blindly believe that Ordi's bull market has returned, which is the most important thing.

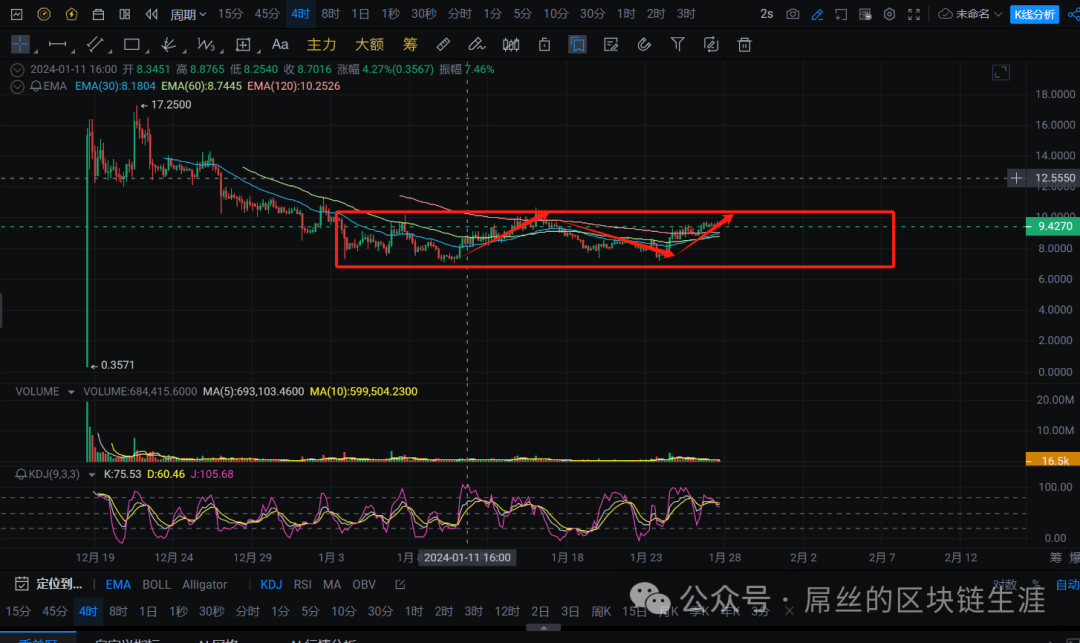
ACE, this coin has been recommended before and belongs to the gamefi sector. It is a WEB3 game. The circulating supply is only 22 million, and most of the coins are in a staked state, with many still locked. Looking at the market, it has not broken below 7 dollars after two attempts, and is currently oscillating between 7 and 10 dollars, overall forming a bottom oscillation W pattern. It is expected to have a wave of counterattacks in the future, so I suggest that everyone can buy a little, with an entry point at 9 dollars, and additional positions can be added at 8 dollars. Stop loss if it falls below 7 dollars, and the upward target can reach 20+.

All the above suggestions are personal opinions and do not constitute investment advice. There are risks in the coin circle, so trading needs to be cautious.
If you need to join the group, you can add the assistant's WeChat.


免责声明:本文章仅代表作者个人观点,不代表本平台的立场和观点。本文章仅供信息分享,不构成对任何人的任何投资建议。用户与作者之间的任何争议,与本平台无关。如网页中刊载的文章或图片涉及侵权,请提供相关的权利证明和身份证明发送邮件到support@aicoin.com,本平台相关工作人员将会进行核查。


