Market Review:
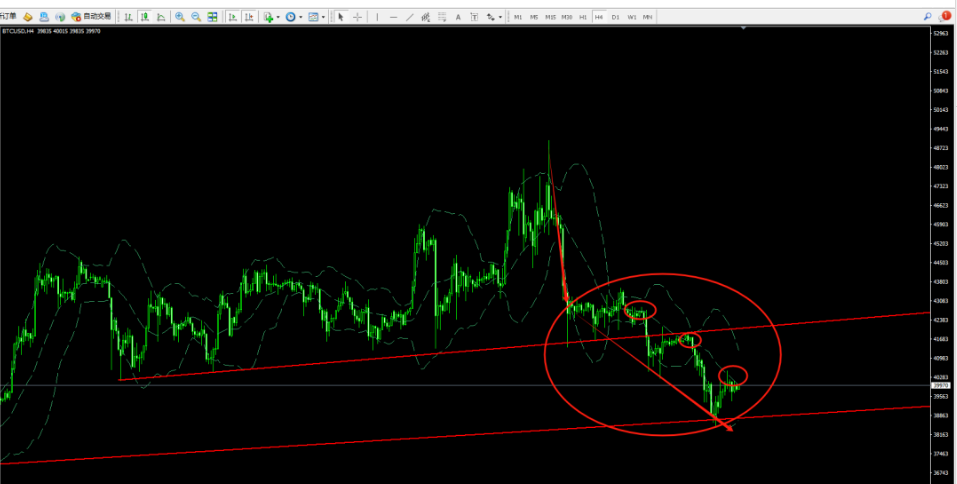
As shown in the chart, the upper chart is the 4-hour chart of BTC. The two arrows represent two market movements. The first movement is the rapid decline after reaching the peak of 49000. The second arrow indicates the continuation of the bearish trend after the first decline.
The large circle represents the overall trend of the current market. The small circle inside the large circle represents the suppression of the price of this market trend by the midline of the Bollinger Bands!
Is the analysis of these two movements clear and understandable? Yes, the market is actually that simple. Currently, the price is still being suppressed by the midline!
The Bollinger Bands are narrowing, indicating that the price is about to enter another period of oscillation.
Yesterday's trend was not satisfactory.
In connection with the previous article, the price encountered resistance at 40500 and 40600 and then immediately fell back, oscillating throughout the day. There was no clear trend. We did not provide a strategy for the evening, instead, we directly advised to observe. The price quickly reached 39700 after encountering resistance during the day, so there were no more bearish trends in the evening, but the bullish trend did not show much strength either. From the evening until now, the price has been maintaining a sideways movement of around 40000 plus or minus 200 points!
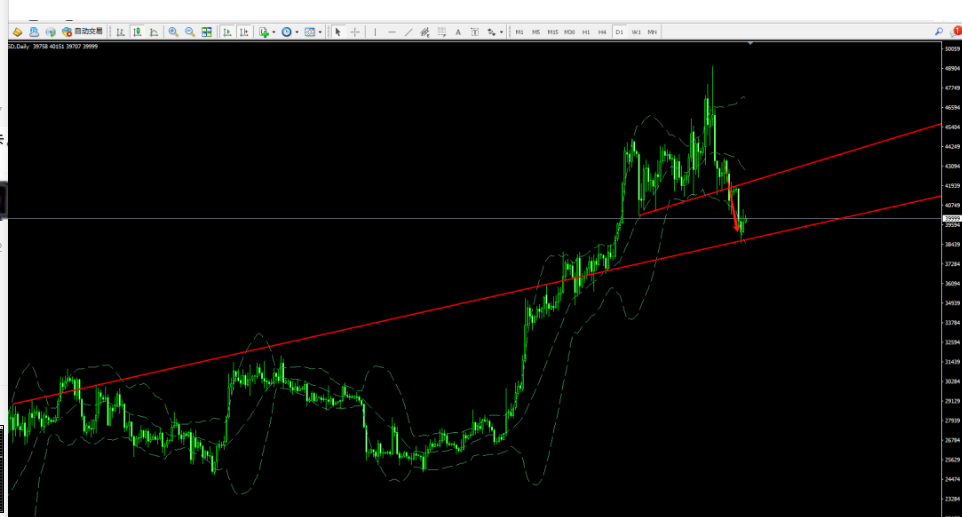
The upper chart is the daily chart of BTC. The volatility of the past two trading days has continued to narrow. There was only a fluctuation of no more than 1600 points throughout the day. As indicated by the arrows, the daily price still does not show signs of strength. Although the short-term is temporarily supported by the psychological level of 39000, the rebound from 38550 to 39000 did not show much strength. The daily chart is still in a downward wedge. The short-term 4-hour price is still being suppressed by the midline, and the Bollinger Bands are narrowing again, indicating that the price is about to enter another period of oscillation!
Market Outlook:
Has the short-term bottom been reached? Is the trend line support at 39000 the bottom?
The short-term 4-hour price is about to enter a period of oscillation. The daily price is still in a downward wedge. The temporary support at 39000 is not enough to establish the bottom! In the short term, it is still necessary to pay attention to the effectiveness of the support at the 39000 level.
It is advisable to adopt a wait-and-see strategy in the short term. Due to the narrowing volatility, the trend will enter a period of oscillation, and the potential profit space is not large, so it is recommended to adopt a wait-and-see approach!
The market has been changing rapidly recently. The short-term trading plan and strategy mentioned above need to be adjusted based on real-time market conditions! It is better to spend more time observing the market and less time trading!
For more real-time and accurate price strategies, please pay attention to the real-time prompts in the trading cockpit!
Trade your plan, plan your trade!
The market has been changing rapidly recently, with large fluctuations. Risk management is essential for trading! If there are any changes in the intraday prices or precise real-time price opportunities, the trading cockpit will provide real-time prompts!
All analysis and judgments are probabilistic predictions. The market is risky, so speculation should be cautious!
2024.1.25

免责声明:本文章仅代表作者个人观点,不代表本平台的立场和观点。本文章仅供信息分享,不构成对任何人的任何投资建议。用户与作者之间的任何争议,与本平台无关。如网页中刊载的文章或图片涉及侵权,请提供相关的权利证明和身份证明发送邮件到support@aicoin.com,本平台相关工作人员将会进行核查。


