In 2023, driven by the strong performance of Bitcoin and Ethereum, the total market value of cryptocurrencies grew by over 108%.
Source: Coinbase & Glassnode
Translation: Yanan, BitpushNews
This guide is a research report jointly created by Coinbase Institutional and Glassnode, providing in-depth analysis of the most critical cryptocurrency market indicators and trends for institutional investors.
Market Overview
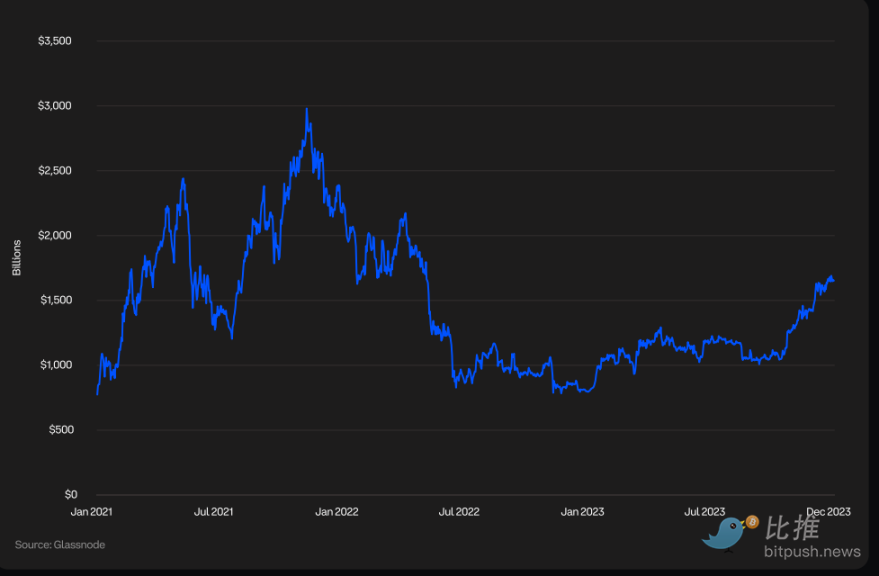
Total Market Value of Cryptocurrencies
The total market value of cryptocurrencies is an important indicator reflecting the value of the global digital asset market, covering Bitcoin (BTC), Ethereum (ETH), tokens, and stablecoins, among others. In 2023, driven by the strong performance of Bitcoin and Ethereum, the total market value of cryptocurrencies grew by over 108%.
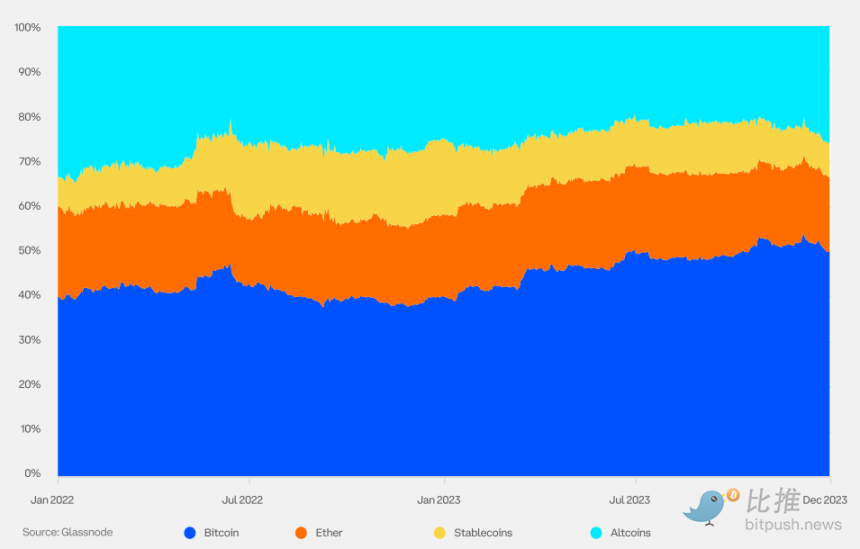
Cryptocurrency Dominance
Cryptocurrency dominance measures the percentage of a specific cryptocurrency's market value in relation to the total market value of all cryptocurrencies. In 2023, as the market outlook for the approval of Bitcoin spot ETFs became increasingly bullish, and funds shifted towards high-quality assets, the dominance of Bitcoin increased. Some market participants also view the potential price catalyst of the Bitcoin halving in April 2024.
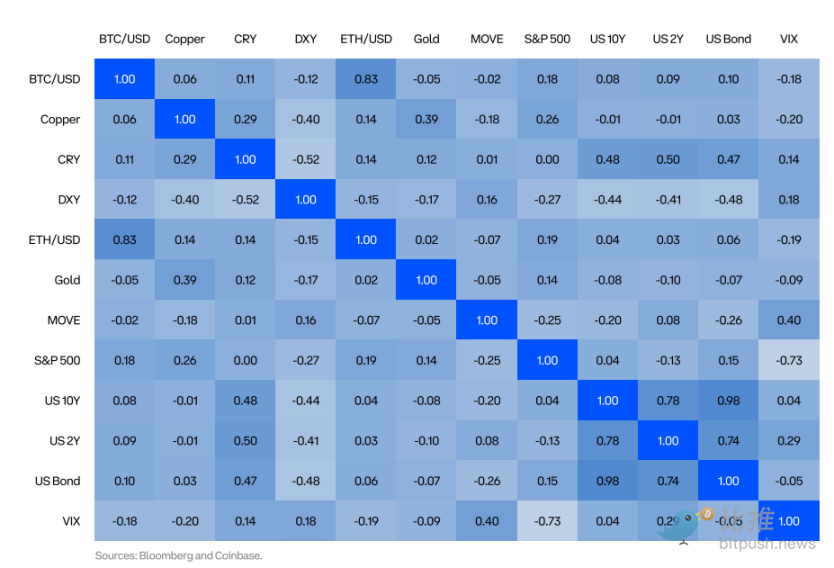
Correlation
Historically, cryptocurrencies have had a low correlation with traditional asset classes. 2022 was an exception, as almost all assets experienced synchronous declines, but in 2023, the market returned to historical norms, indicating that cryptocurrencies could become one of the non-systemic sources of risk.
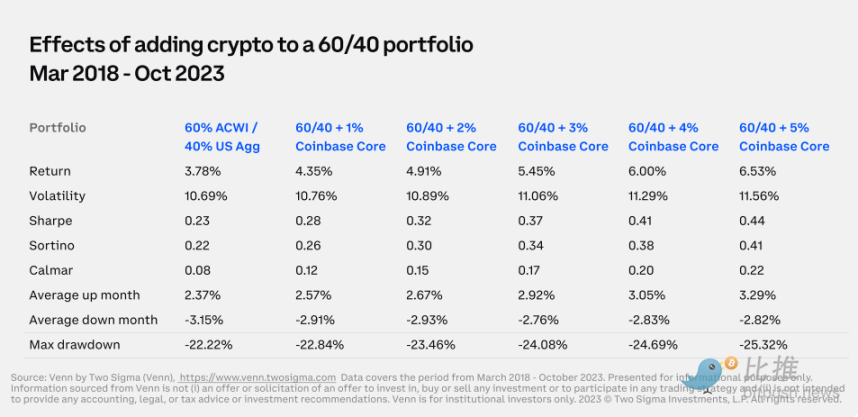
Portfolio Diversification
Allocating cryptocurrencies helps diversify risks and enhance returns in traditional investment portfolios. In this table, we analyze the impact of a small allocation of the Coinbase Core Index (COINCORE) in a portfolio composed of 60% MSCI ACWI and 40% US Agg. COINCORE is a market-weighted cryptocurrency index, rebalanced quarterly, with Bitcoin and Ethereum accounting for 65.3% and 28.7% of the weight, totaling nearly 94%. The period covered is from March 2018 to October 2023, encompassing two major fluctuations in the cryptocurrency market. The results show that after adding COINCORE, the portfolio's absolute return and risk-adjusted return both improved.
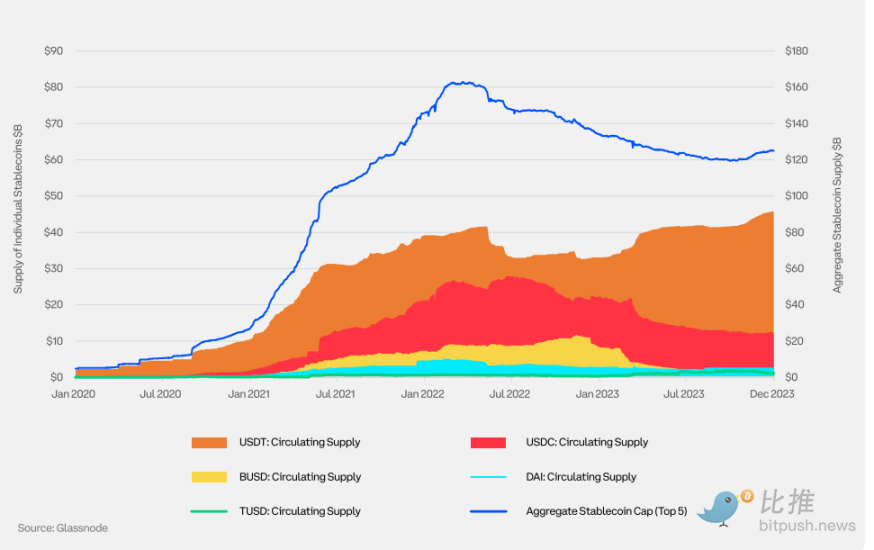
Circulating Supply of Stablecoins
Stablecoins are digital currencies designed to maintain stable value. They are typically pegged to the US dollar or other fiat currencies at a fixed exchange rate of 1:1 and hold corresponding reserve assets. Fiat-backed stablecoins dominate the stablecoin market. When evaluating stablecoins, market participants should focus on the quantity and type of reserve assets.
Bitcoin
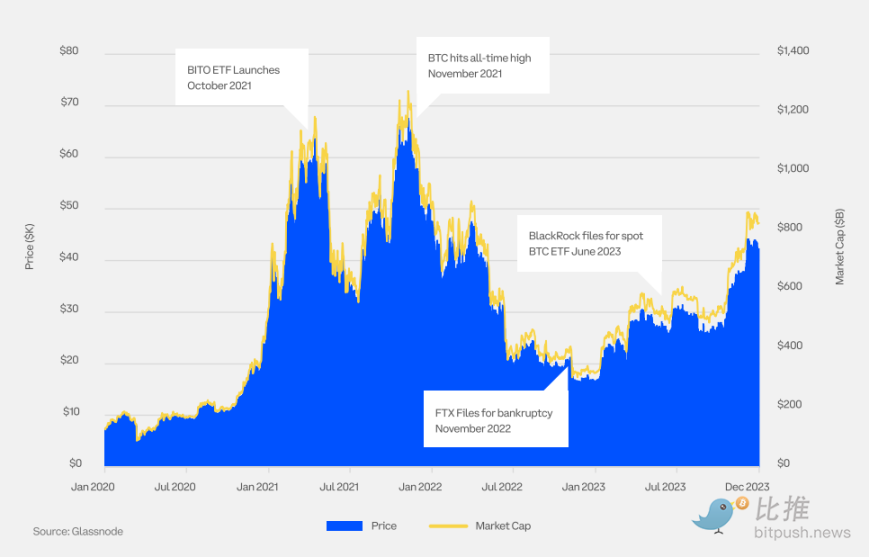
BTC Price and Market Value
In 2023, the price of Bitcoin increased by over 155%. Market participants were encouraged by various factors, including the slowdown in inflation and the increasing likelihood of approval for spot cryptocurrency exchange-traded funds (ETFs).
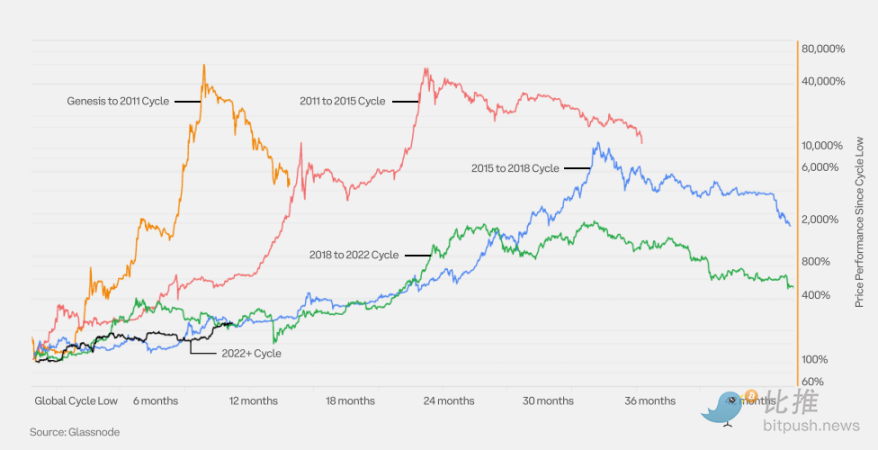
BTC Price Performance Since Cycle Low
Bitcoin has experienced four complete bull and bear cycles. In this chart, we can observe the comparison between the current market cycle starting in 2022 and previous cycles.
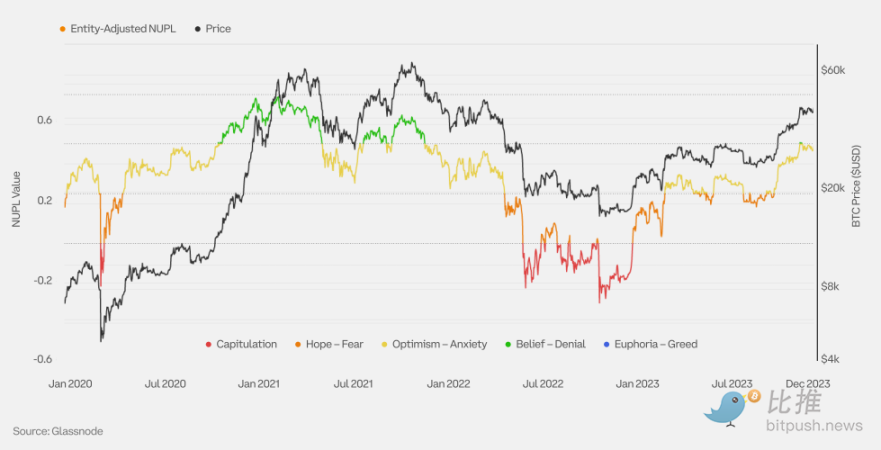
Net Unrealized Profit/Loss (NUPL) Adjusted for BTC Entity Holdings
Net Unrealized Profit/Loss (NUPL) refers to the difference between relative unrealized profits and relative unrealized losses. Adjusted NUPL excludes transactions between the same entity addresses ("internal" transactions) to more accurately measure actual economic activity and provide more optimized market signals than unadjusted NUPL.
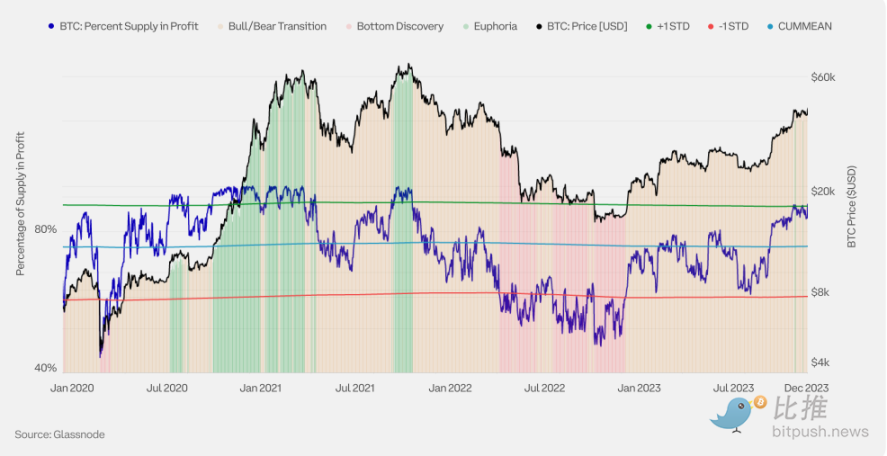
BTC Supply Profitability
The circulating supply of cryptocurrencies consists of the loss supply (all coins with a cost basis higher than the current spot price) and the profit supply (all coins with a cost basis lower than the current spot price). Observing supply profitability helps reveal the position of cryptocurrency prices in the current market cycle. Previous cryptocurrency market cycles have three characteristic stages:
- Bottom discovery period: In the final stage of a bear market, when long-term price depreciation leads to an increase in the proportion of loss supply (percentage of profit supply <55%).
- Frenzy period: During a bull market, when prices exhibit parabolic upward trends, the proportion of profit supply dominates (percentage of profit supply >95%).
- Bull-bear transition period: A transitional period between the bottom discovery period and the frenzy period, during which supply profitability is closer to a balanced state (percentage of profit supply between 55% and 95%).
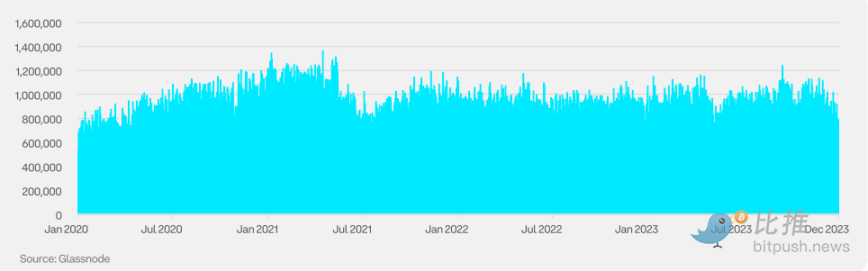
Daily Active Addresses of BTC
The number of active addresses refers to the unique addresses actively involved in sending or receiving on the network, and this metric is crucial for measuring user adoption, network conditions, and economic activity.
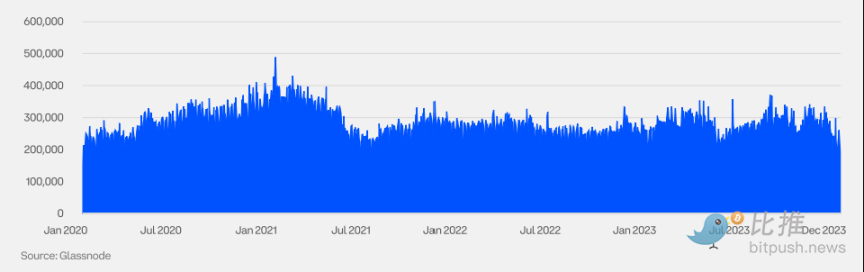
Daily Active Entities of BTC
Although the number of active addresses is an important indicator, a single entity can have multiple addresses, so we also need to focus on the number of active entities. An entity is defined as a cluster of addresses controlled by the same network entity, and these address clusters are estimated using advanced heuristics and Glassnode's proprietary clustering algorithm. Here, "advanced heuristics" refers to a complex method or technique based on experience, knowledge, and observed patterns used for estimation or decision-making in situations with incomplete information.
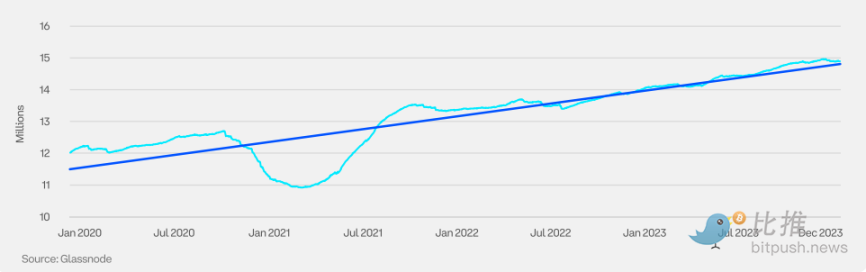
Total Supply Held by BTC Long-Term Holders
Glassnode defines Long-Term Holders (LTHs) as investors who hold cryptocurrencies for at least 155 days. This holding period typically indicates a reduced likelihood of these assets being sold. Therefore, observing the activity patterns of long-term holders can serve as an effective indicator for predicting cyclical fluctuations in the cryptocurrency market, helping to identify potential peaks and troughs.
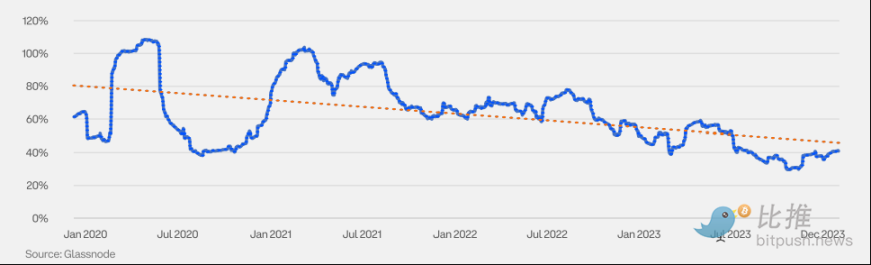
Annualized 3-Month Volatility of BTC
As cryptocurrencies mature as an asset class and institutional participation increases, their volatility shows a steady downward trend.
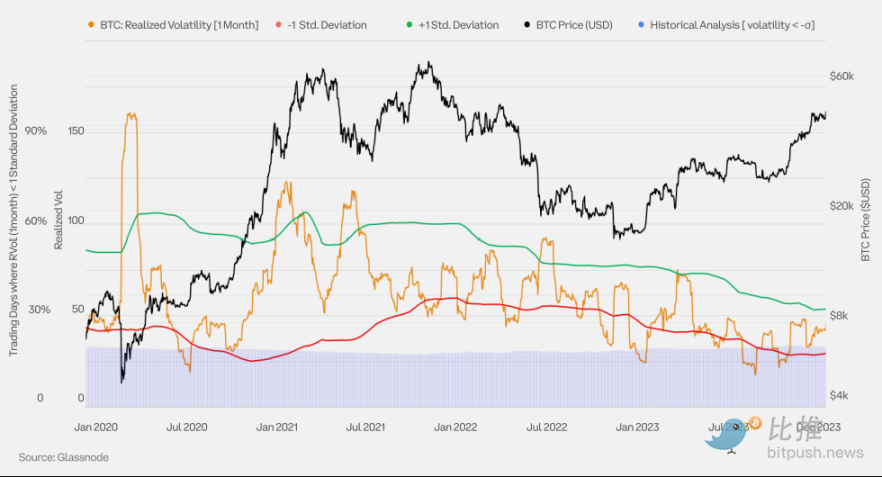
BTC Monthly Realized Volatility Bands
This chart uses Bollinger Bands to analyze one month of realized volatility to identify potential volatility turning points. If the volatility deviates more than one standard deviation from the monthly average, there is a higher likelihood of a reversal.
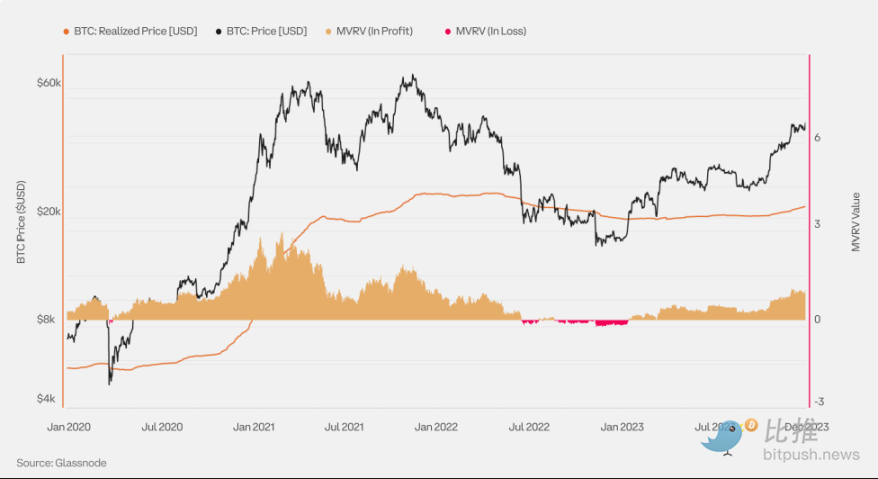
BTC Realized Price and MVRV
Realized price refers to the average price of cryptocurrency supply, calculated based on the value of each coin on the last day of on-chain transactions; it is typically considered the on-chain cost basis of the market. MVRV stands for Market Value to Realized Value; it represents the ratio between market value (spot price) and realized value (realized price). An MVRV of 2.0 means the current price is twice the market's average cost basis (average holder profit is twice).
An MVRV of 1.0 means the current price equals the market's average cost basis (average holder is at breakeven).
An MVRV of 0.50 means the current price is 50% lower than the market's average cost basis (average holder is at a 50% loss).
Extreme MVRV values can reveal periods of market overheating or undervaluation, as well as periods when investors' profits are far above or below the average level (i.e., realized price).
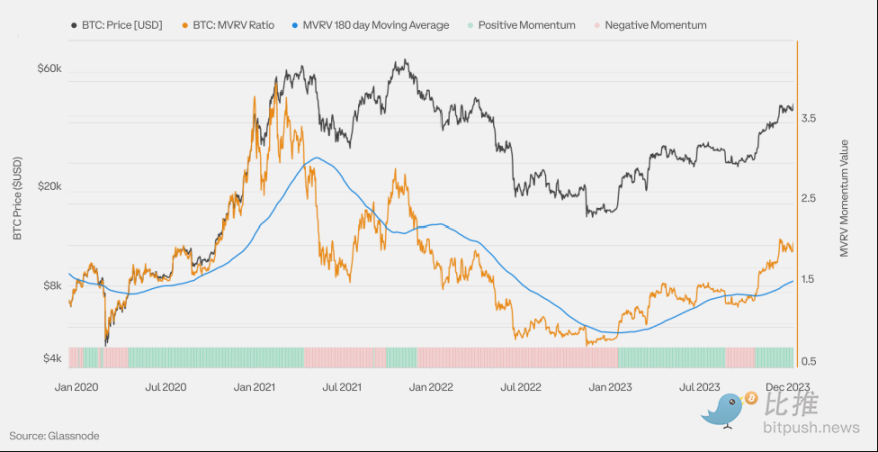
BTC MVRV Momentum
This chart shows the MVRV ratio and a six-month simple moving average (SMA) used as a momentum indicator. Periods where MVRV is higher than the six-month SMA typically describe an upward trend in the macro market, while periods below this line typically describe a downward trend.
Turning points often manifest as a strong breakthrough of the MVRV above or below the six-month SMA. A strong breakthrough above the SMA indicates a large amount of BTC acquired at levels below the current price, while a strong breakthrough below indicates a large amount of BTC acquired at levels above the current price.
BTC Derivatives
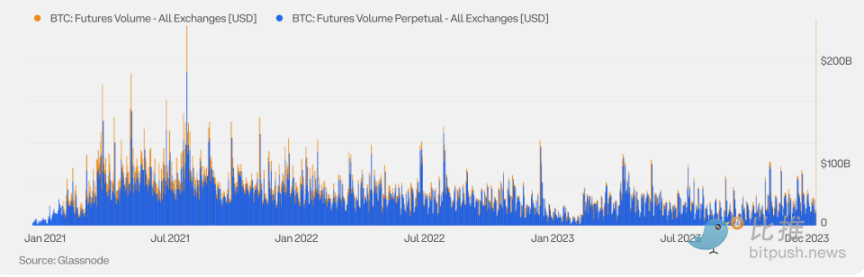
BTC Futures Trading Volume
The trading volume of crypto futures is divided into traditional futures (also known as fixed-term or calendar futures) and perpetual futures (perps), the latter being unique to cryptocurrencies. Perpetual futures have no expiration date, so holders do not need to roll over their positions.
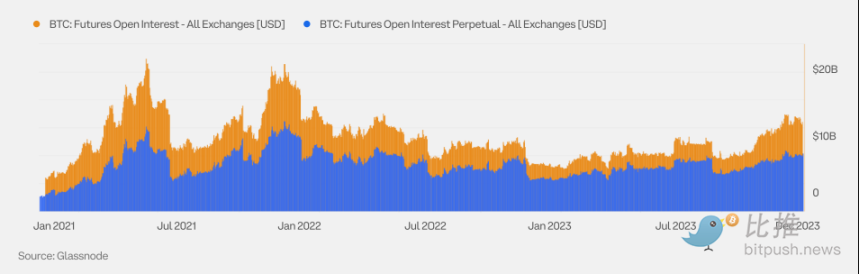
BTC Futures Open Interest
Although perpetual futures are the mainstay of BTC futures trading, traditional futures still play an important role in BTC futures open interest due to widespread use in hedging and spot arbitrage trading.
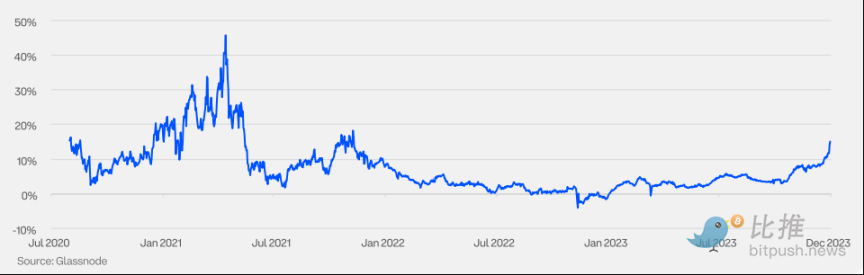
BTC Futures Annualized Rolling Basis (3M)
The basis in the cryptocurrency market has historically been positive (excluding market dislocations). Extreme fluctuations in the basis, whether positive or negative, are often related to significant fluctuations in market sentiment.
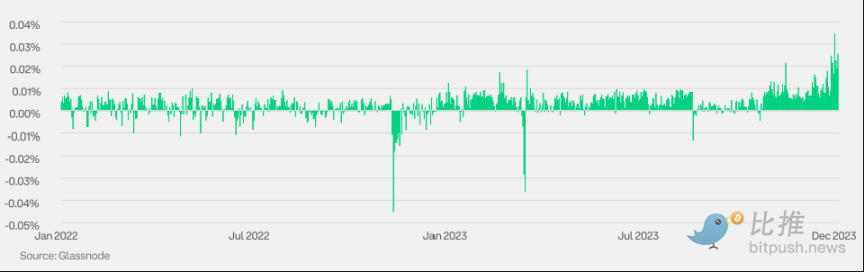
BTC Perpetual Futures Funding Rate
Since perpetual futures have no expiration date, holders do not need to roll over their positions. To maintain a reasonable gap between the price and the spot price, perpetual futures introduce a funding rate mechanism. This rate regularly transfers between longs and shorts: when the funding rate is positive, longs pay shorts; when the funding rate is negative, shorts pay longs.
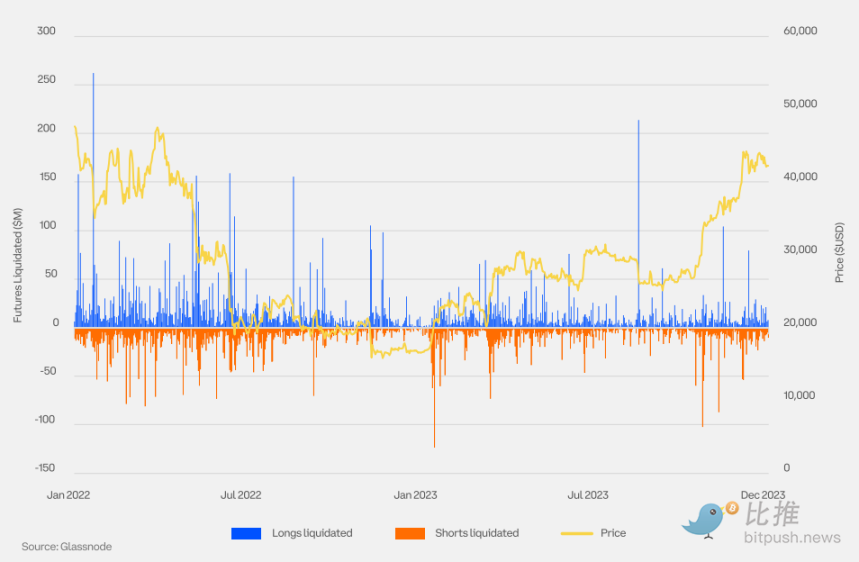
BTC Perpetual Futures Liquidation
Liquidation refers to the forced closure of futures positions by the exchange when a portion or all of the initial margin of the futures position is lost. Large-scale liquidations may indicate a sharp price fluctuation top or bottom.
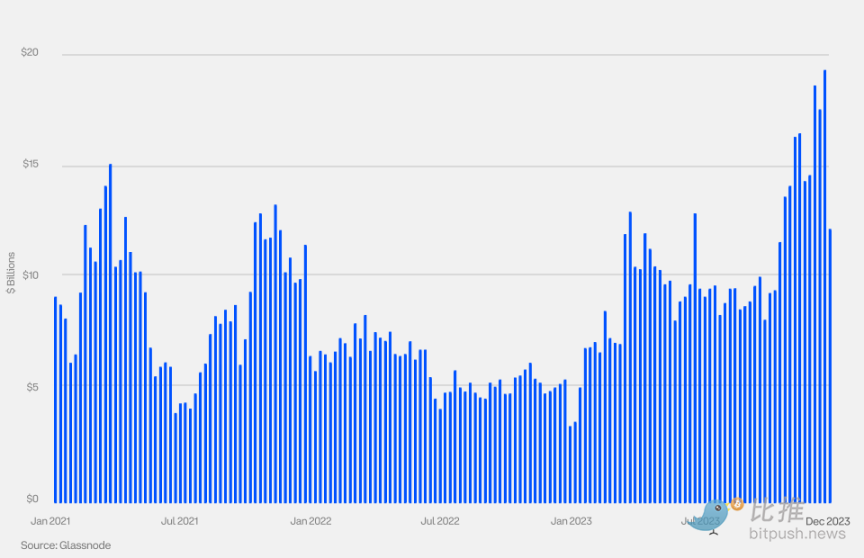
BTC Options Open Interest
With more institutional investors entering this field, the open interest of BTC options increased in 2023. In October 2023, the open interest of BTC options exceeded BTC futures for the first time.
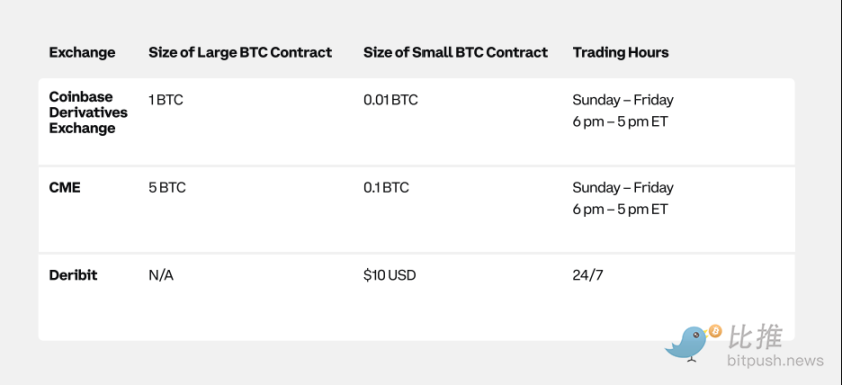
BTC Traditional Futures Specifications
Bitcoin futures are offered by multiple exchanges with different scales and denominations.
Market Events Ahead for BTC: Bitcoin Halving
We predict that the upcoming Bitcoin halving in the second quarter of 2024 may boost token performance. However, this correlation remains speculative as supporting evidence is limited. There have only been three halvings in history, and a clear pattern has not yet emerged, especially considering the influence of various factors such as global liquidity measures on previous events.
Ethereum
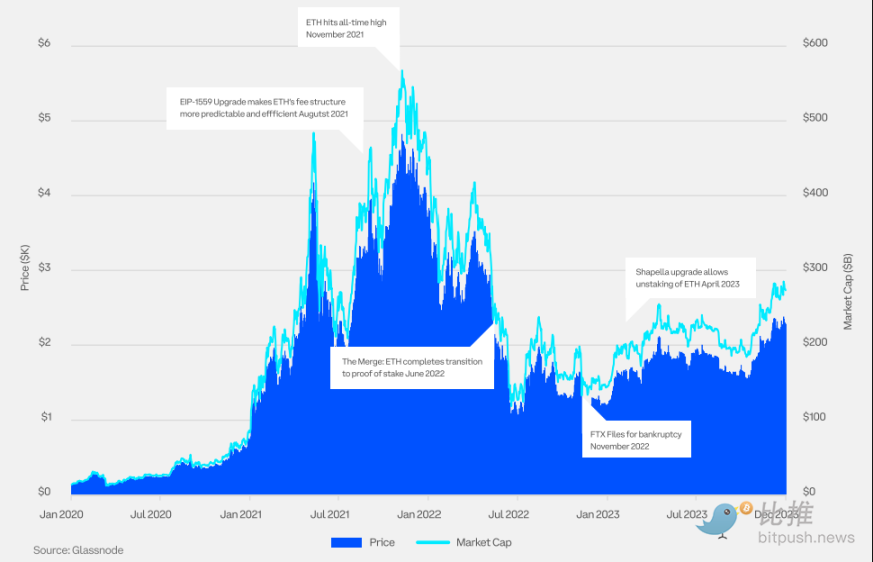
Ethereum (ETH) Price and Market Cap
In 2023, the price of Ethereum (ETH) rose by over 90%, thanks to the successful Shapella upgrade and the increasingly promising prospect of approval for a cryptocurrency spot trading open-ended index fund (ETF), which has encouraged market participants.
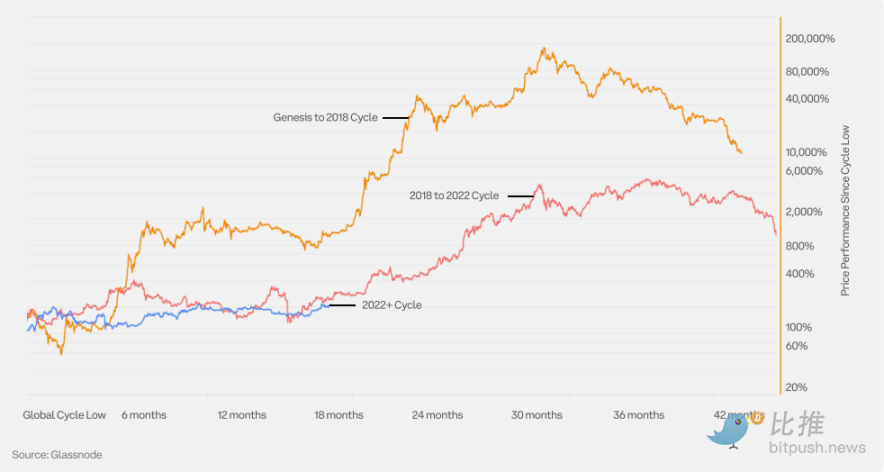
Price Performance Since Cycle Low
Ethereum has experienced two complete bull and bear cycles. In this chart, we can observe the current market cycle starting in 2022 compared to the previous cycle.
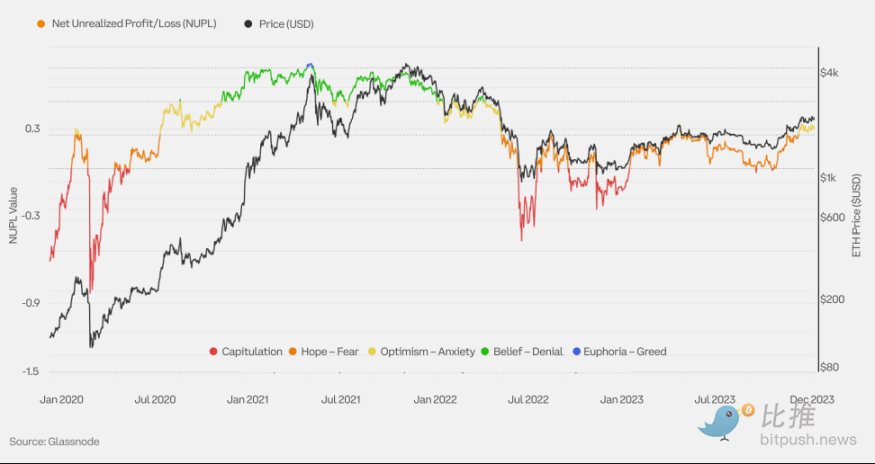
Ethereum Net Unrealized Profit/Loss (NUPL)
Net unrealized profit/loss refers to the difference between relative unrealized profits and relative unrealized losses.
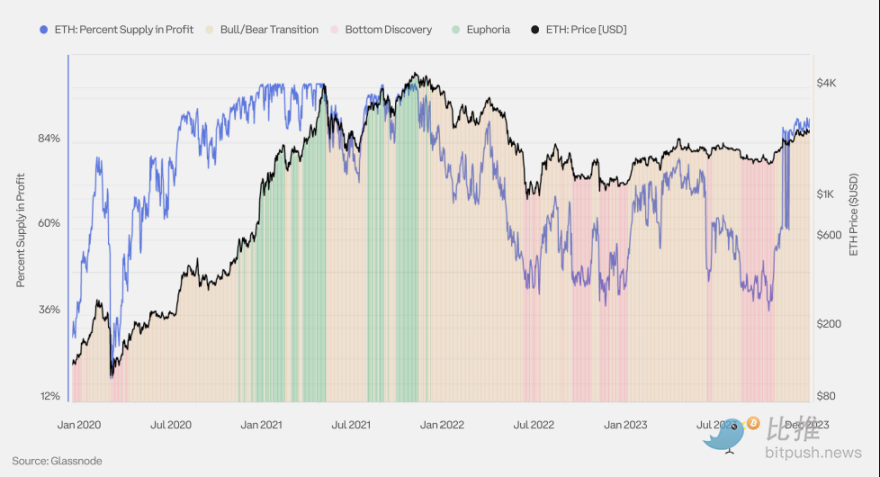
Ethereum (ETH) Supply Profit/Loss Status
The circulating supply of cryptocurrencies consists of loss supply (all coins with a cost basis higher than the current spot price) and profit supply (all coins with a cost basis lower than the current spot price). Observing the supply profitability helps reveal the position of cryptocurrency prices in the current market cycle. Previous cryptocurrency market cycles have three stages:
Bottom discovery stage: In the final stage of a bear market, when prolonged price depreciation leads to an increase in the proportion of loss supply (percentage of profit supply is 55%), the market enters the bottom discovery stage.
Frenzy stage: When there is a parabolic price increase trend during a bull market, the proportion of profit supply dominates (percentage of profit supply > 95%), and the market enters the frenzy stage.
Bull-bear transition stage: This is the transitional period between the bottom discovery stage and the frenzy stage, during which the profitability status of the supply is closer to balance (percentage of profit supply is between 55% and 95%).
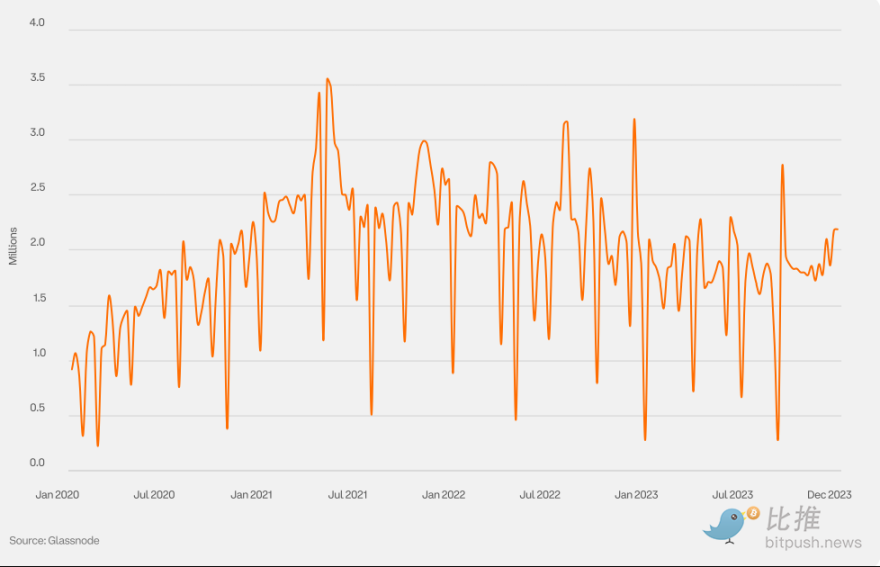
Ethereum (ETH) Weekly Active Addresses
The number of active addresses refers to the unique number of addresses participating as senders or receivers in network activity. It is an important indicator for measuring user adoption, network health, and economic activity.
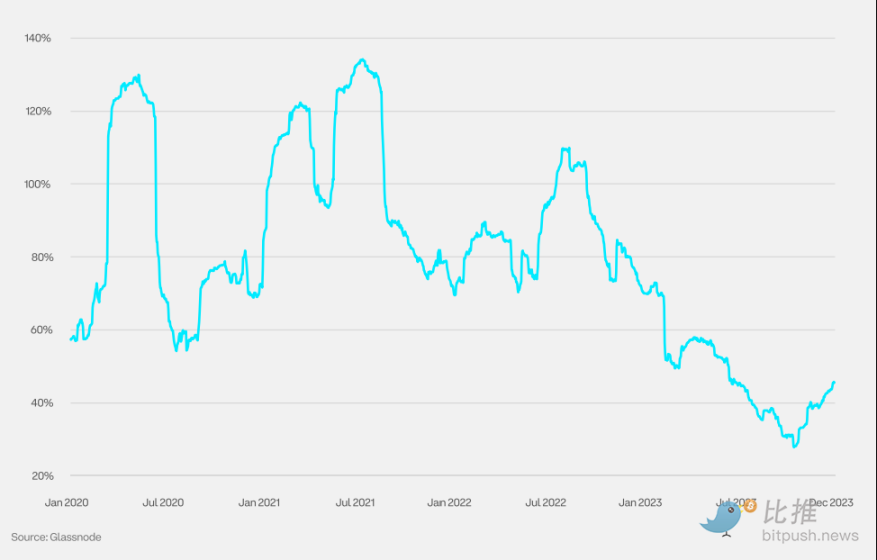
Ethereum Annualized 3-Month Volatility
As cryptocurrencies mature as an asset class and institutional participation increases, volatility shows a steady downward trend.
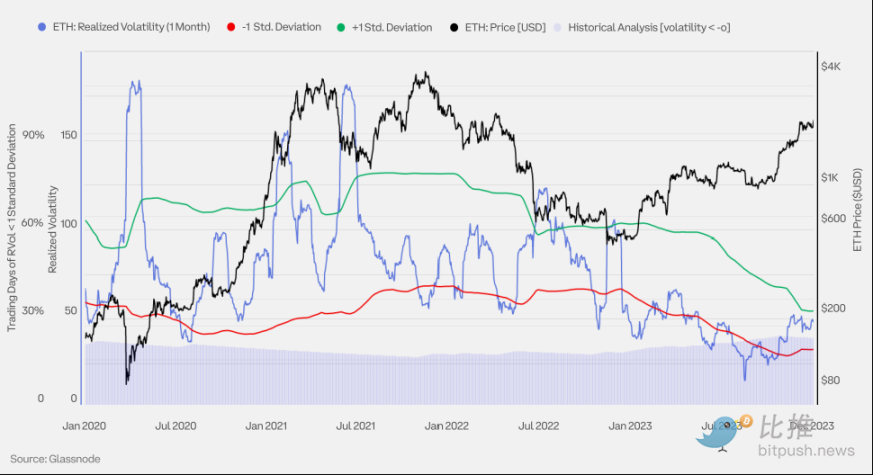
Ethereum Monthly Realized Volatility Bands
This chart uses Bollinger Bands to analyze one month of realized volatility to identify potential volatility turning points. If the volatility deviates more than one standard deviation from the monthly average, there is a higher likelihood of a reversal.
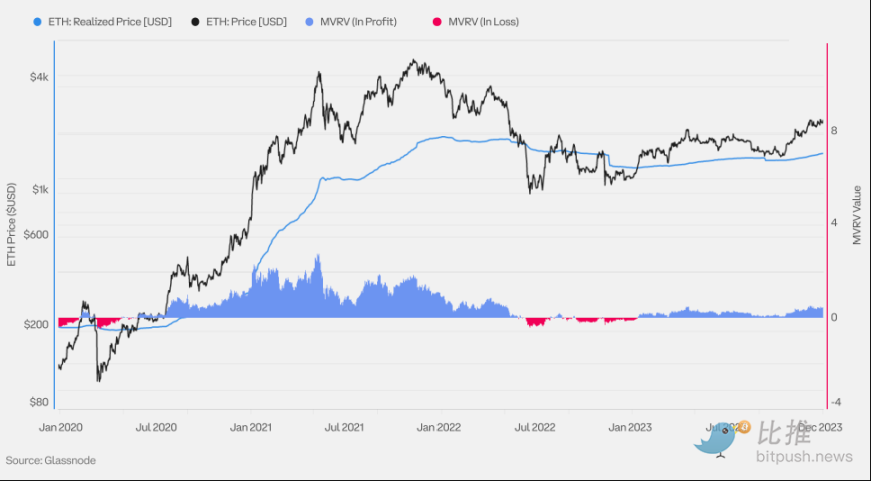
Ethereum (ETH) Realized Price and MVRV
Realized price refers to the average price of cryptocurrency supply, calculated based on the value of each coin on the last day of on-chain transactions; it is typically considered the on-chain cost basis of the market. MVRV stands for Market Value to Realized Value; it represents the ratio between market value (spot price) and realized value (realized price).
An MVRV of 2.0 means the current price is twice the market's average cost basis (average holder profit is twice).
An MVRV of 1.0 means the current price equals the market's average cost basis (average holder is at breakeven).
An MVRV of 0.50 means the current price is 50% lower than the market's average cost basis (average holder is at a 50% loss).
Extreme MVRV values help identify periods of market overheating or undervaluation, as well as periods when investors' profitability significantly deviates from the average (realized price).
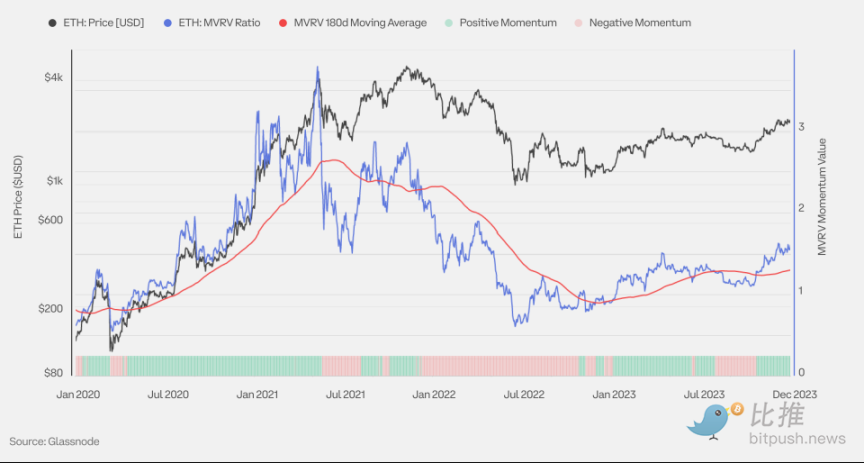
Ethereum (ETH) MVRV Momentum
This chart shows the MVRV ratio and a six-month simple moving average (SMA) used as a momentum indicator. Periods where MVRV is higher than the six-month SMA typically describe an upward trend in the macro market, while periods below this line typically describe a downward trend.
Turning points often manifest as a strong breakthrough of the MVRV above or below the six-month SMA. A strong breakthrough above the SMA indicates a large amount of ETH acquired at levels below the current price, while a strong breakthrough below indicates a large amount of ETH acquired at levels above the current price.
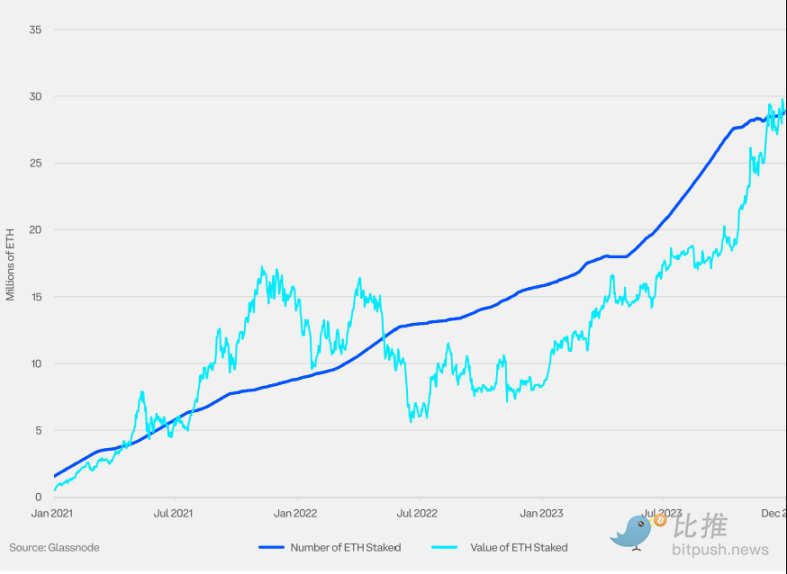
Ethereum (ETH) Total Staked Value
Staking is a way of investing in proof-of-stake (PoS) blockchains, where token holders secure the network by staking assets and receive additional tokens as rewards. To stake ETH, holders need to stake at least 32 ETH and run a validator node.
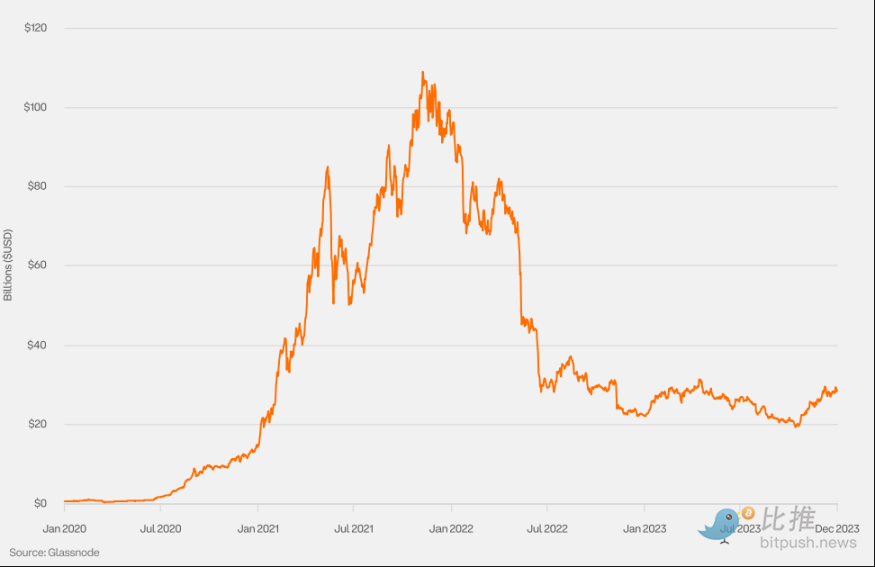
Total Locked Value (TVL) in DeFi for Ethereum (ETH)
Total Locked Value (TVL) is the total value of assets deposited in smart contracts or decentralized applications on the Ethereum blockchain, covering ETH, stablecoins, and various tokens. It is an important indicator for evaluating financial activities and liquidity within the Ethereum ecosystem.
Ethereum (ETH) Derivatives
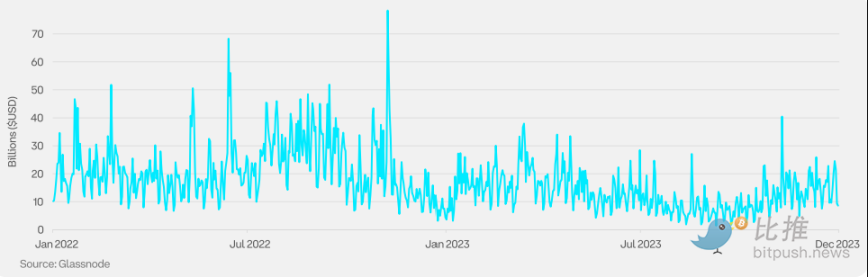
Ethereum Perpetual Futures Trading Volume
The trading volume of crypto futures is divided into traditional futures (also known as fixed-term or calendar futures) and perpetual futures (perps), the latter being unique to cryptocurrencies. Perpetual futures have no expiration date, so holders do not need to roll over their positions. The trading volume of Ethereum futures is dominated by perpetual futures.
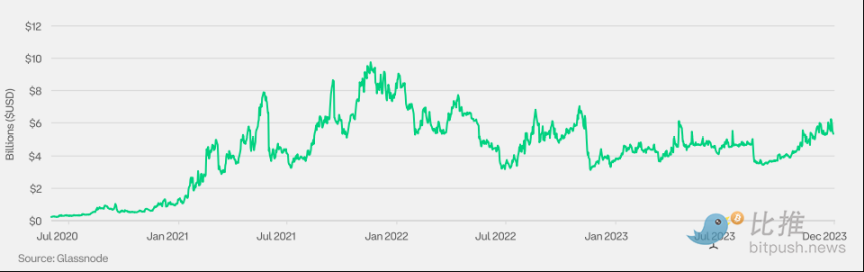
Ethereum Perpetual Futures Open Interest
The open interest of Ethereum futures is mainly concentrated in perpetual futures, while the trading volume of traditional futures is relatively low.
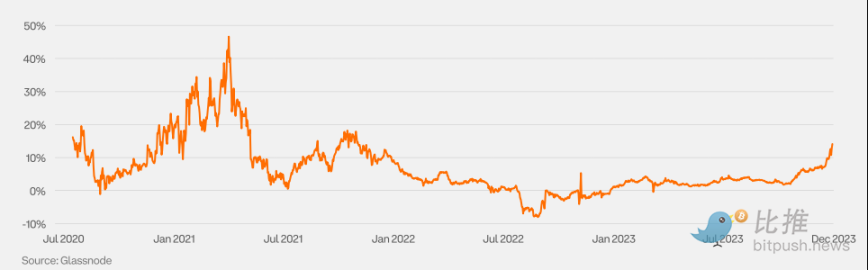
Ethereum Futures Annualized Rolling Basis (3M)
The basis in the crypto market is usually positive. Its extreme fluctuations, whether positive or negative, are closely linked to the market's sentiment.
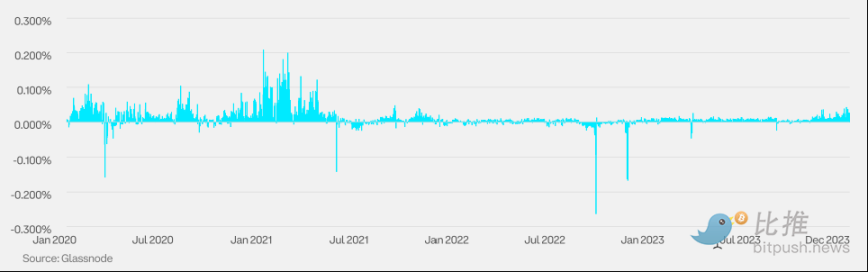
Ethereum Perpetual Futures Funding Rate
To maintain a reasonable difference between the price and the spot price, perpetual futures introduce a funding rate mechanism. This rate regularly transfers between longs and shorts: when the funding rate is positive, longs pay shorts; when the funding rate is negative, shorts pay longs.
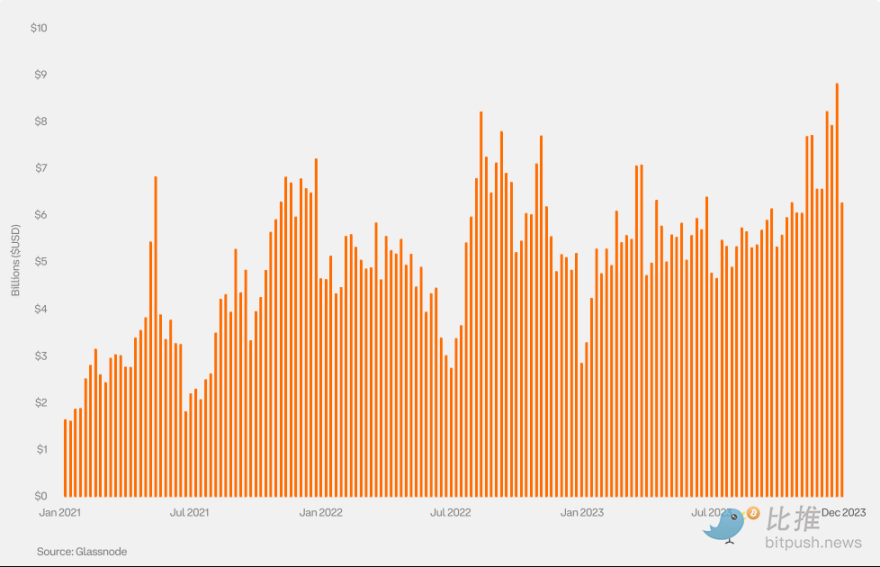
Ethereum (ETH) Options Open Interest (Weekly)
With market participants increasingly bullish on the prospects of a spot ETF and Ethereum's development in 2024, the open interest of Ethereum options reached a historical high in the fourth quarter of 2023.
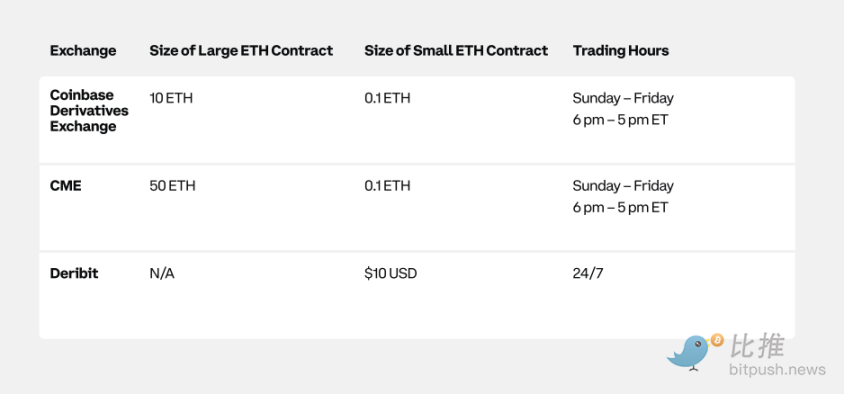
Ethereum (ETH) Traditional Futures Specifications
Ethereum futures are offered by multiple exchanges with different scales and denominations.
Market Events Ahead for Ethereum (ETH)
Following the successful completion of the Shapella upgrade, the Ethereum community is eagerly anticipating the arrival of the Cancun ("Decun") upgrade, expected to be implemented in the first quarter of 2024. The Cancun upgrade will primarily strengthen the scalability and security of the Ethereum network by introducing Proto-Danksharding. The design goal of Proto-Danksharding is to significantly reduce the cost of second-layer transactions and significantly increase the Ethereum network's transaction processing capacity per second.
免责声明:本文章仅代表作者个人观点,不代表本平台的立场和观点。本文章仅供信息分享,不构成对任何人的任何投资建议。用户与作者之间的任何争议,与本平台无关。如网页中刊载的文章或图片涉及侵权,请提供相关的权利证明和身份证明发送邮件到support@aicoin.com,本平台相关工作人员将会进行核查。


